
BTC Tight Around $27K: Calm Before The Storm? (Bitcoin Price Analysis)
Bitcoin has been stuck in a range in the last few days following a rejection from the $30K resistance level. There are various points for market participants to look forward to in the short term.
Technical Analysis
By: Edris
The Daily Chart
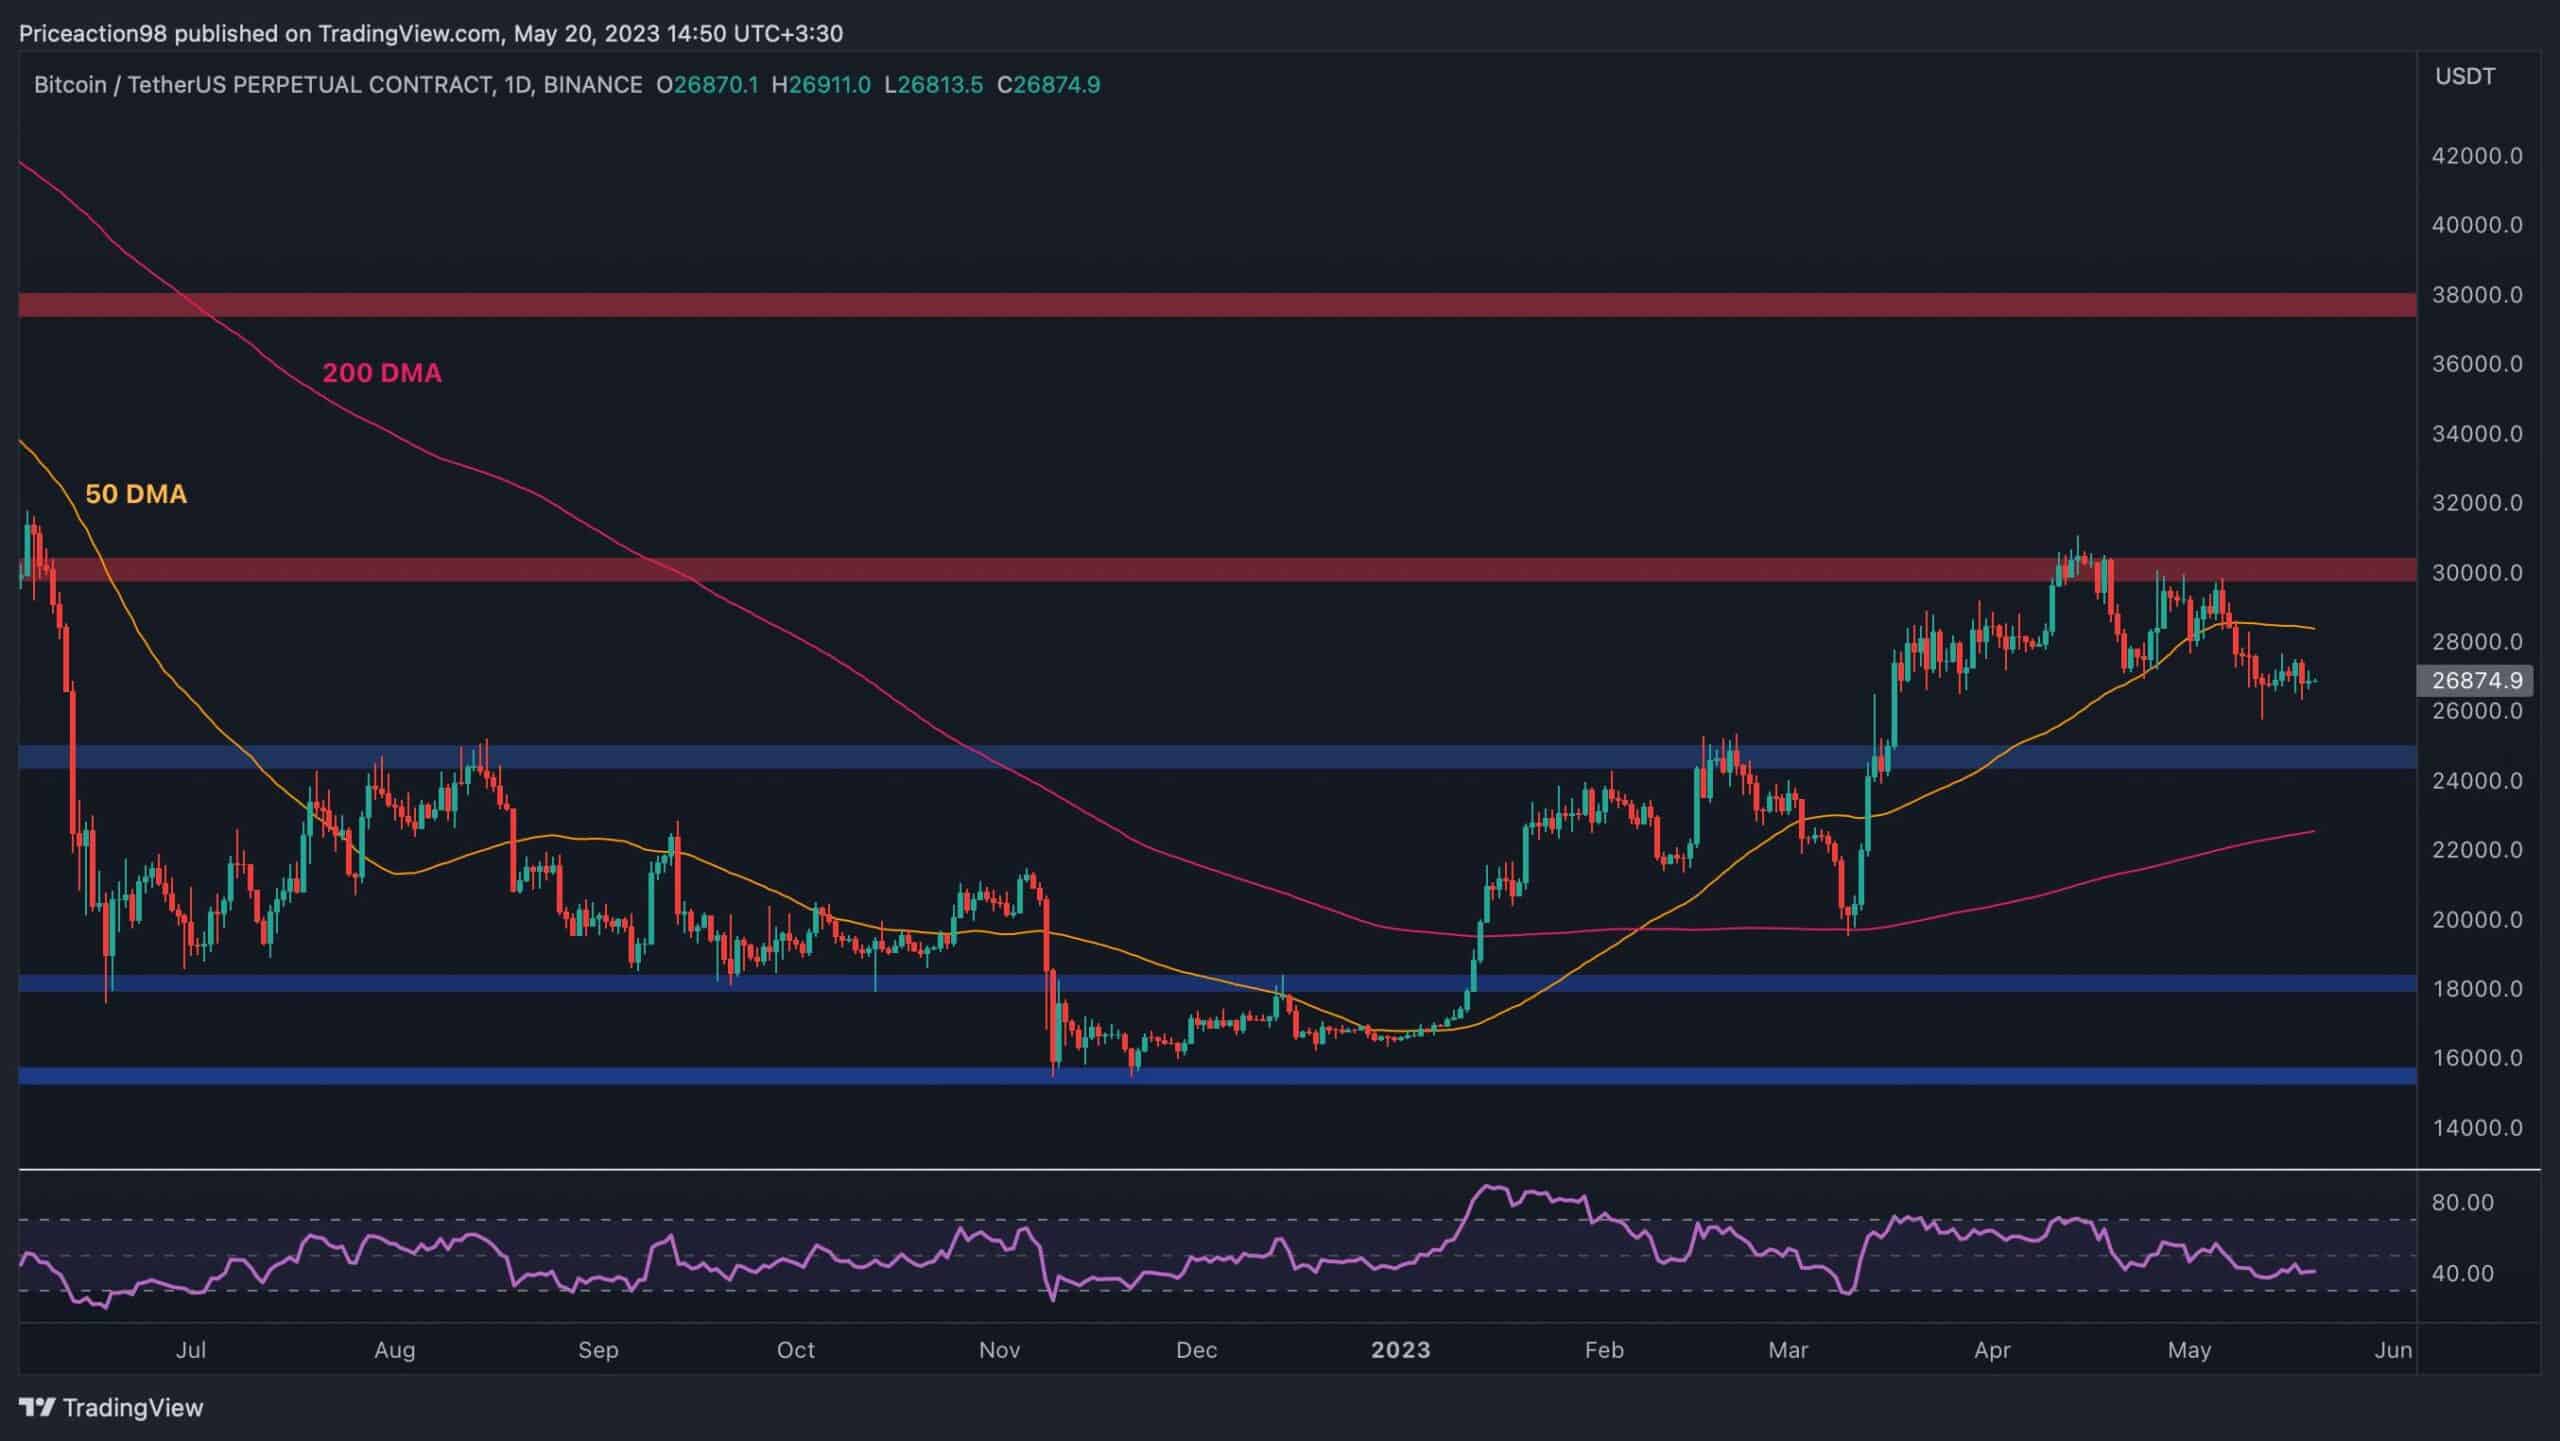
On the daily timeframe, the price has been consolidating in a very tight range over the last week. This comes after the $30K resistance level rejected the market to the downside. The 50-day moving average was also broken down around the $29K mark.
Currently, the most probable target is $25Kl. Yet, the price could retest the 50-day moving average first before continuing lower toward that level.
The RSI is also trending below the 50% threshold, pointing to the current dominance of sellers.
The 4-Hour Chart
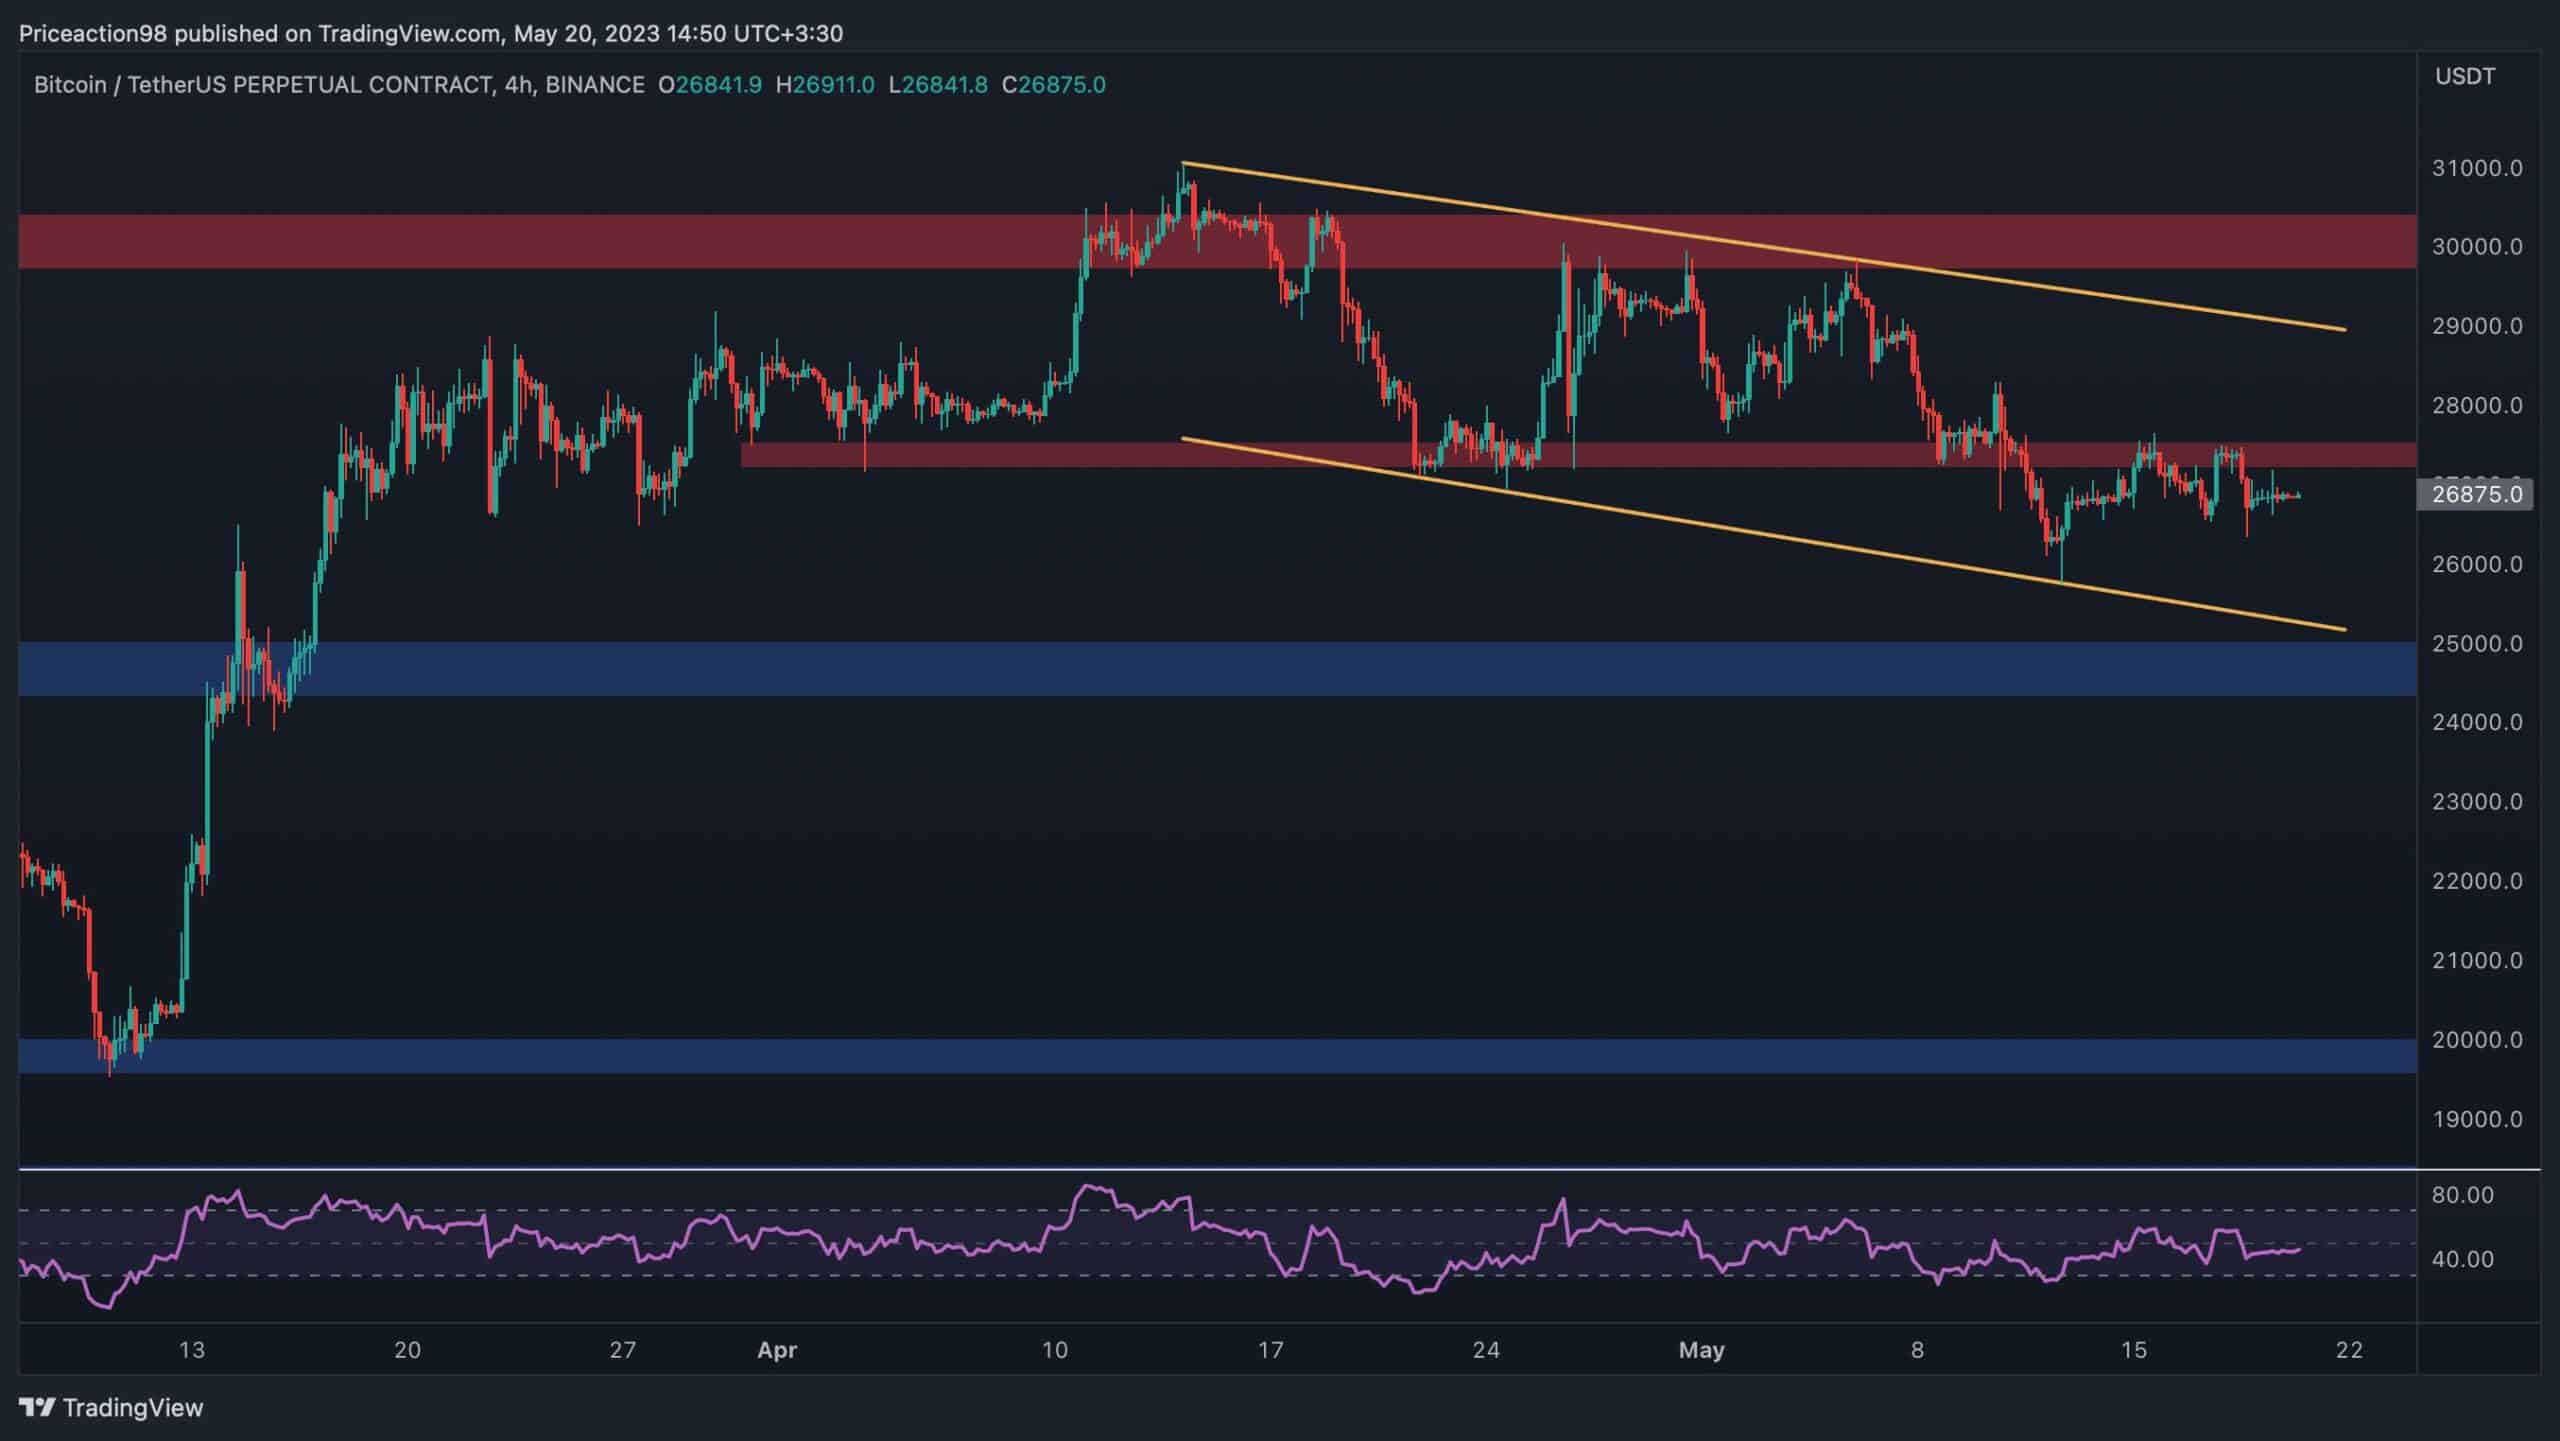
Looking at the 4-hour chart, the price has been struggling to break back above $27,500 over the last few days, following multiple attempts that resulted in a rejection.
As things stand, the lower boundary of the large flag pattern could be tested soon. On the other hand, if the price finally climbs above the $27,500 level, a rally towards the higher trendline of the pattern could be expected.
The RSI is offering little clue on this timeframe, as it has been running relatively flat, around the 50% mark.
On-chain Analysis
Bitcoin Miners Position Index
Bitcoin’s price has been recovering since the beginning of the year, following a gruesome bear market in 2022. The main question now is if the bear market is really over. Will there be more downtrends to come before the next cycle begins?
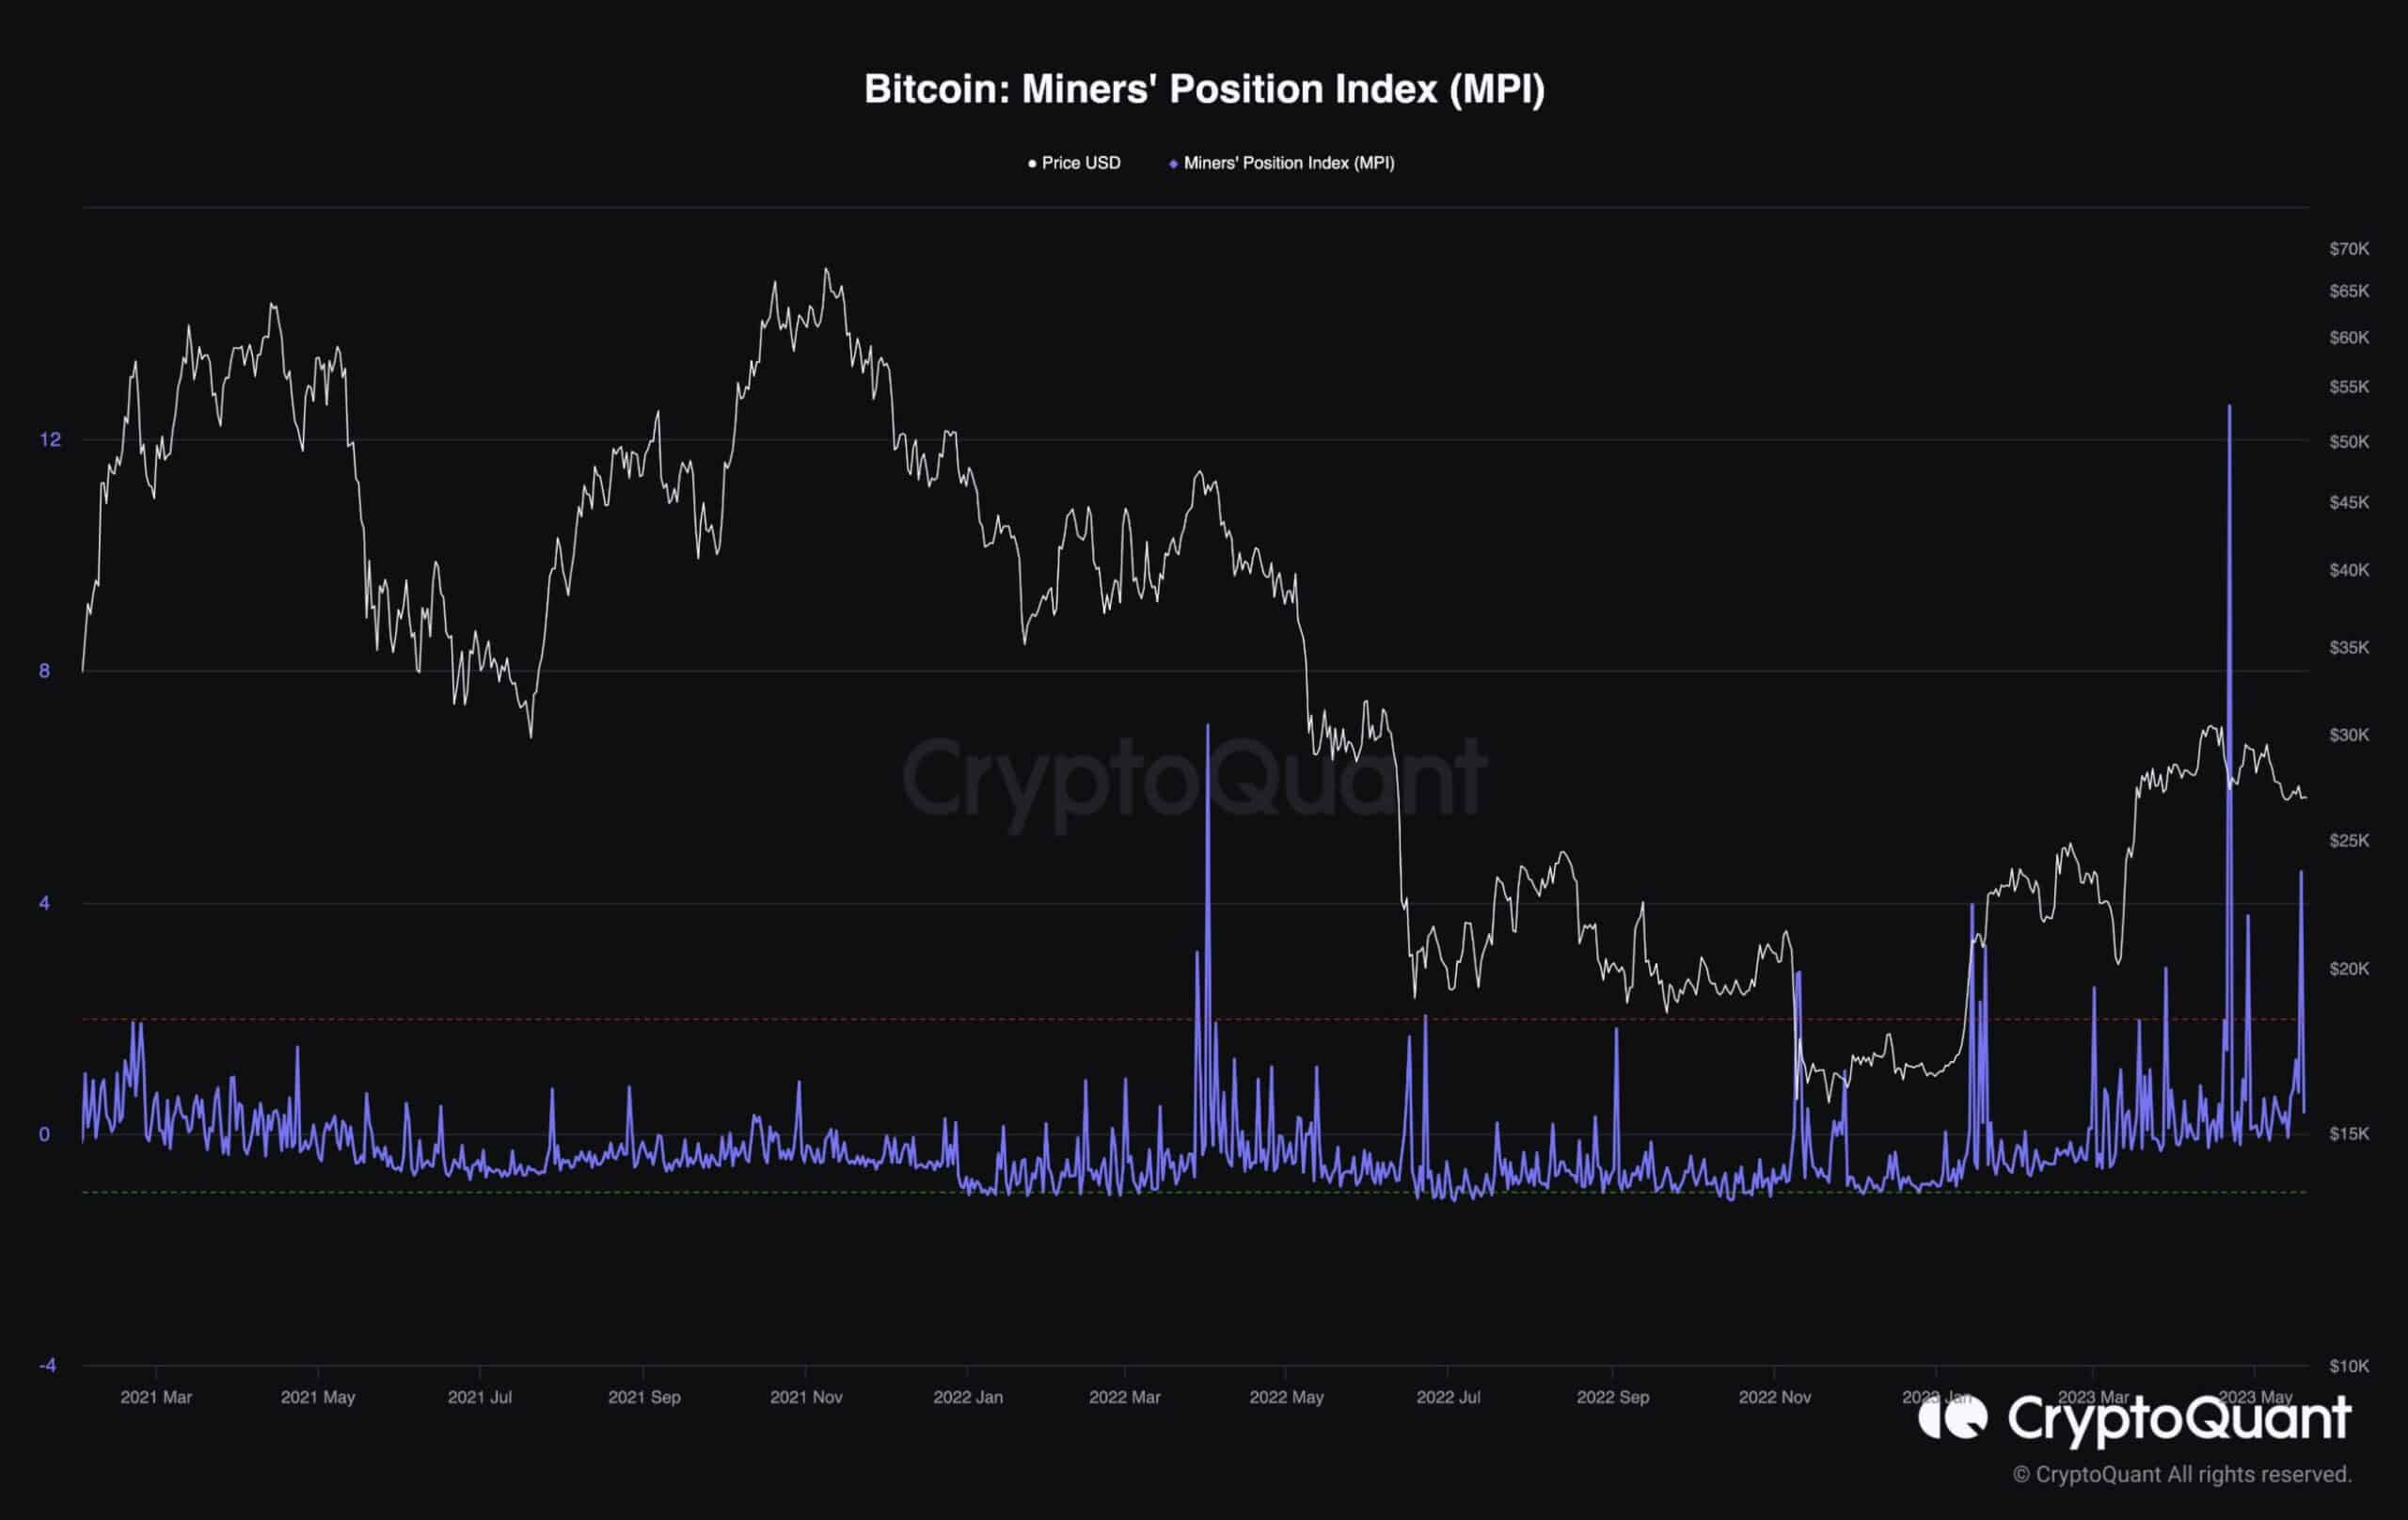
This chart demonstrates the miner’s position index, which is the ratio of total miner outflow to its one-year moving average of total miner outflow. High values are interpreted as miners selling their coins aggressively.
Looking at the chart, there have been multiple peaks in this metric, indicating that the miners are using the recent price rally to offload massive amounts of BTC, potentially to cover their costs.
This could point to their pessimism about the short-term future of BTC’s price and could also trigger a sell-off if things remain the same. Therefore, while the price has rebounded substantially over the past few months, investors should be wary as there are negative signals shown by some on-chain metrics.
The post BTC Tight Around $27K: Calm Before The Storm? (Bitcoin Price Analysis) appeared first on CryptoPotato.
OhNoRipple via https://www.ohnocrypto.com/ @CryptoVizArt, @Khareem Sudlow