Bitcoin Holds Above $28,500 Mark As More Buyers Emerge
Apr 20, 2023 at 07:00 //
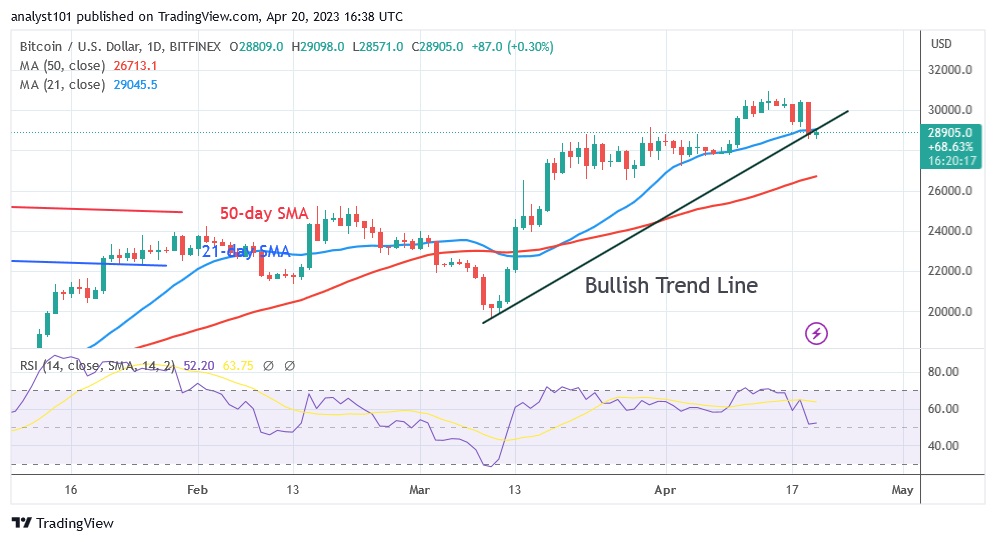
PriceBitcoin (BTC) price dropped considerably after falling below the 21-day line SMA, but then recovered. The inability of buyers to overcome the $31,035 resistance level and the subsequent rejection at the $30,500 high caused this decline.
Bitcoin price long-term forecast: bullish
Currently, the value of the largest cryptocurrency is at $28,880. The current slump has been halted as the BTC price is moving towards the oversold area of the market. However, once the BTC price drops below the 21-day line SMA, Bitcoin tends to fall below its low of $26,529 or rise above the 50-day line SMA. In other words, the Bitcoin price needs to cross the moving average lines to get out of the prohibited area. Considering the fact that Bitcoin is currently trading above the $28,000 support, the positive trend will continue when the BTC price starts to rise again.
Bitcoin indicator display
The Relative Strength Index for the 14 period indicates that Bitcoin has fallen to the 52 level. The value of the cryptocurrency is rising and can go much higher. Also, if the price bar is below the 21-day line SMA and between the moving average lines, this could indicate the beginning of another range bound pattern. Even though the cryptocurrency's value is currently above the daily stochastic threshold of 25, it has fallen into the oversold area of the market that will attract buyers.

Technical indicators:
Key resistance levels - $30,000 and $35,000
Key support levels - $20,000 and $15,000
What is the next direction for BTC/USD?
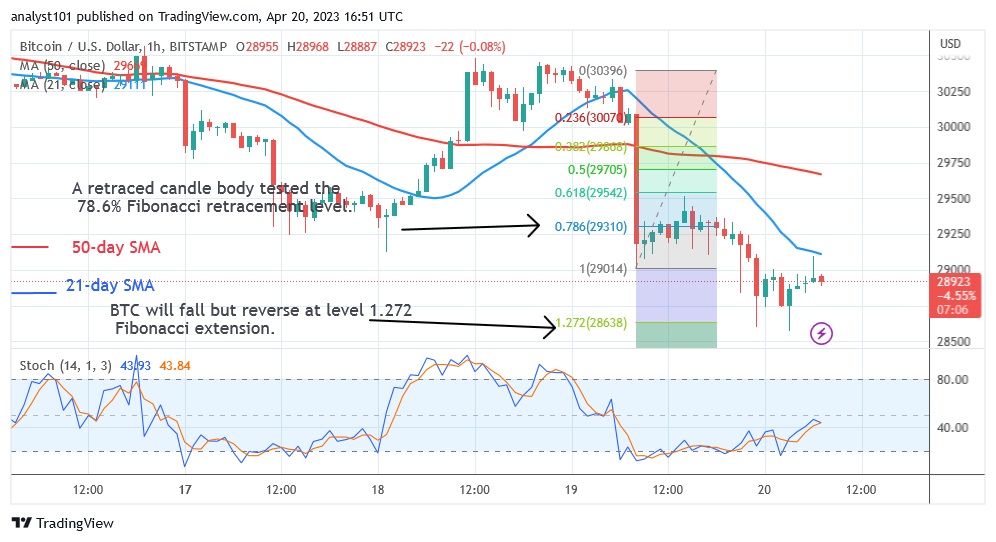
The value of the largest cryptocurrency has fallen to a low of $28,582 so far today. The current selling pressure has eased as the BTC price hovers above the $28,500 support. The positive trend will continue if the BTC price exceeds the high of $29,750. The price indicator forecasts a decline in the BTC price before a trend reversal occurs at the level of the 1.272 Fibonacci extension or the low of $28.638.

Disclaimer. This analysis and forecast are the personal opinions of the author and are not a recommendation to buy or sell cryptocurrency and should not be viewed as an endorsement by CoinIdol. Readers should do their research before investing in funds.
OhNoCryptocurrency via https://www.ohnocrypto.com/ @coinidol.com By Coin Idol, @Khareem Sudlow
