
ETH Trading Inside a Tight Range, Breakout Imminent? (Ethereum Price Analysis)
The cryptocurrency markets are experiencing a period of stagnation. Meanwhile, ETH has been trading inside a tight range for the last seven days.
Technical Analysis
By Grizzly
The Daily Chart
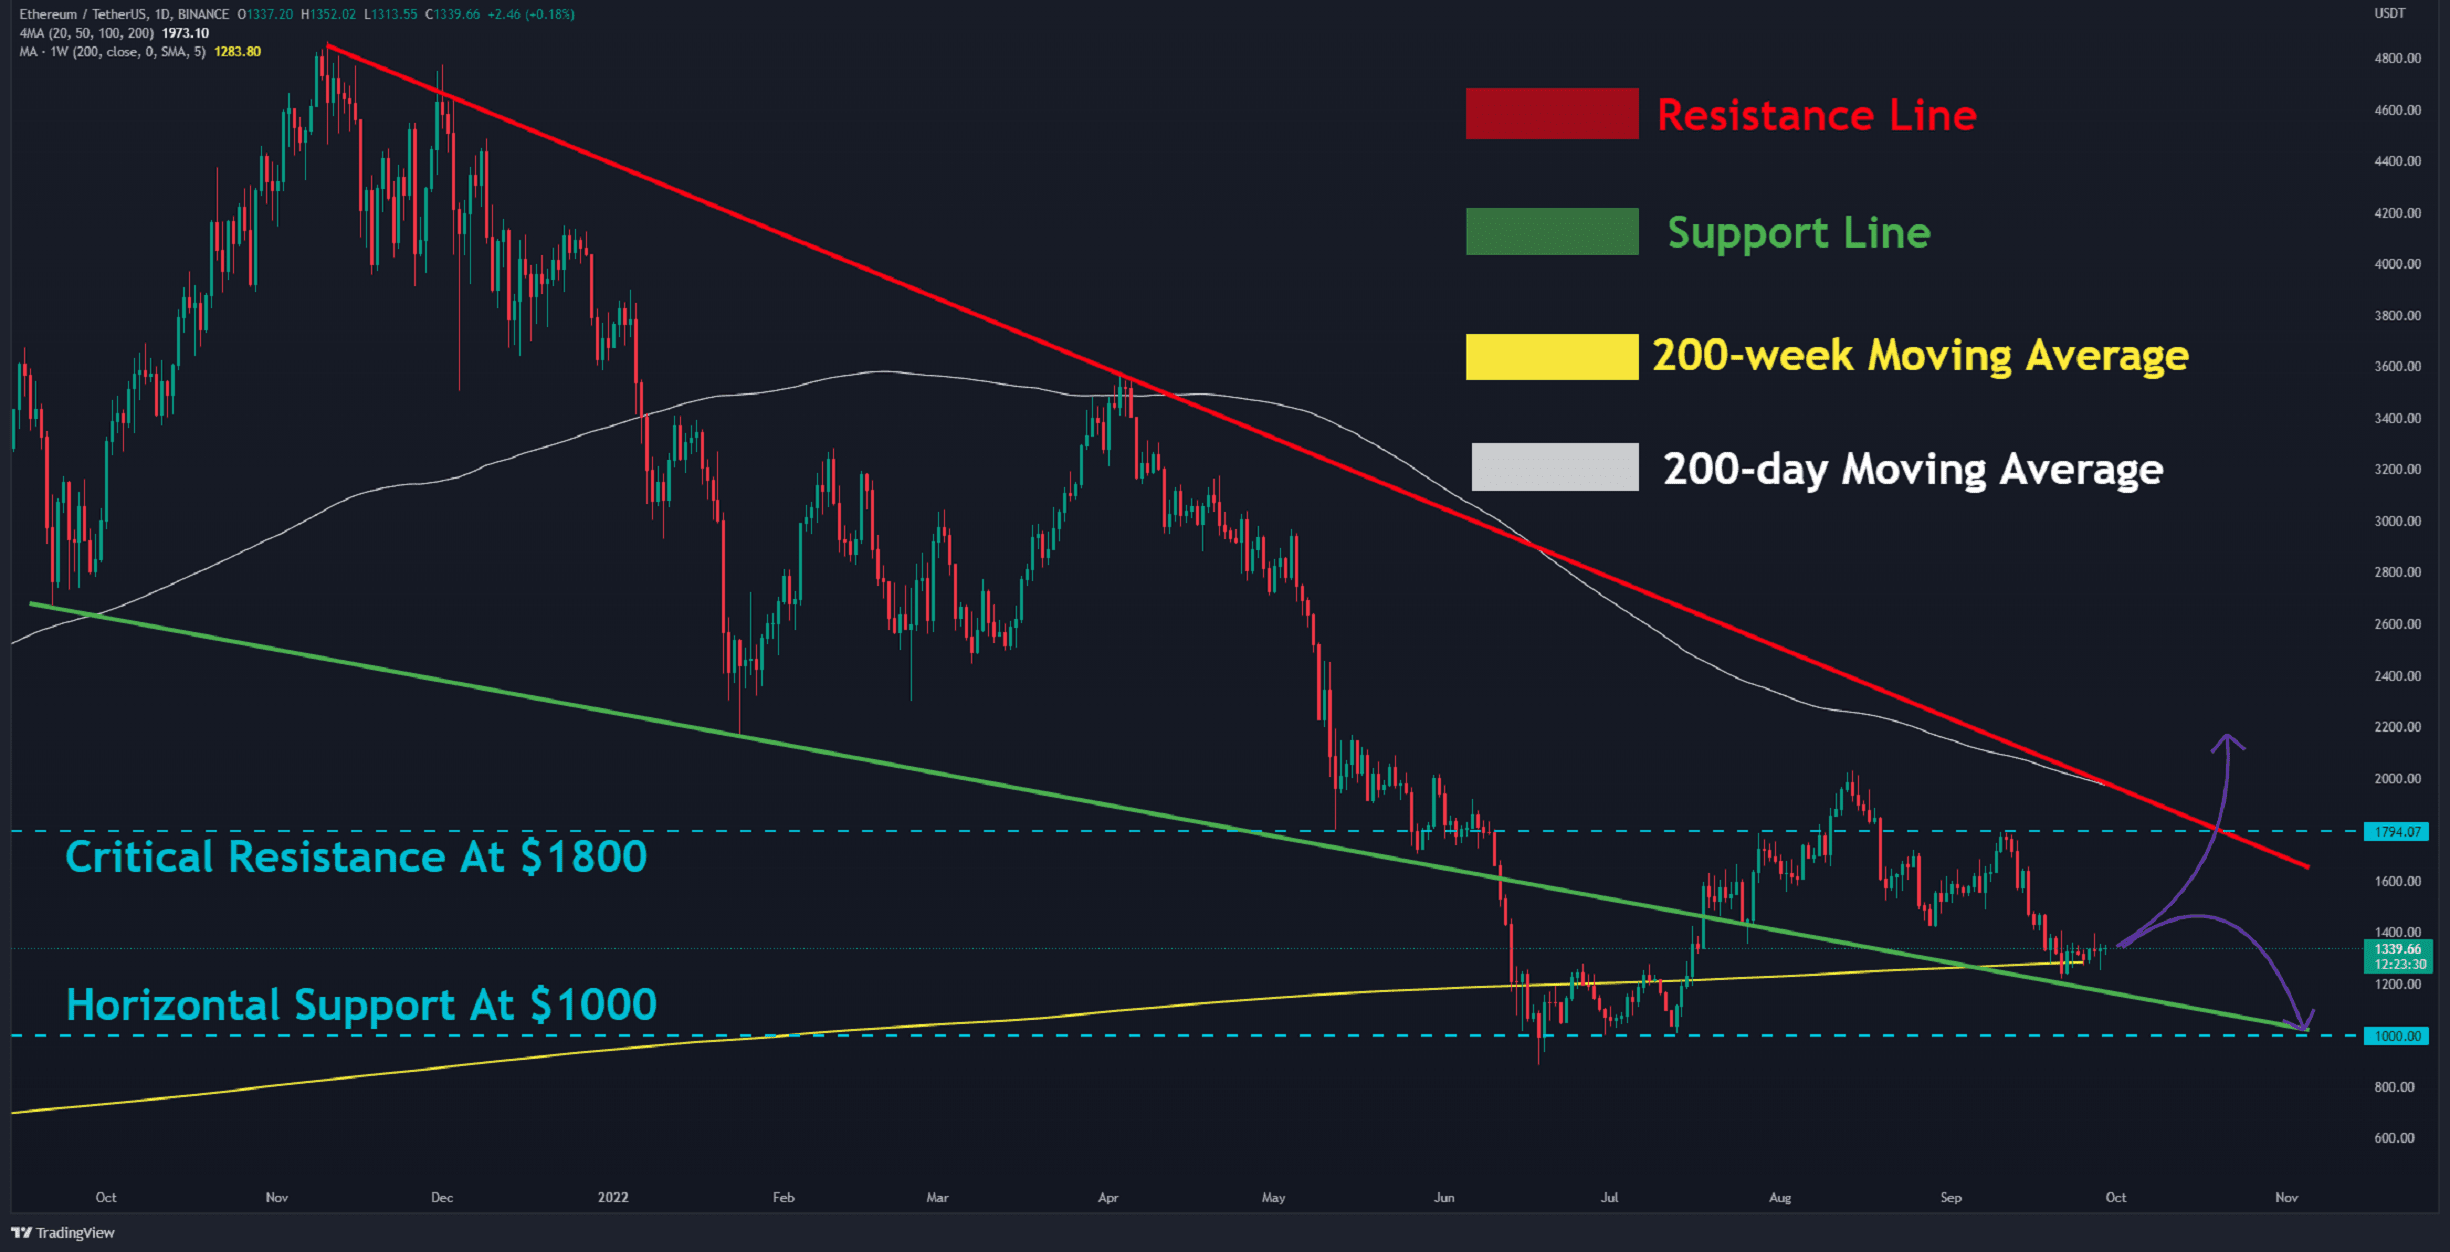
On the daily chart, we can see two descending lines since ETH had reached its all-time high, and right now, ETH is retesting the lower line (green), along with the 200-week moving average (in yellow).
From the bearish side, if the green support line doesn’t hold and the selling pressure increases, ETH is expected to break below the 200-week MA line and probably revisit the $1,000 area, where the horizontal support and descending support line intersect.
On the other hand, if ETH breaks above $1,550, it could aim for a retest of the last local high of around $1,800 – which is tangent to the 200-day moving average (in white). Such a move will probably trigger the end of the current bear market.
In the short term, a breach of either $1,280 or $1,550 may set the next direction for ETH.
Key Support Levels: $1280 & $1000
Key Resistance Levels: $1550 & $1800
Daily Moving Averages:
MA20: $1435
MA50: $1577
MA100: $1483
MA200: $1972
The ETH/BTC Chart
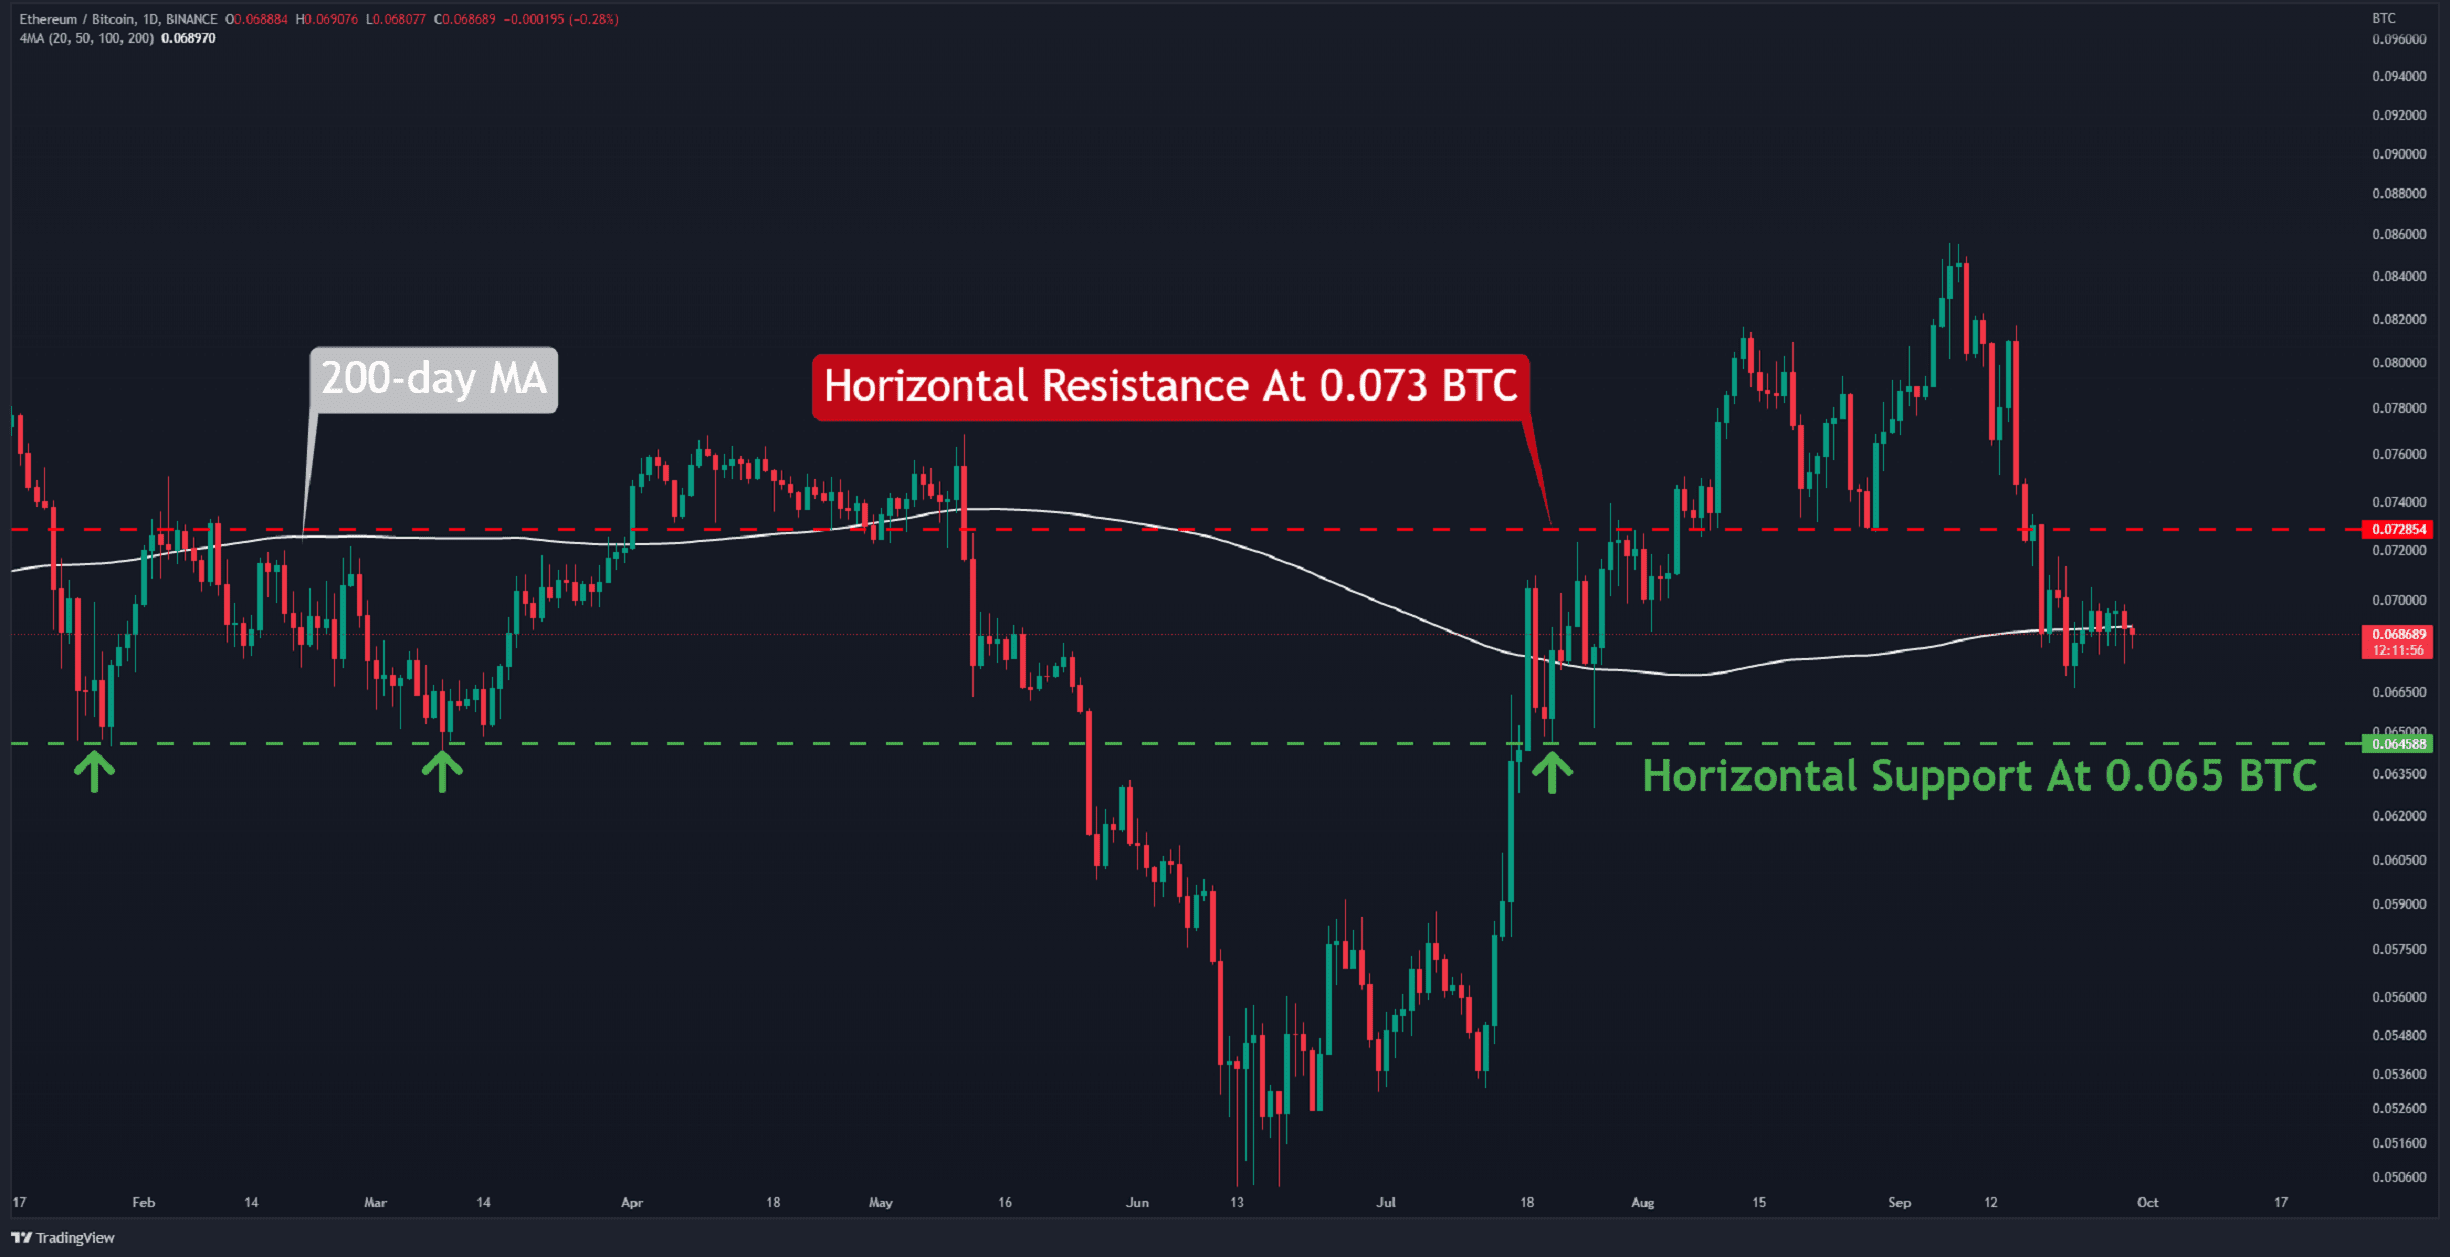
Against BTC, a serious effort is being made to reclaim the 200-day moving average line (in white). Although the pair made it for a short while, currently, it is back below it.
The candlestick structure indicates that the selling pressure continues in the market. This could cause the price to dip towards the horizontal support level of 0.065 BTC (in green).
Furthermore, a positive outlook cannot be obtained until the pair recovers above the horizontal resistance at 0.073 BTC (in red).
Key Support Levels: 0.067 & 0.065 BTC
Key Resistance Levels: 0.073 & 0.08 BTC
On-chain Analysis
Funding Rates
Definition: Periodic payments made to short and long traders based on the difference between perpetual contract markets/spot prices.
Funding rates represent traders’ sentiment on the perpetual swaps market, and the amount is proportional to the number of contracts.
Positive funding rates indicate that long position traders are dominant and are willing to pay funding to short traders.
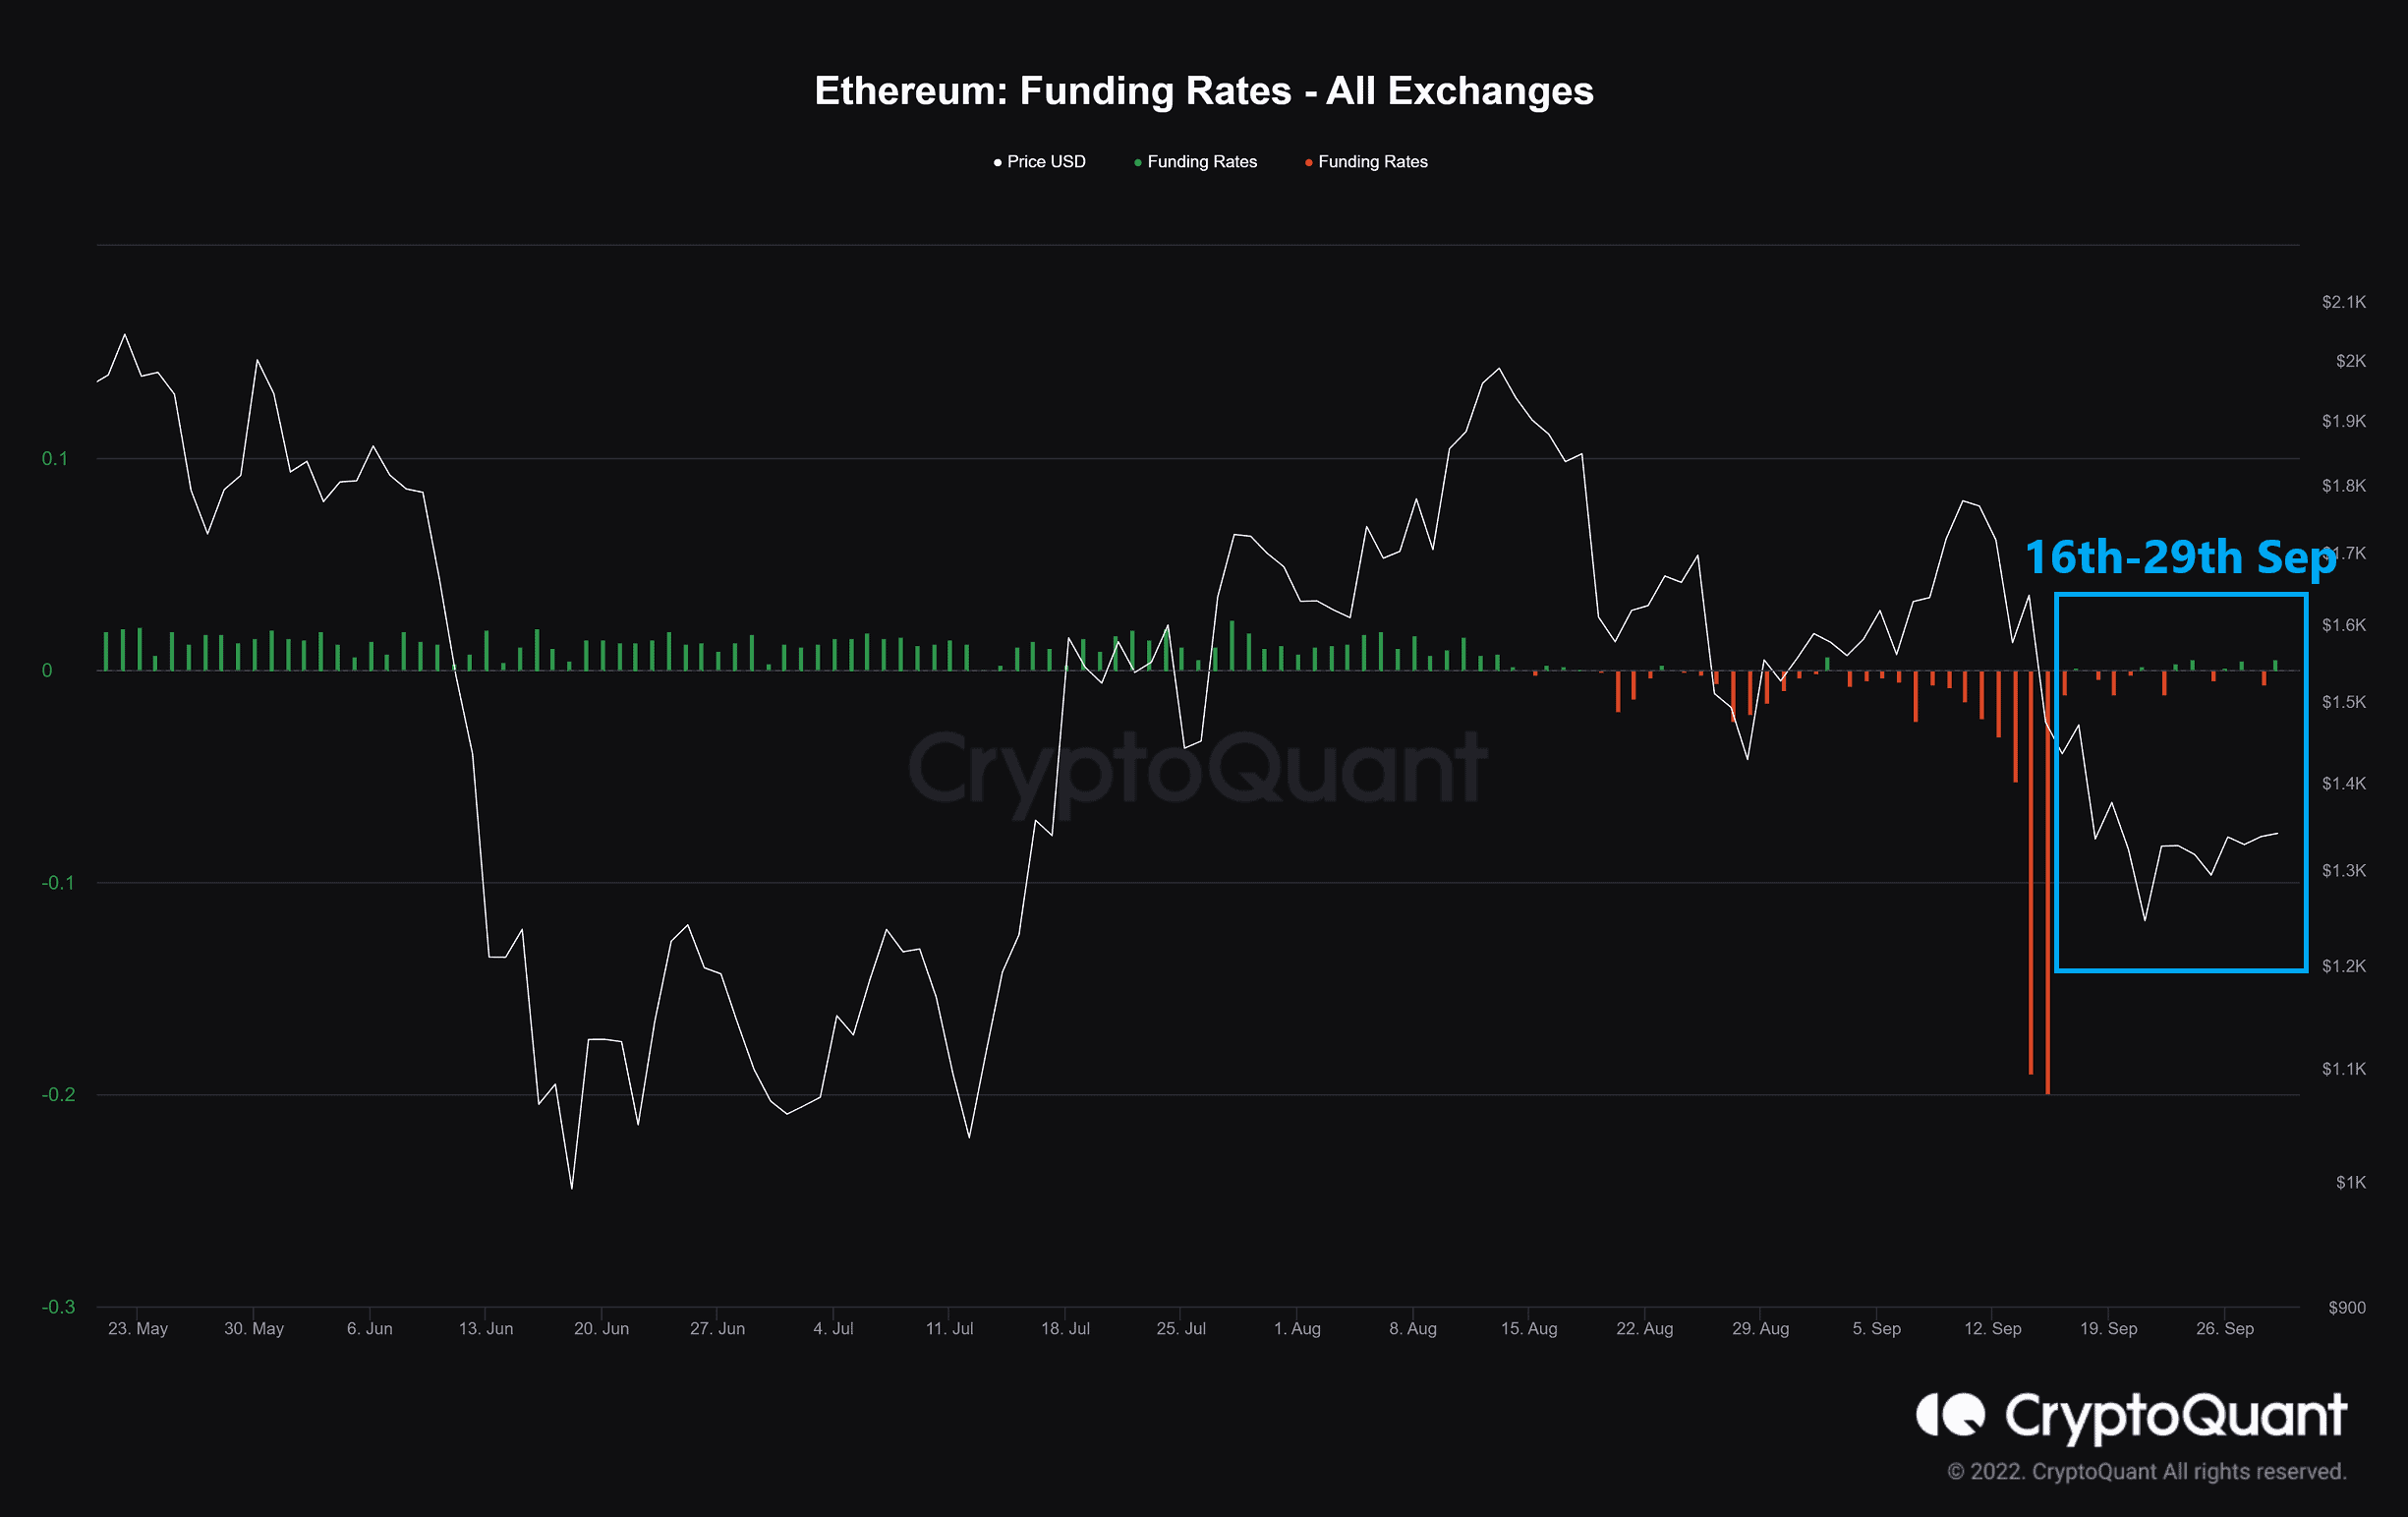
According to on-chain data by CryptoQuant, the sentiment in the derivatives market remains neutral, as the funding rate has not changed considerably since September 16. As a result, the market may form a sideways trend. Overall, on-chain data reveals a lack of investor activities on the network.
The post ETH Trading Inside a Tight Range, Breakout Imminent? (Ethereum Price Analysis) appeared first on CryptoPotato.
OhNoRipple via https://www.ohnocrypto.com/ @CryptoVizArt, @Khareem Sudlow