
ETH at Highest Levels Against BTC Since December 2021, What’s Next? (Ethereum Price Analysis)
Ethereum has resumed its upward trajectory in recent days. This happened after the bears failed to push the price below the support level of $1,420. The positivity is also highlighted by the fact that Ethereum is trading at its highest price against Bitcoin since December 2021.
Technical Analysis
By Grizzly
The Daily Chart
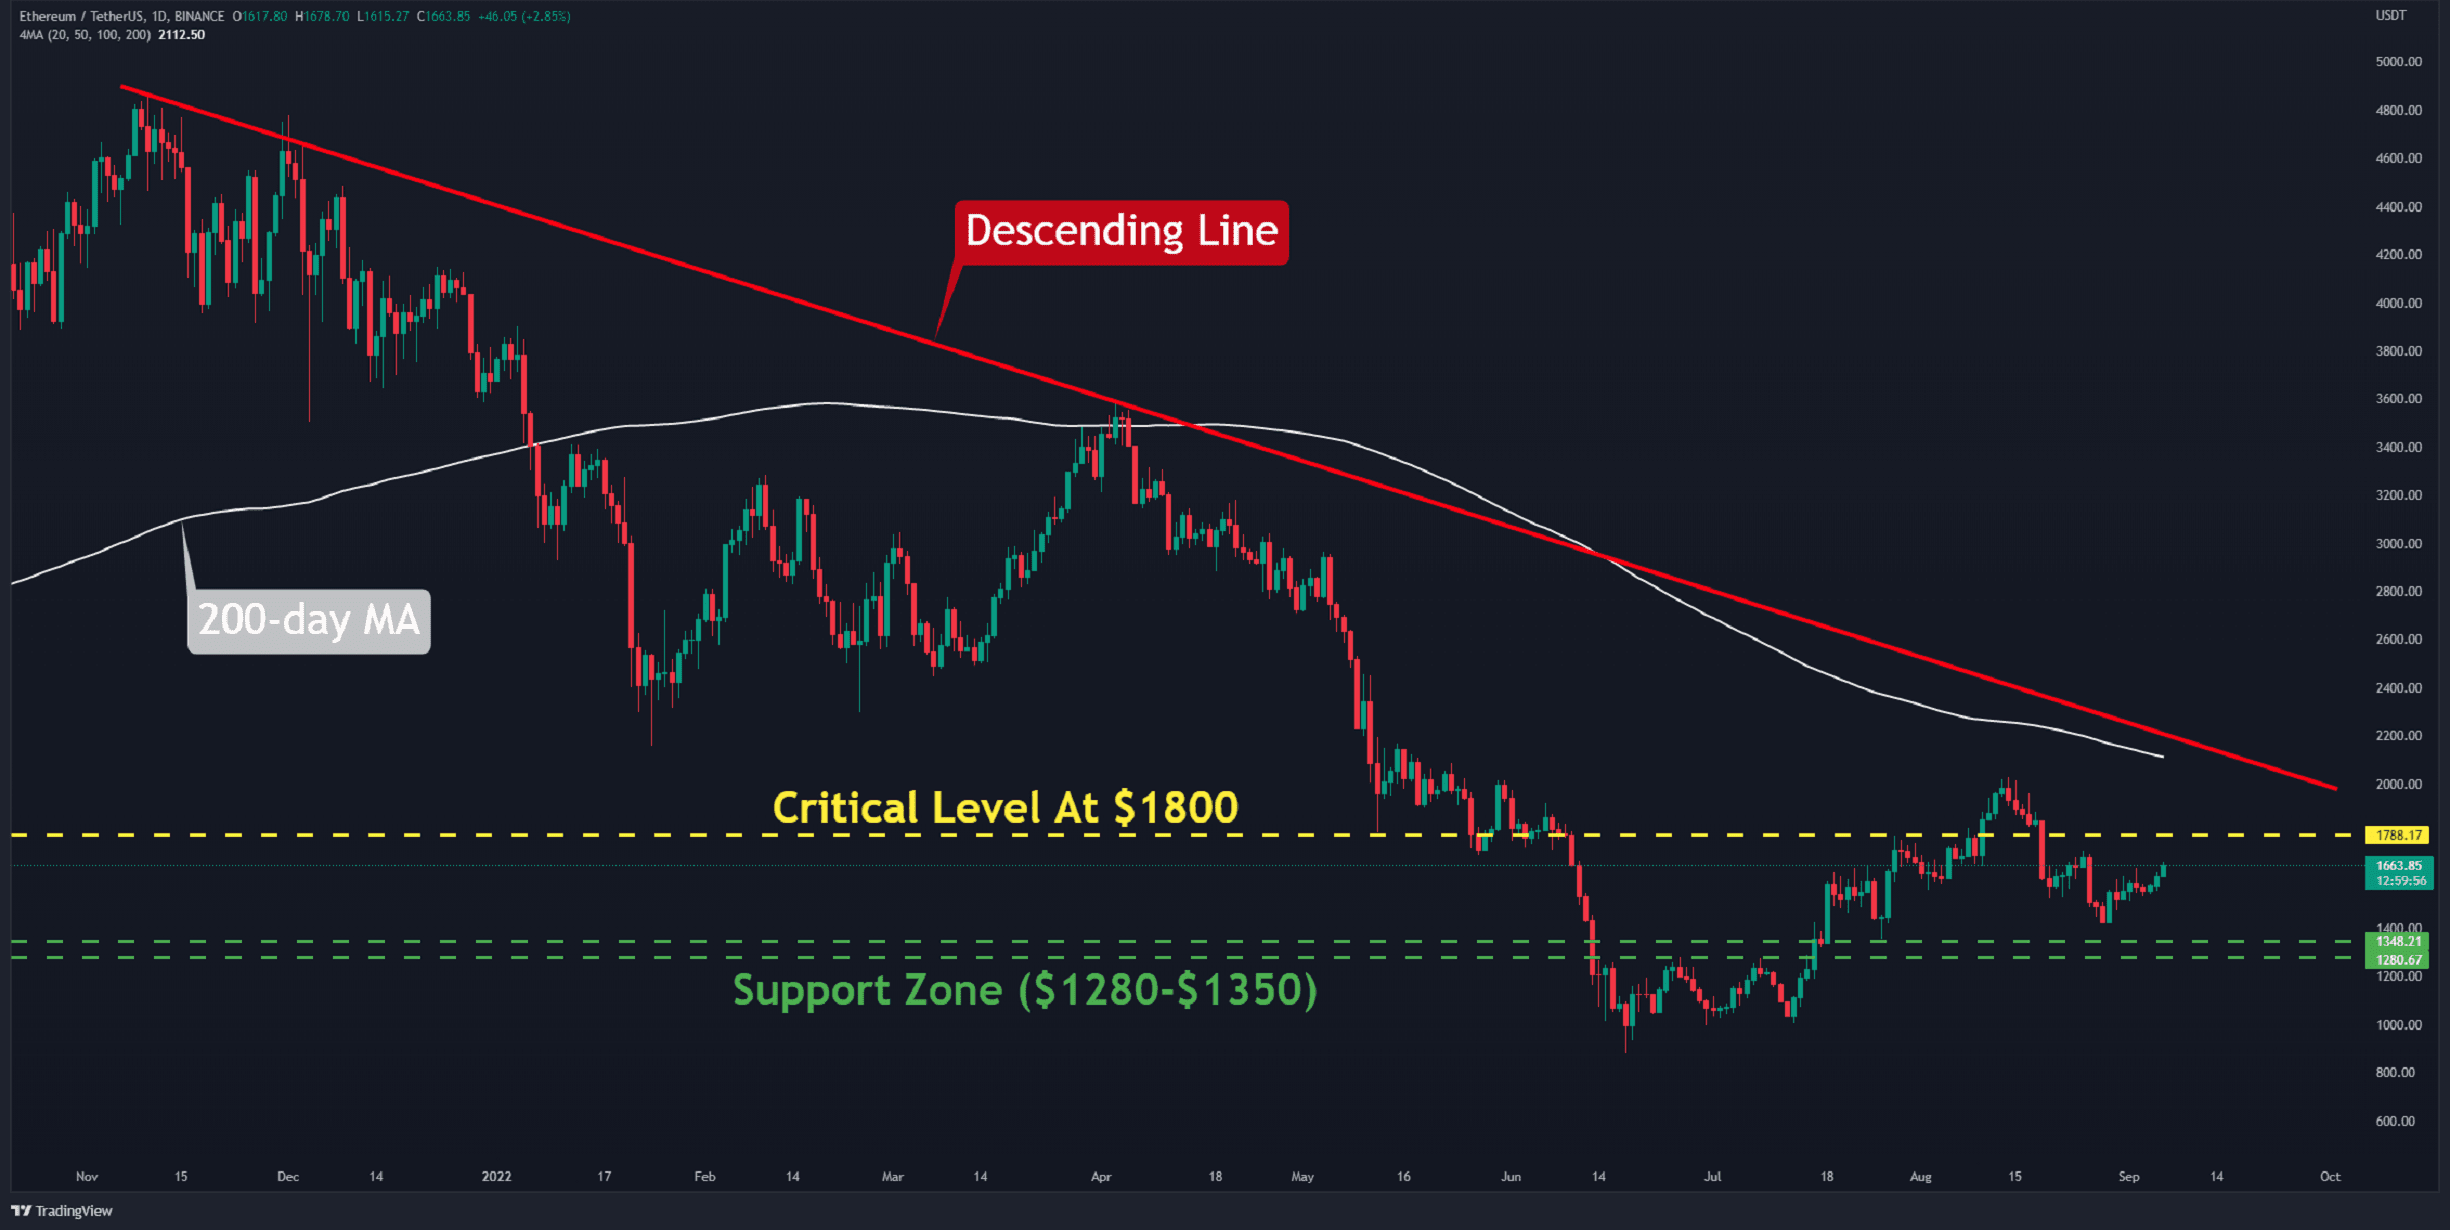
At the end of August, the bears managed to retrace the July gains and pushed the price towards the 61.8% Fib level, which lies at $1,420. The important resistance to now consider lies at $1,800. Interestingly, the price attempted to push the price above it in early August, but it eventually fell below.
Ethereum has not touched its 200-day moving average line (in white), which is at $2112, since April. This MA is closely associated with the resistance of the descending line (in red). If the price manages to push past $1,800 before the Merge, it would become more probable for the 200-day MA to be tested again.
Alternatively, if the price falls, support will be found in the range of $1280-$1350. Breaking below these levels could also catalyze a prolonged drawdown.
Key Support Levels: $1420 & $1300
Key Resistance Levels: $1800 & $2100
Daily Moving Averages:
MA20: $1596
MA50: $1658
MA100: $1497
MA200: $2112
The ETH/BTC Chart
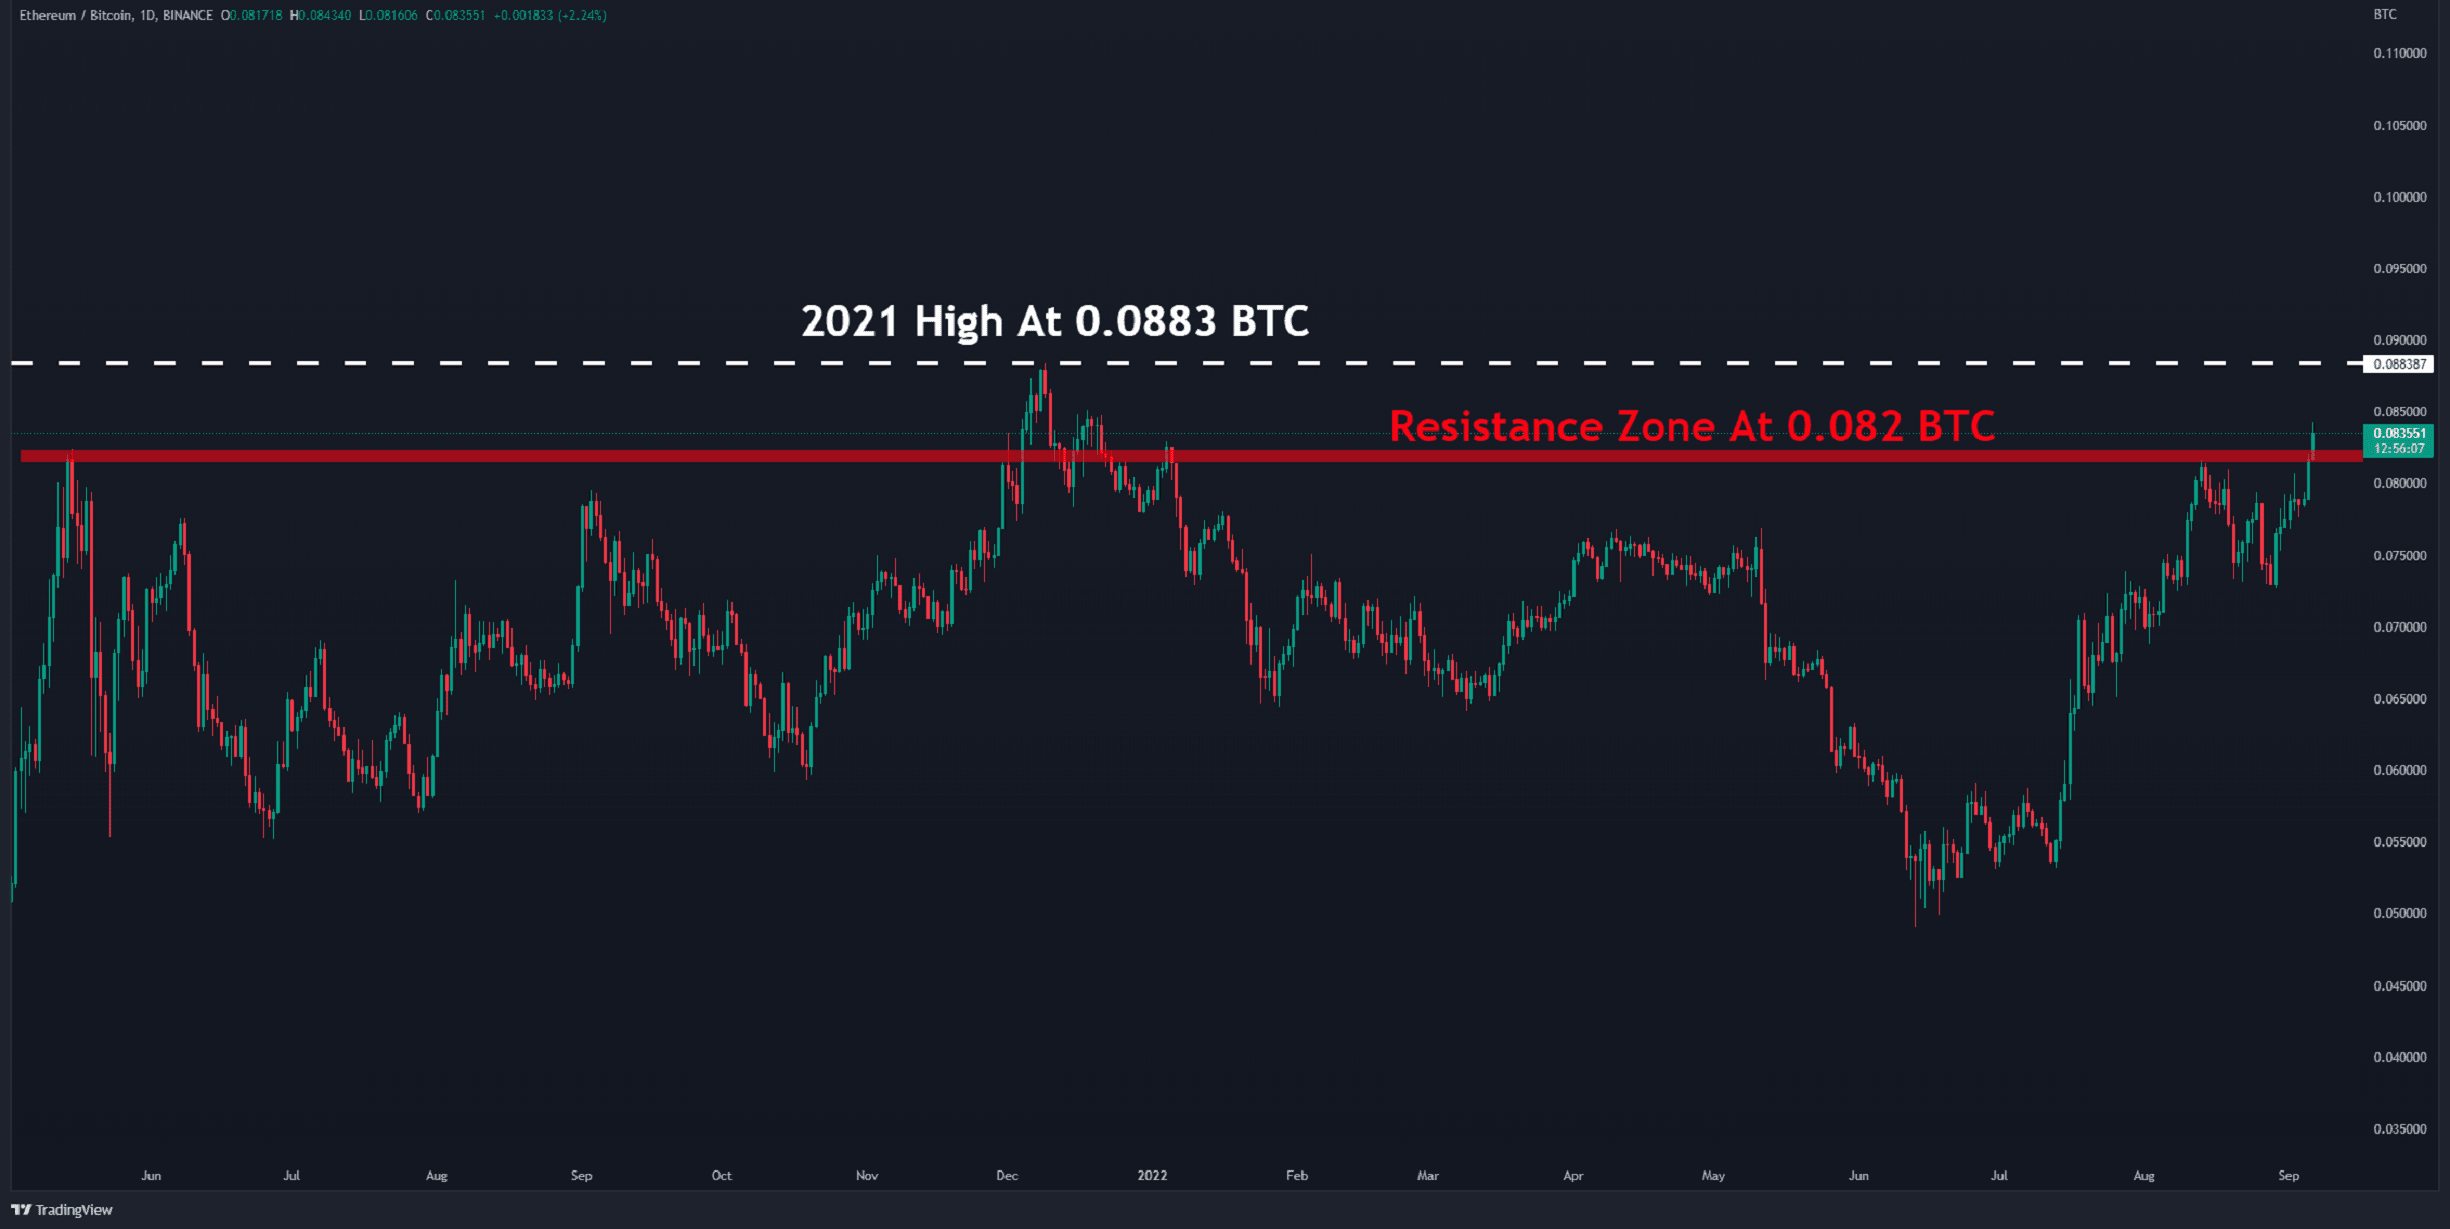
At the time of this writing, buyers are dominating the market, and they are attempting to close the price above 0.082 BTC (in red) on the daily chart. The last time ETH was trading this high against BTC was in December 2021.
The next resistance level is at 0.0883 BTC (in white), which was reached on December 9, 2021. Assuming the bulls can bring the price up by 6%, Ethereum will have increased to its highest level since 2018.
Ahead of the Merge event, this may represent a significant achievement for Ethereum.
Key Support Levels: 0.0.0.082 & 0.073 BTC
Key Resistance Levels: 0.088 & 0.093 BTC
Sentiment Analysis
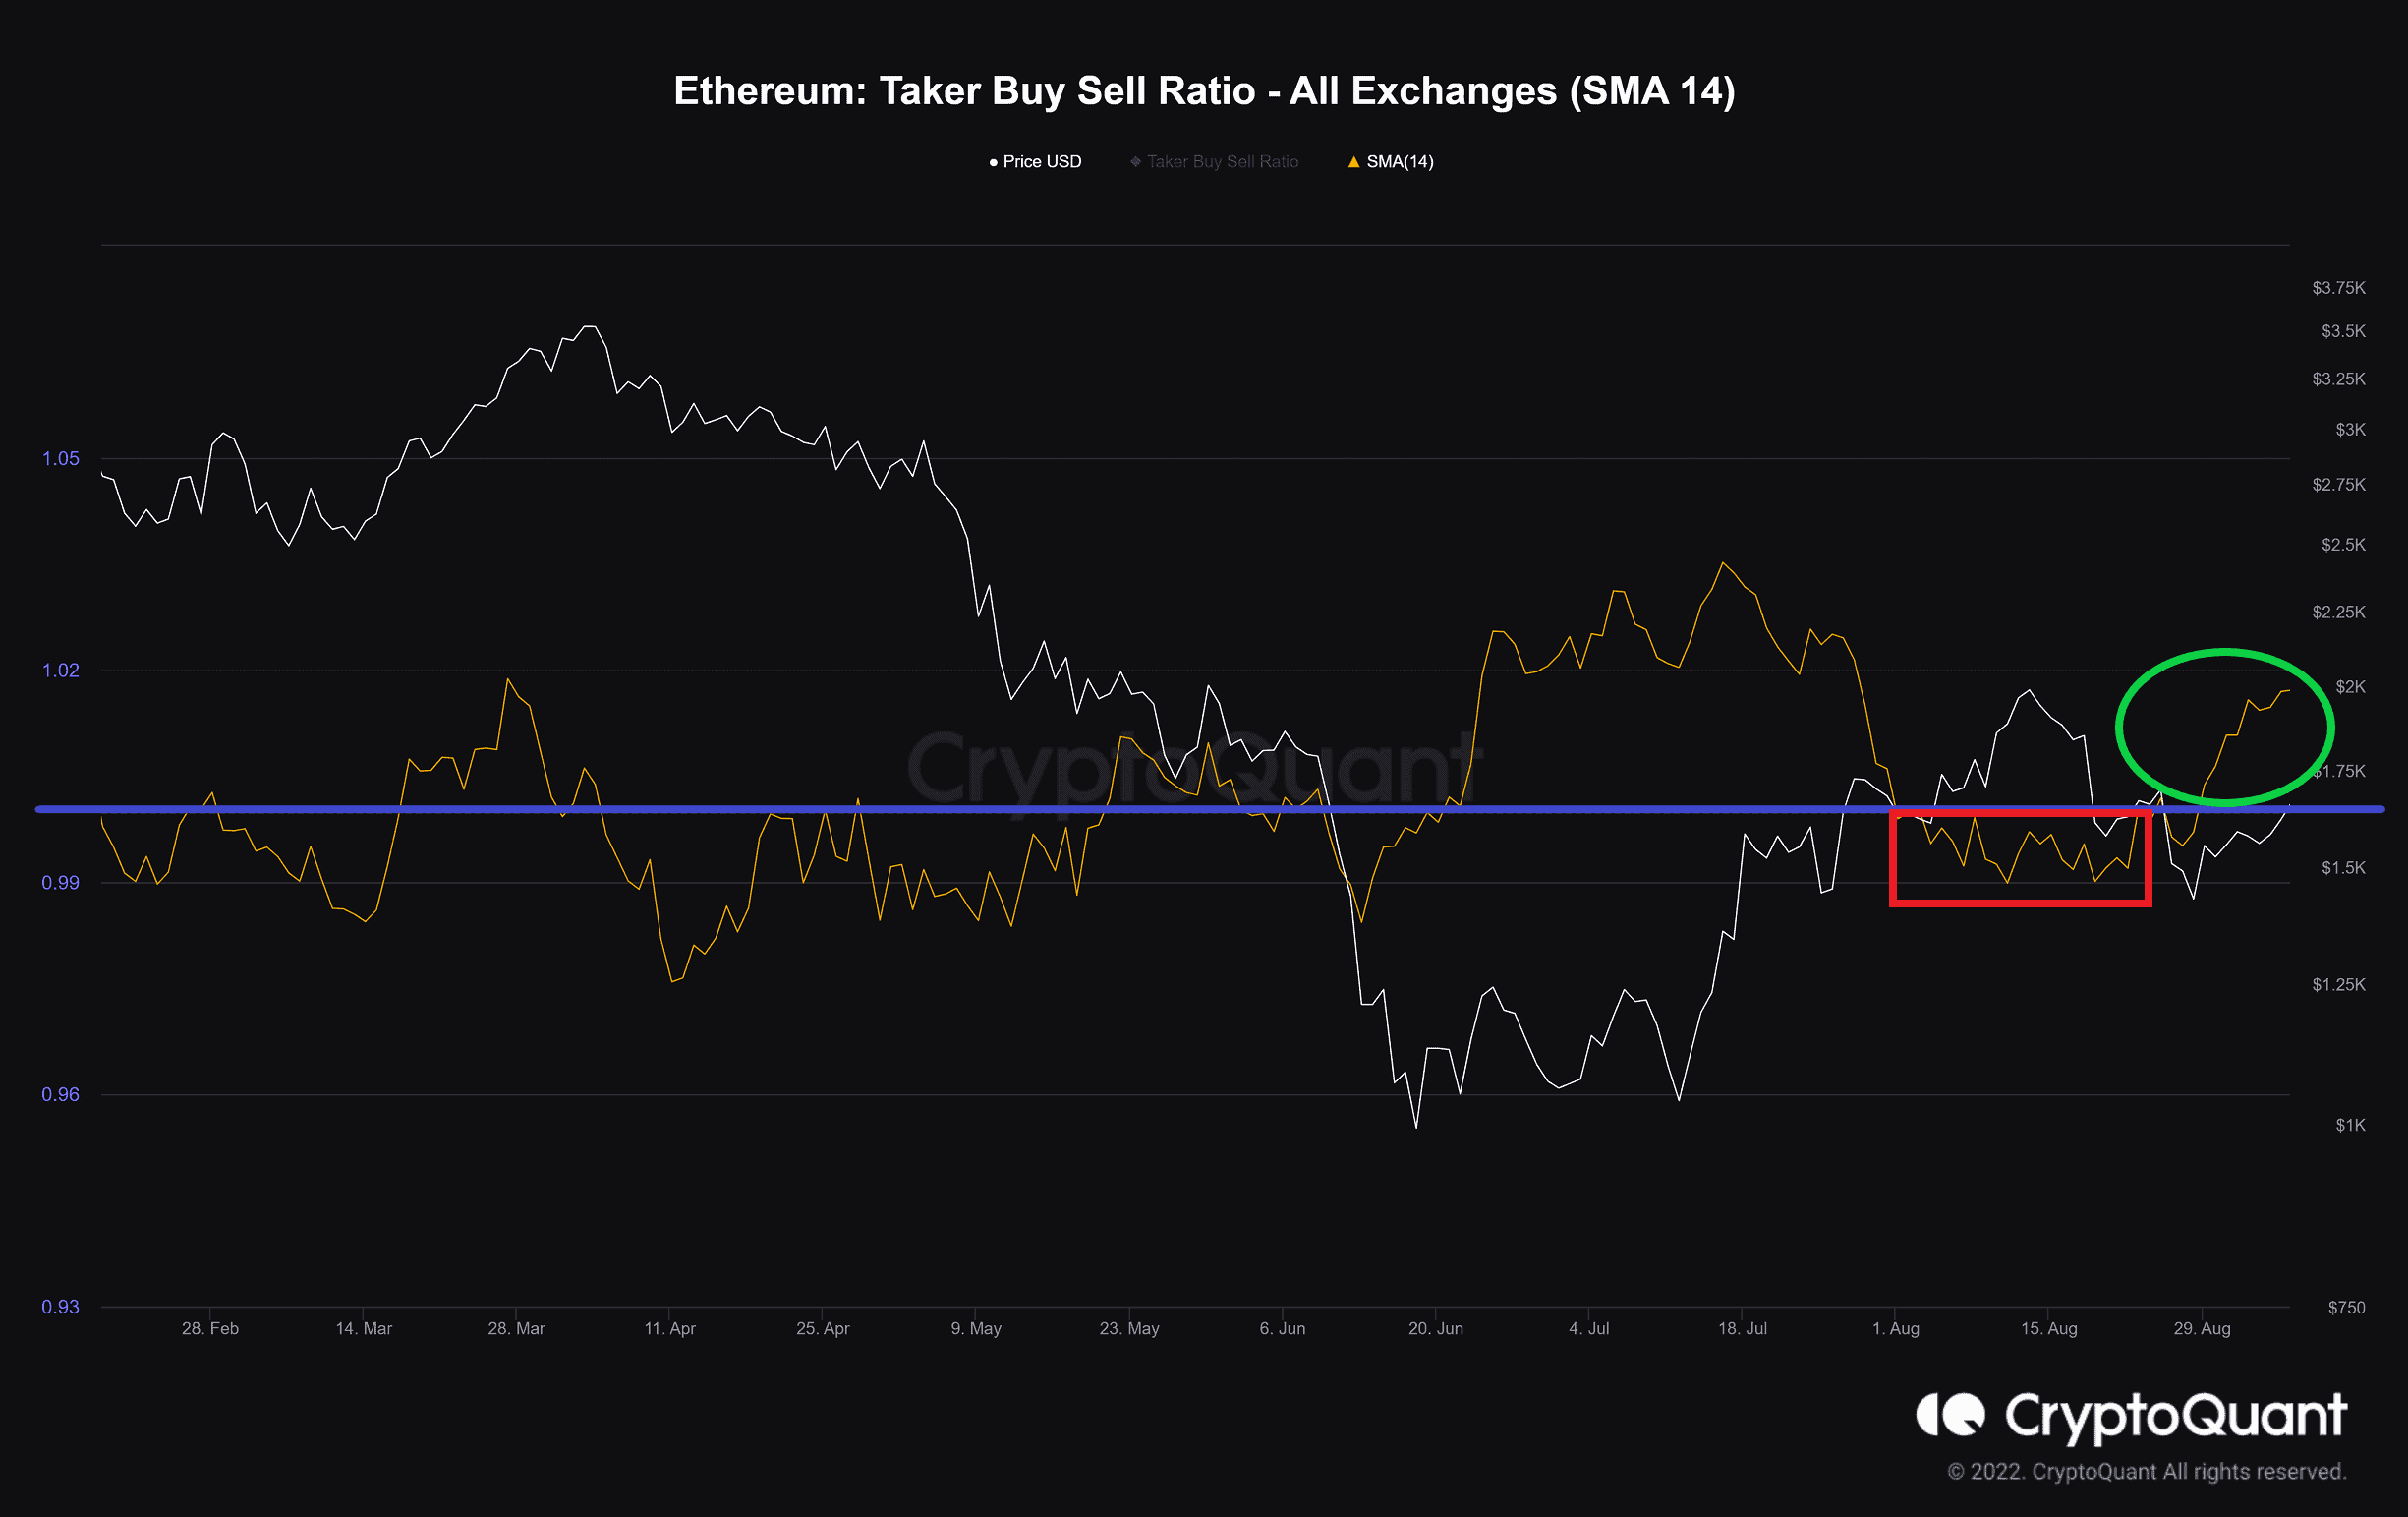
Taker Buy Sell Ratio (SMA 14)
Definition: The ratio of buying volume divided by the selling volume of takers in perpetual swap trades.
Values over 1 indicate the bullish sentiment is dominant.
Values under 1 indicate the bearish sentiment is dominant.
Positive sentiment prevails in the derivatives market. Takers now tend to fill more buy orders. Because of this, the current metric is higher than 1. The upward trend of July was followed by the momentum of this index growing above 1.
At the moment, Ethereum is the undisputed market leader.
The post ETH at Highest Levels Against BTC Since December 2021, What’s Next? (Ethereum Price Analysis) appeared first on CryptoPotato.
OhNoRipple via https://www.ohnocrypto.com/ @CryptoVizArt, @Khareem Sudlow