
Two Probable Scenarios for XRP as Price Approaches $0.3 (Ripple Price Analysis)
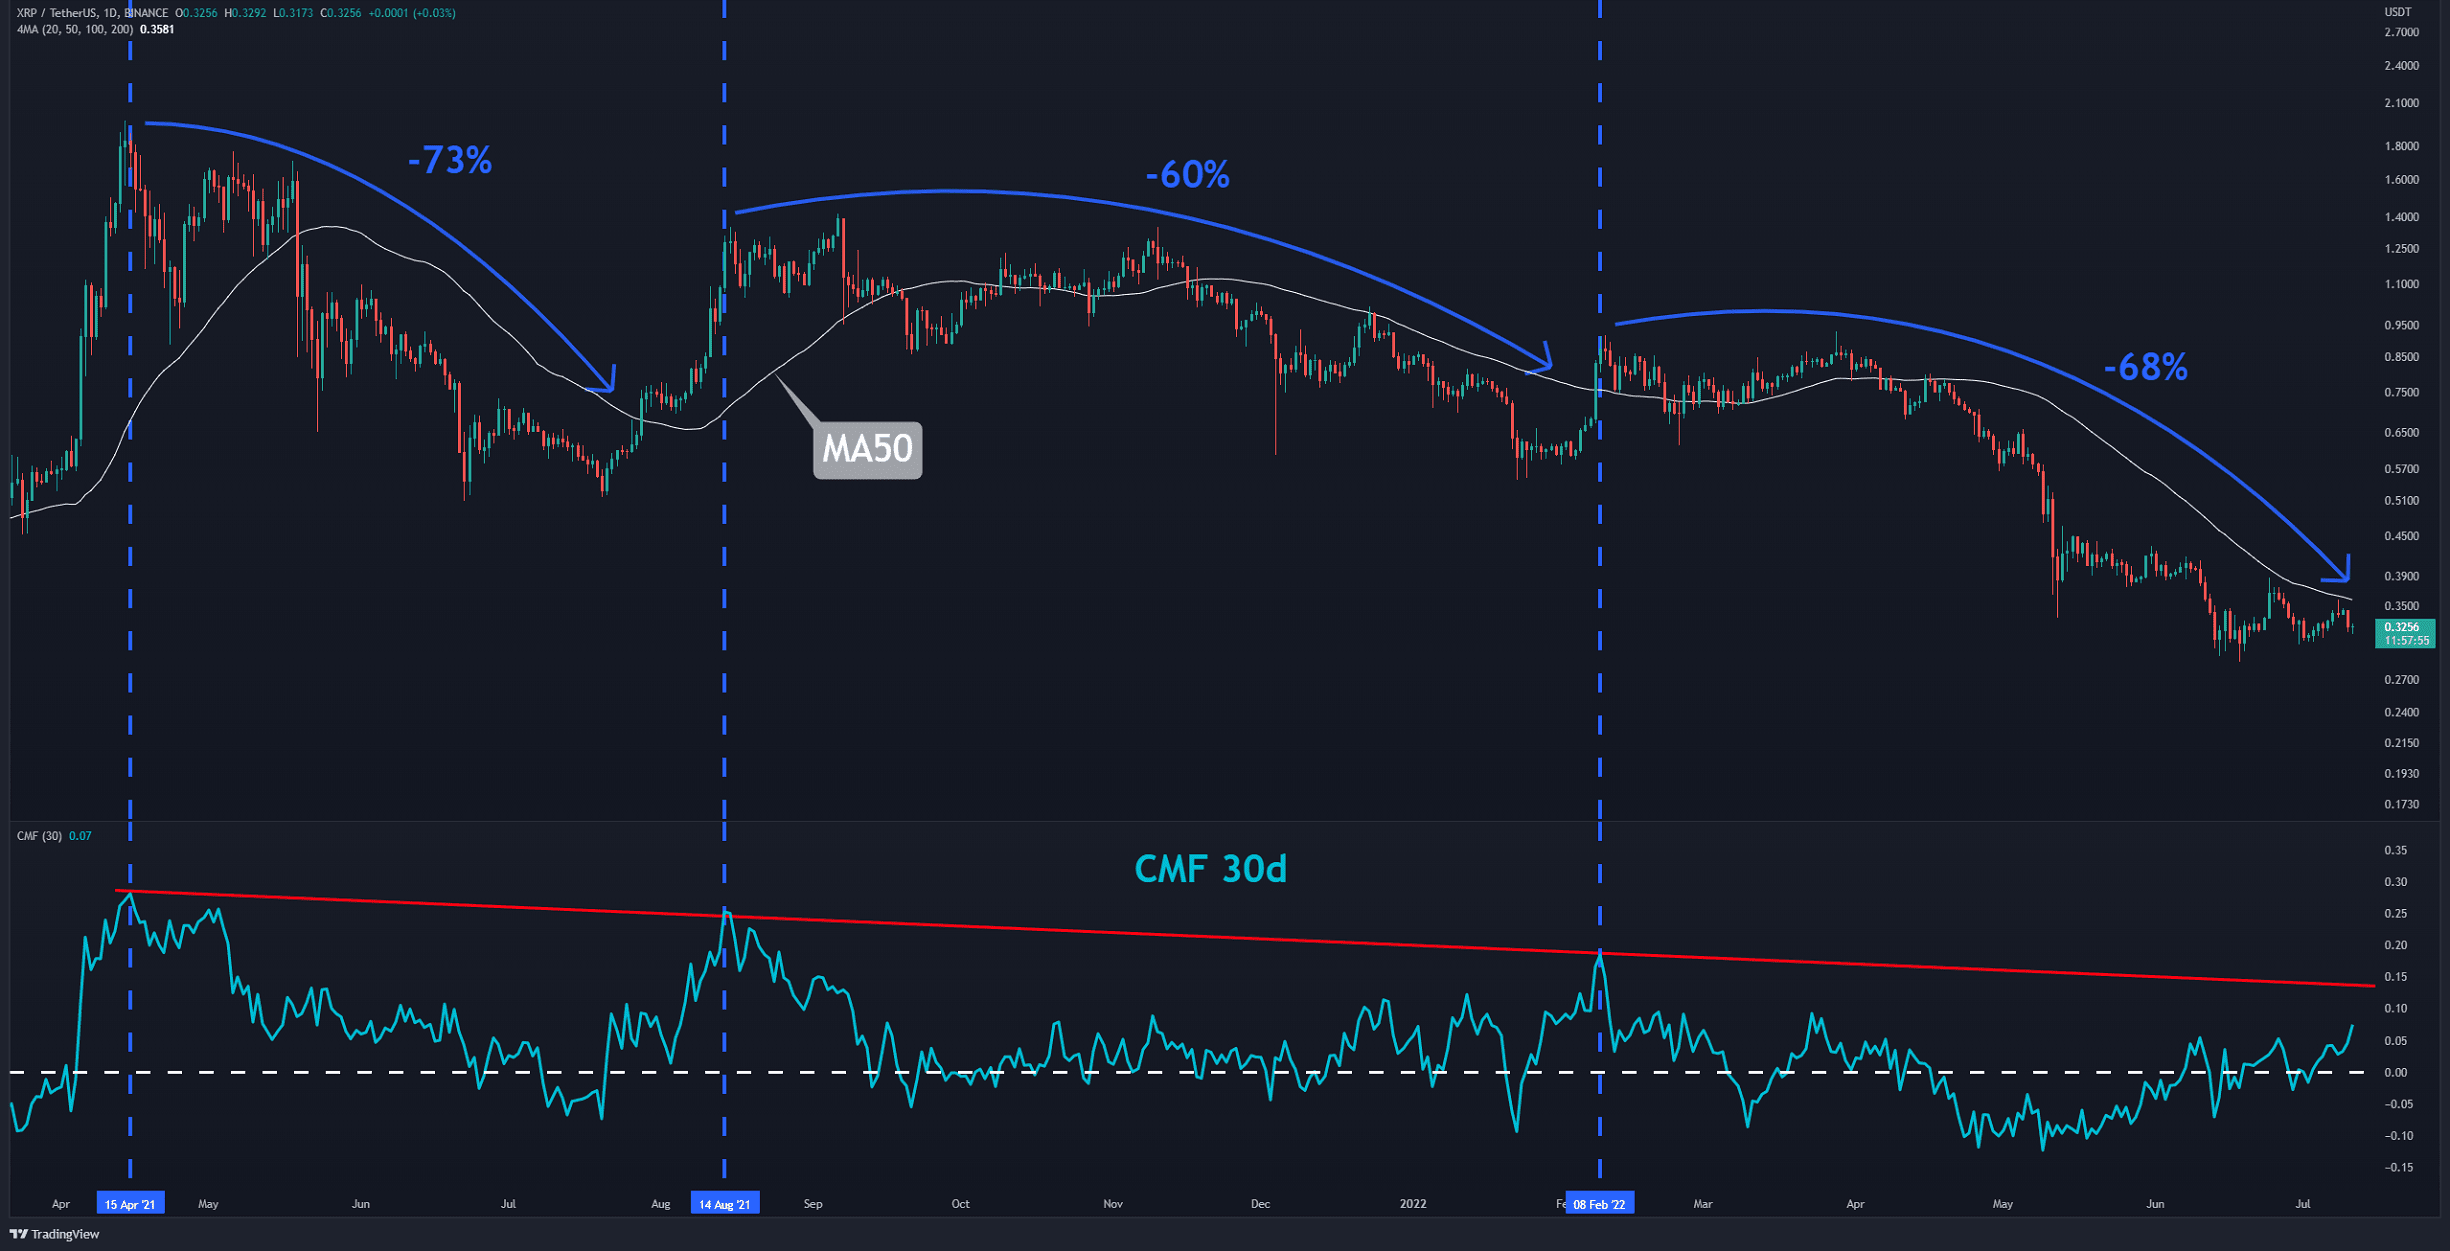
Through the recent market rally, buyers have managed to reclaim the 50-day moving average for the second time. Moreover, the price formed a higher low above $0.28, but it could not even touch the last high at $0.39. It seems that the bears are fighting back.
Technical Analysis
By Grizzly
The Daily Chart
After breaking the baseline, the CMF 30D is approaching the descending line (in red) that has prevented further increase since April 2021. Chaikin Money Flow (CMF) is a volume-weighted average of accumulation and distribution over a specified period. Whenever this indicator hits the red resistance, XRP seems to experience a deep correction (in blue).
There are two scenarios:
1 – Bulls pushing the price above $0.4. After reaching higher levels, this indicator will also move closer to the descending line. In this case, according to the historical data, the price might pull back.
2 – Bears dominate the market, and CMF changes its direction towards the baseline – then, by forming a bottom below $0.28, the market may undergo a sell-off again.
Key Support Levels: $0.28 & $0.24
Key Resistance Levels: $0.40 & $0.51
Moving Averages:
MA20: $0.33
MA50: $0.36
MA100: $0.49
MA200: $0.63
The XRP/BTC Chart
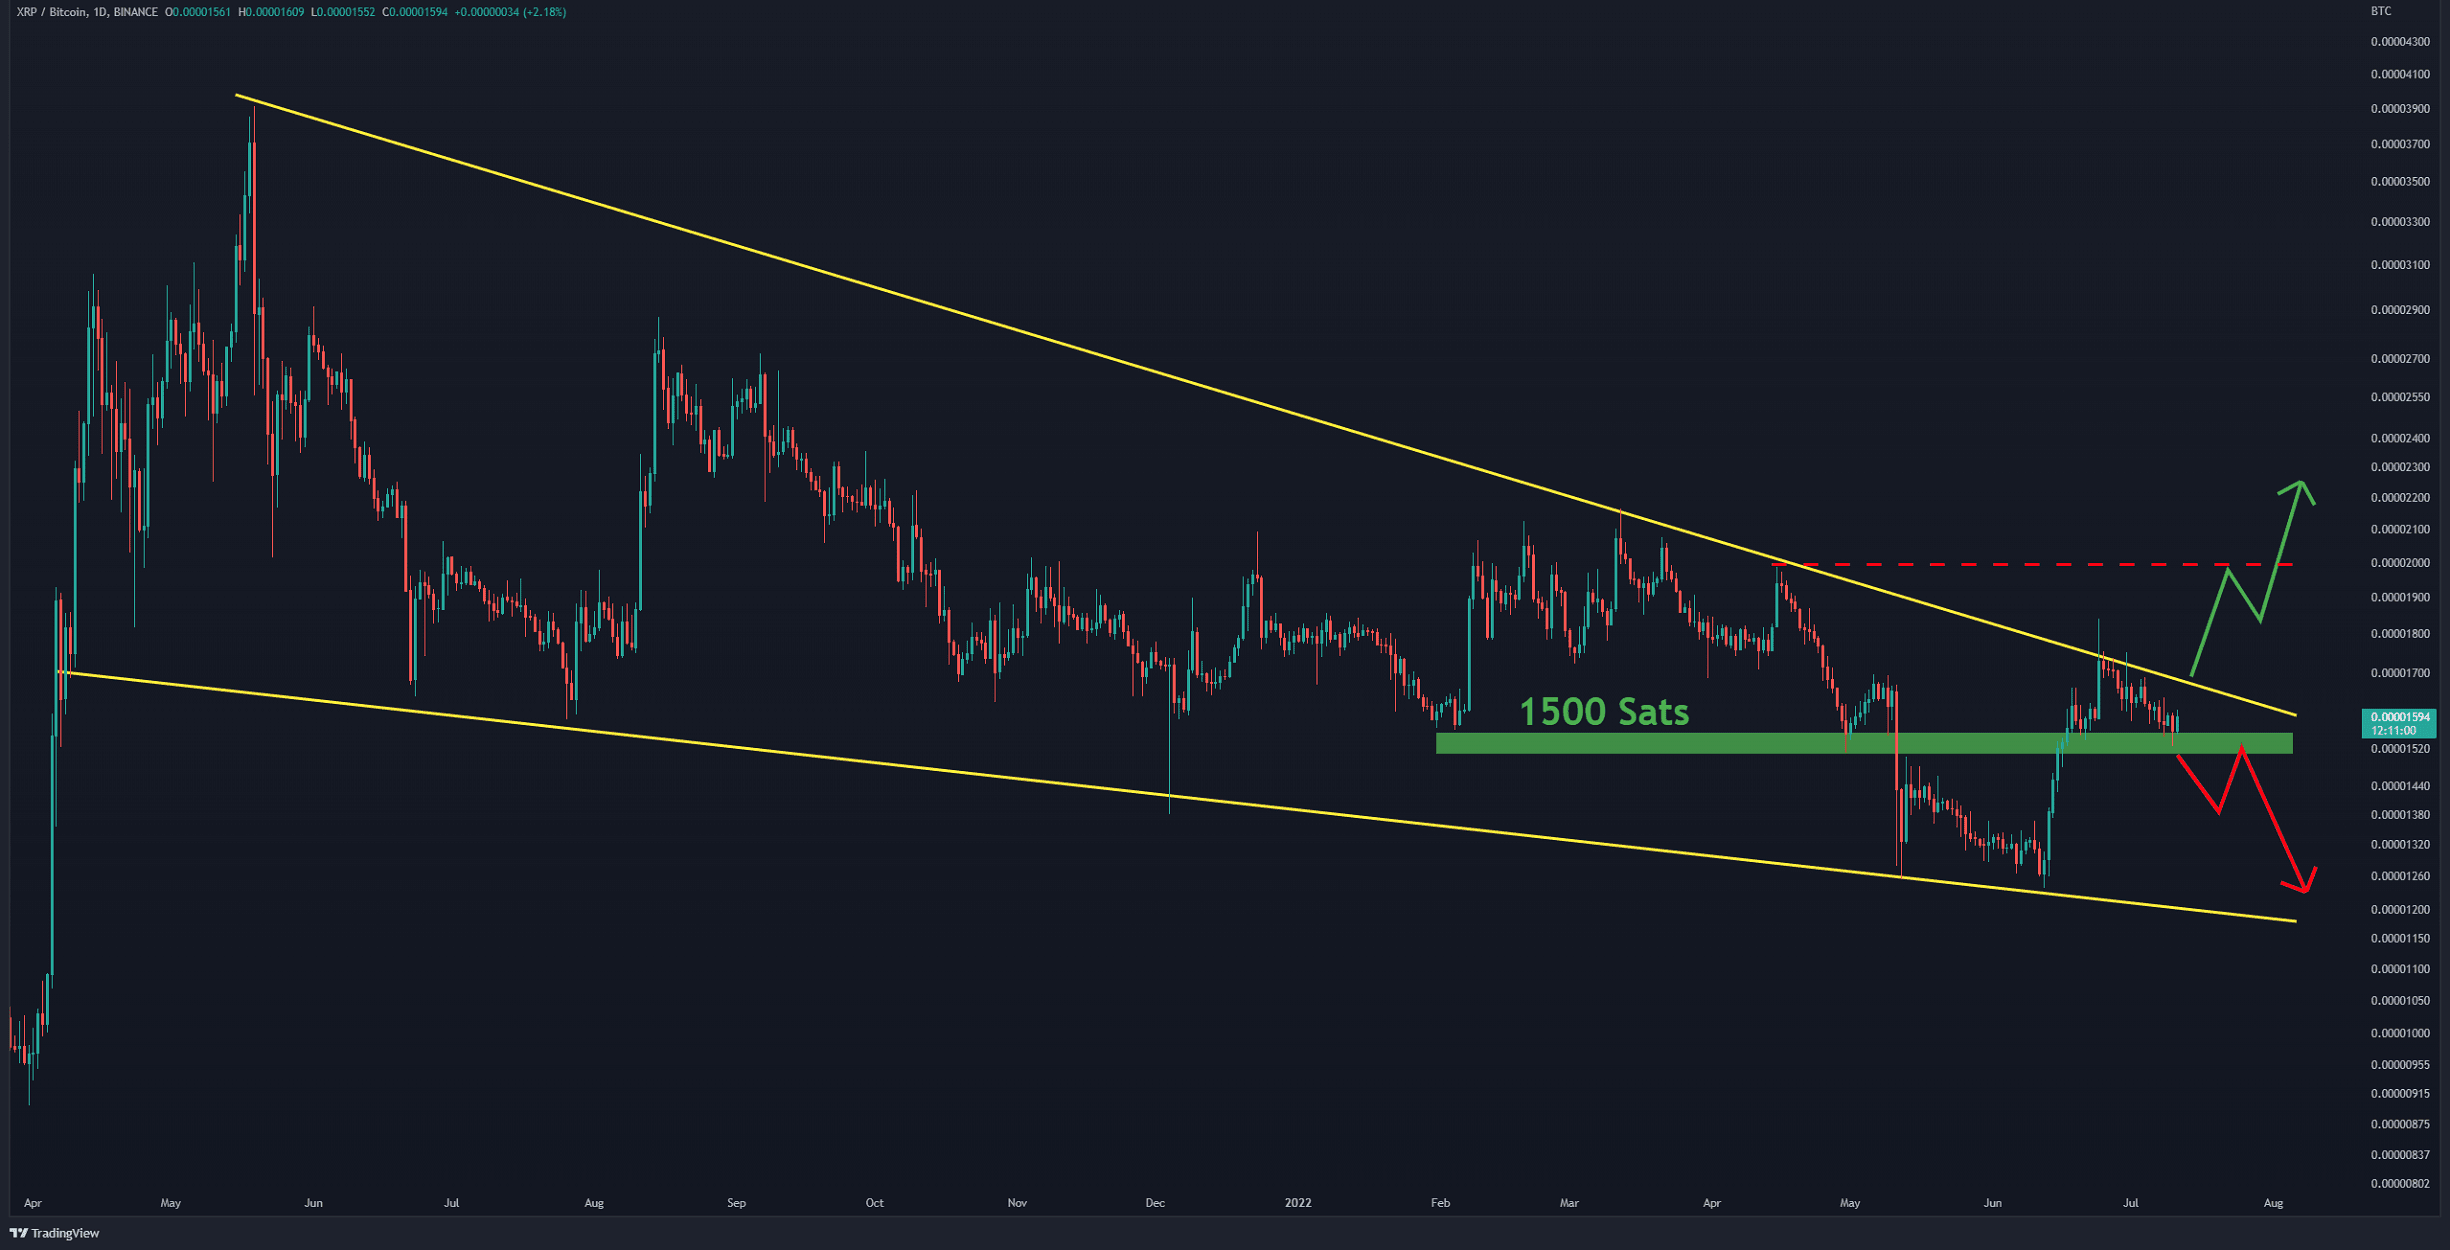
Against Bitcoin, XRP is moving down inside a falling wedge (in yellow). In June, the bulls pushed the price towards the resistance zone at 1700-1800 SATs with a solid bullish leg. The buyers seem determined to keep the price above the horizontal support at 1500 SATs. But if this level is broken to the downside, reaching the bottom of the wedge is not out of the picture (around 1100 SATs).
Key Support Levels: 1500 SATs. & 1250 SATs.
Key Resistance Levels: 1700 SATs. & 1800 SATs.
On-chain Analysis
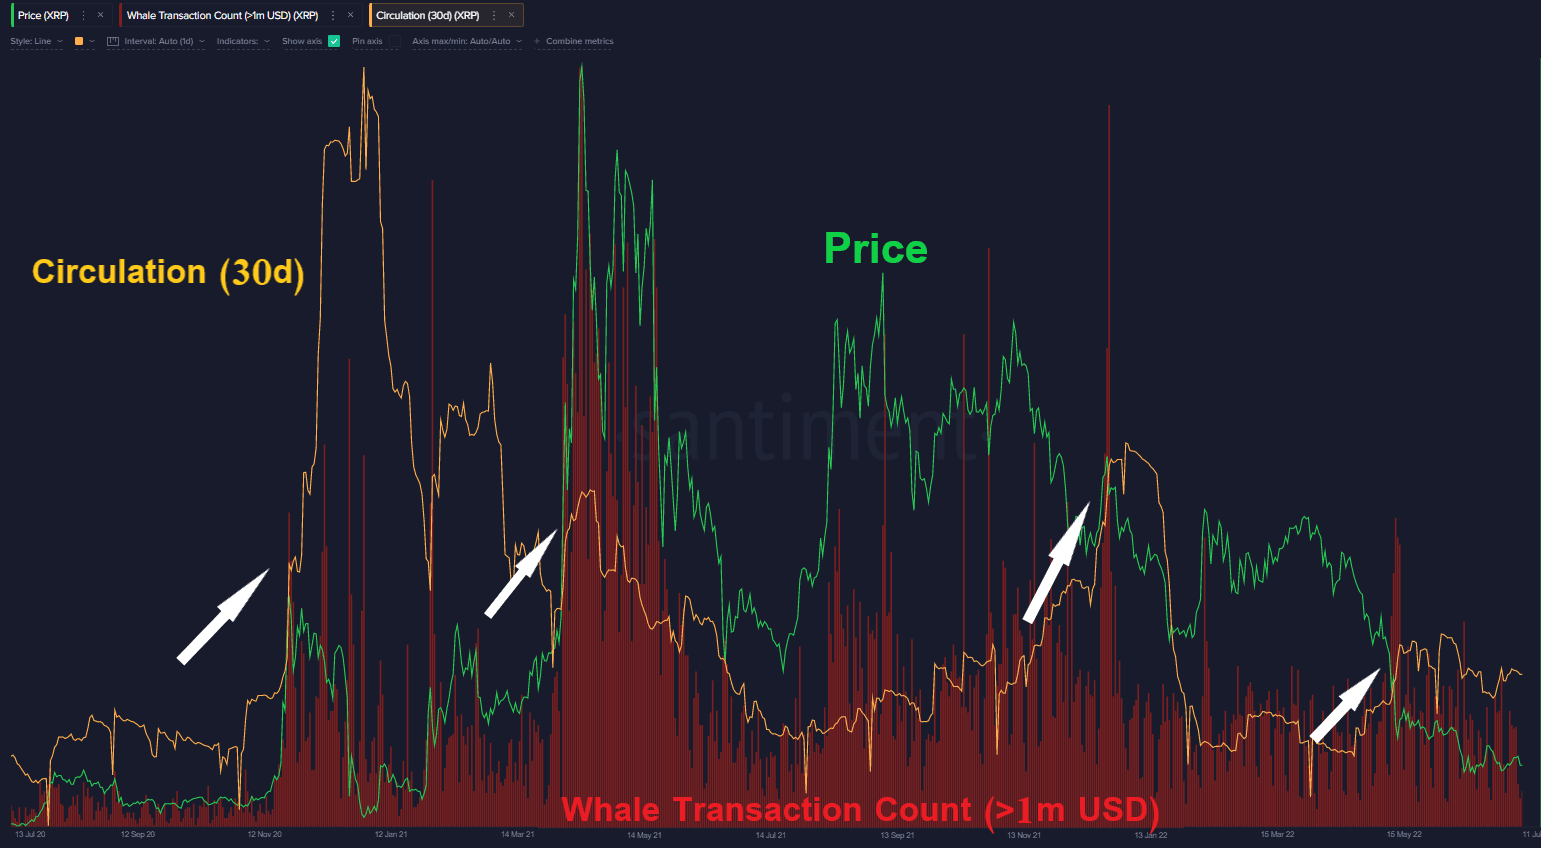
Circulation (30DMA) & Whale Transaction Count (>1m USD)
Throughout the recent market rally, the number of tokens transacted daily on the network (in yellow) has not increased significantly. As evident in the chart, when the number of circulating tokens and the whale +$1M transaction count (in red) both increase at the same time, the probability that XRP will experience a deep drop rises accordingly. Adversely, if these metrics decline together, the structure of the network is signaling a bearish market.
OhNoRipple via https://www.ohnocrypto.com/ @CryptoVizArt, @Khareem Sudlow