
Is BTC Eyeing Another Leg Down Following the Dip Below $22K? (Bitcoin Price Analysis)
Bitcoin has been experiencing what seems to be a prolonged bear market and is down more than 74% from its all-time high. Historically, the 200-week moving average has significantly supported the price and marked the bear market’s bottoms.
Technical Analysis
By Shayan
The Weekly Chart
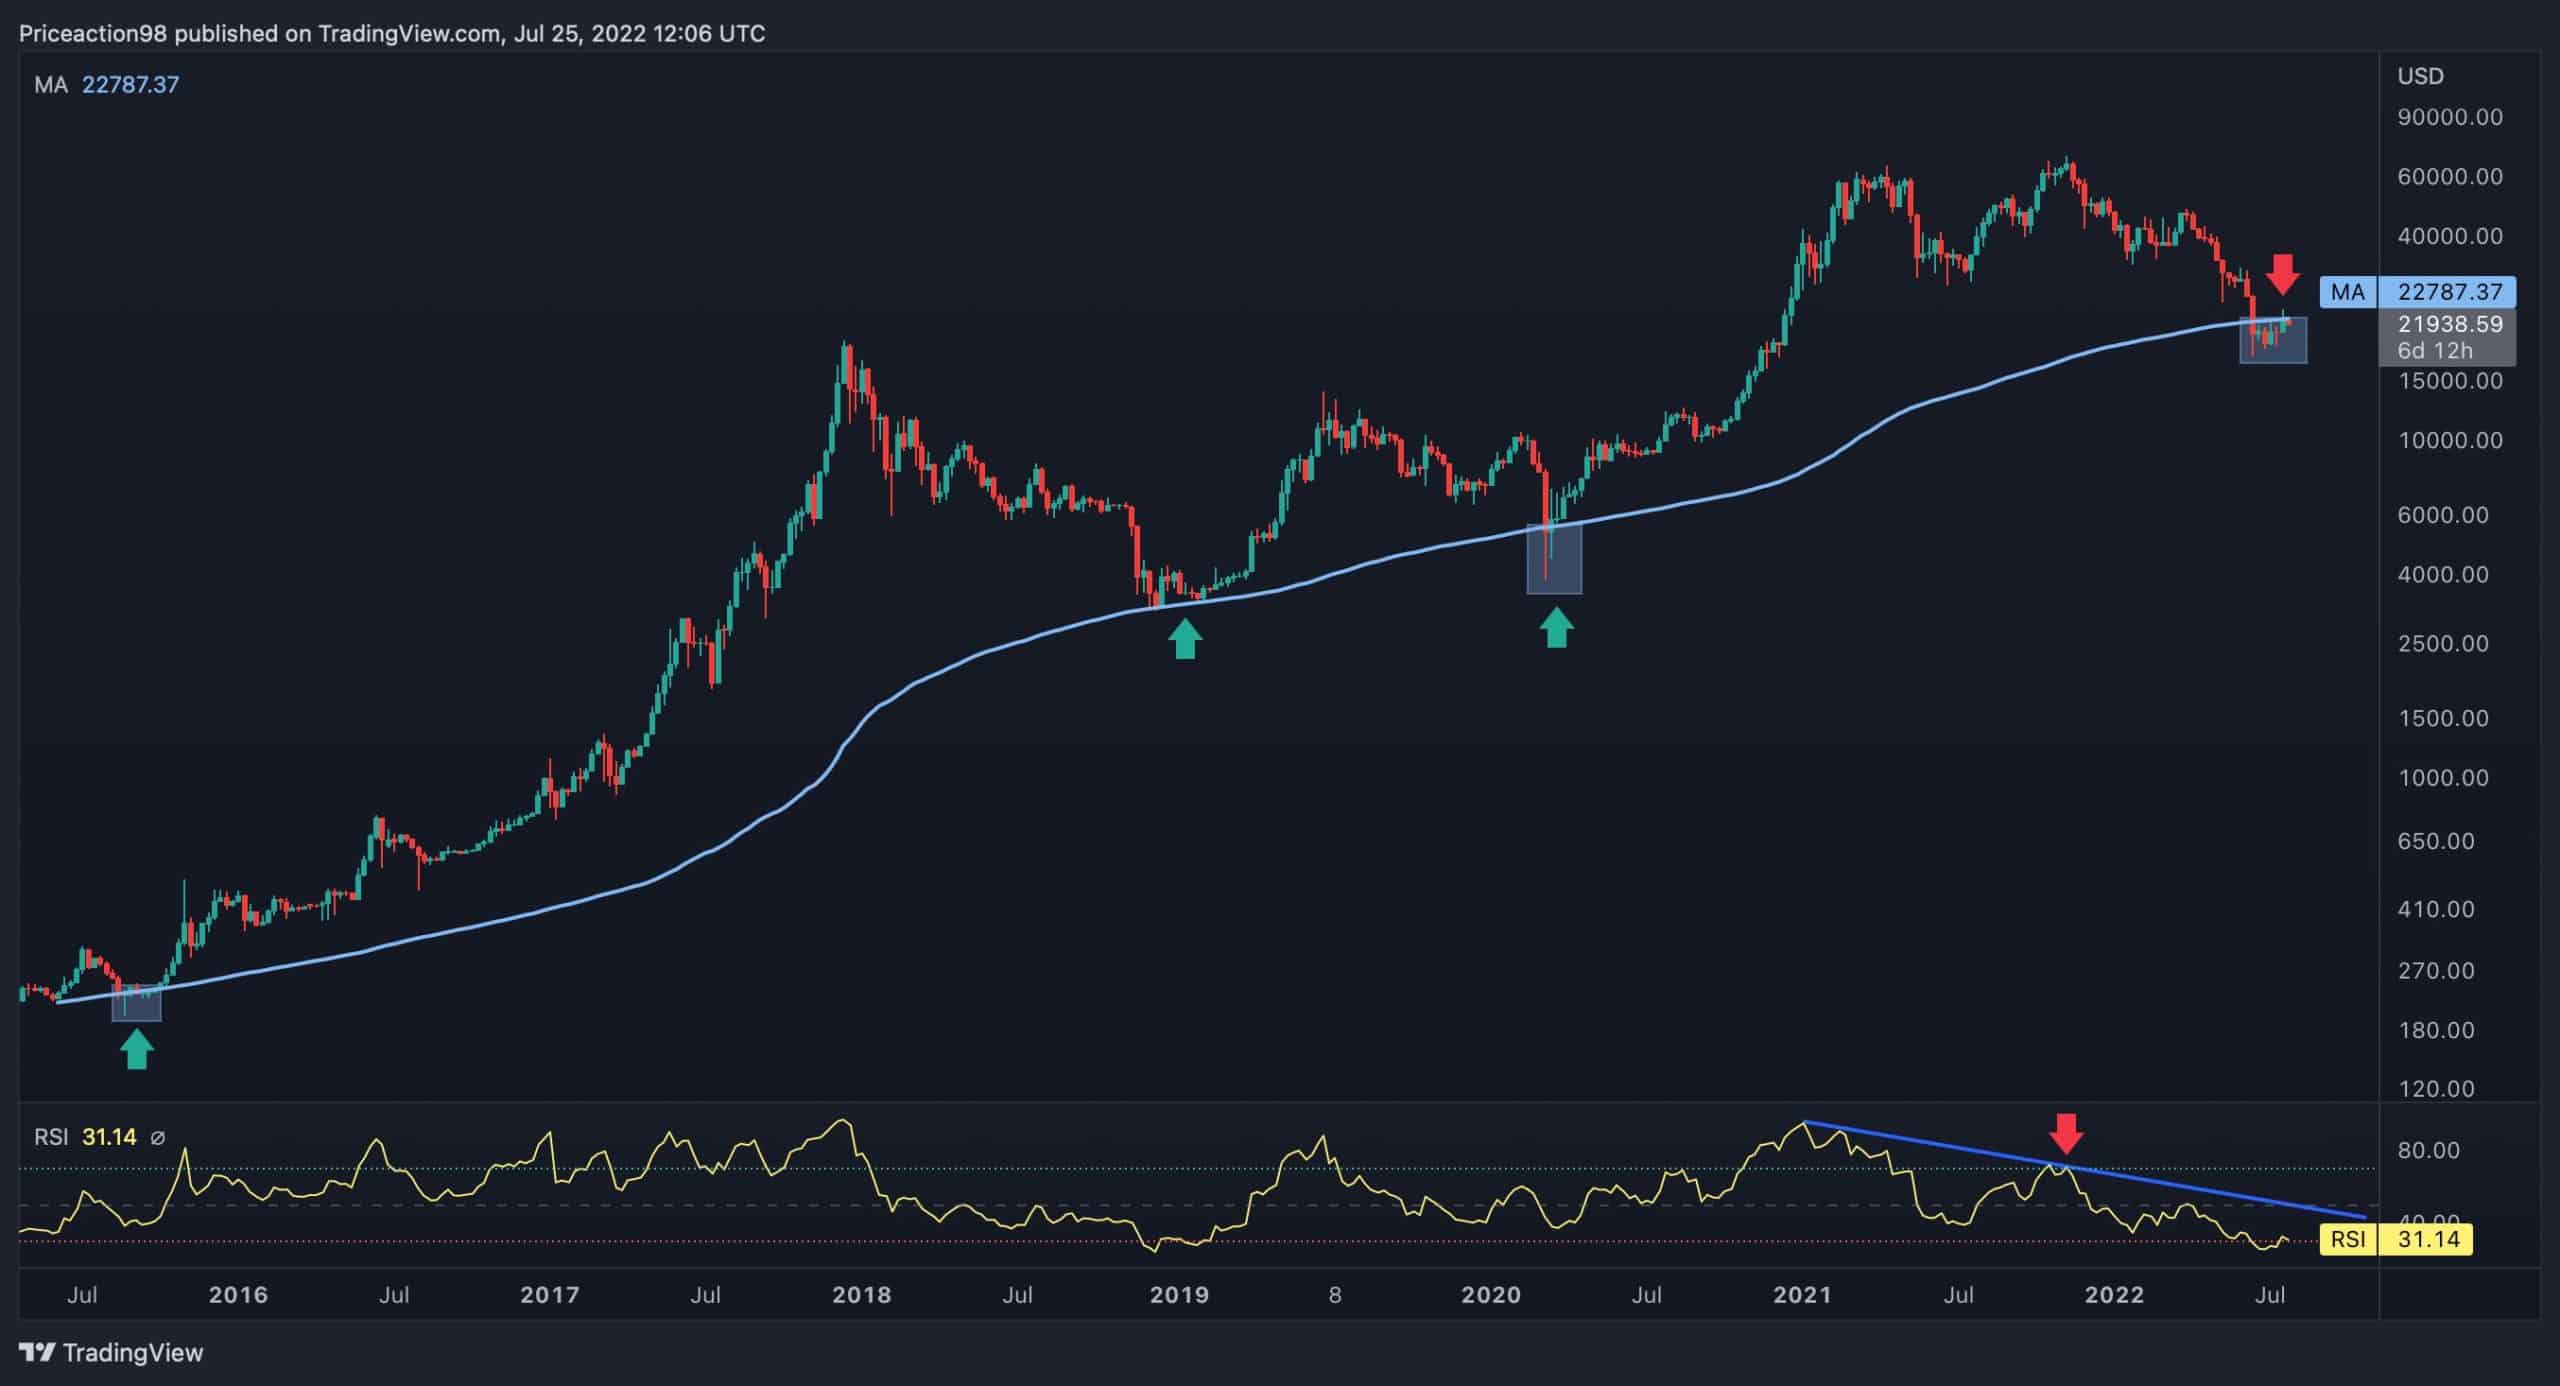
As seen in the following chart, each time after experiencing a 70% correction and at the end of the bear market, Bitcoin’s price has briefly touched the 200-week moving average.
Exceptionally, the price has dropped below this significant moving average during the recent significant shakeout, followed by a pullback to the broken level at around $22.7K. If the pullback pattern turns out to be valid, it can be considered a confirmation for another leg down to the $15K mark.
Nevertheless, the RSI indicator has formed a descending resistance trendline, and the next bull run won’t be anticipated unless the mentioned threshold gets broken.
The 4-Hour Chart
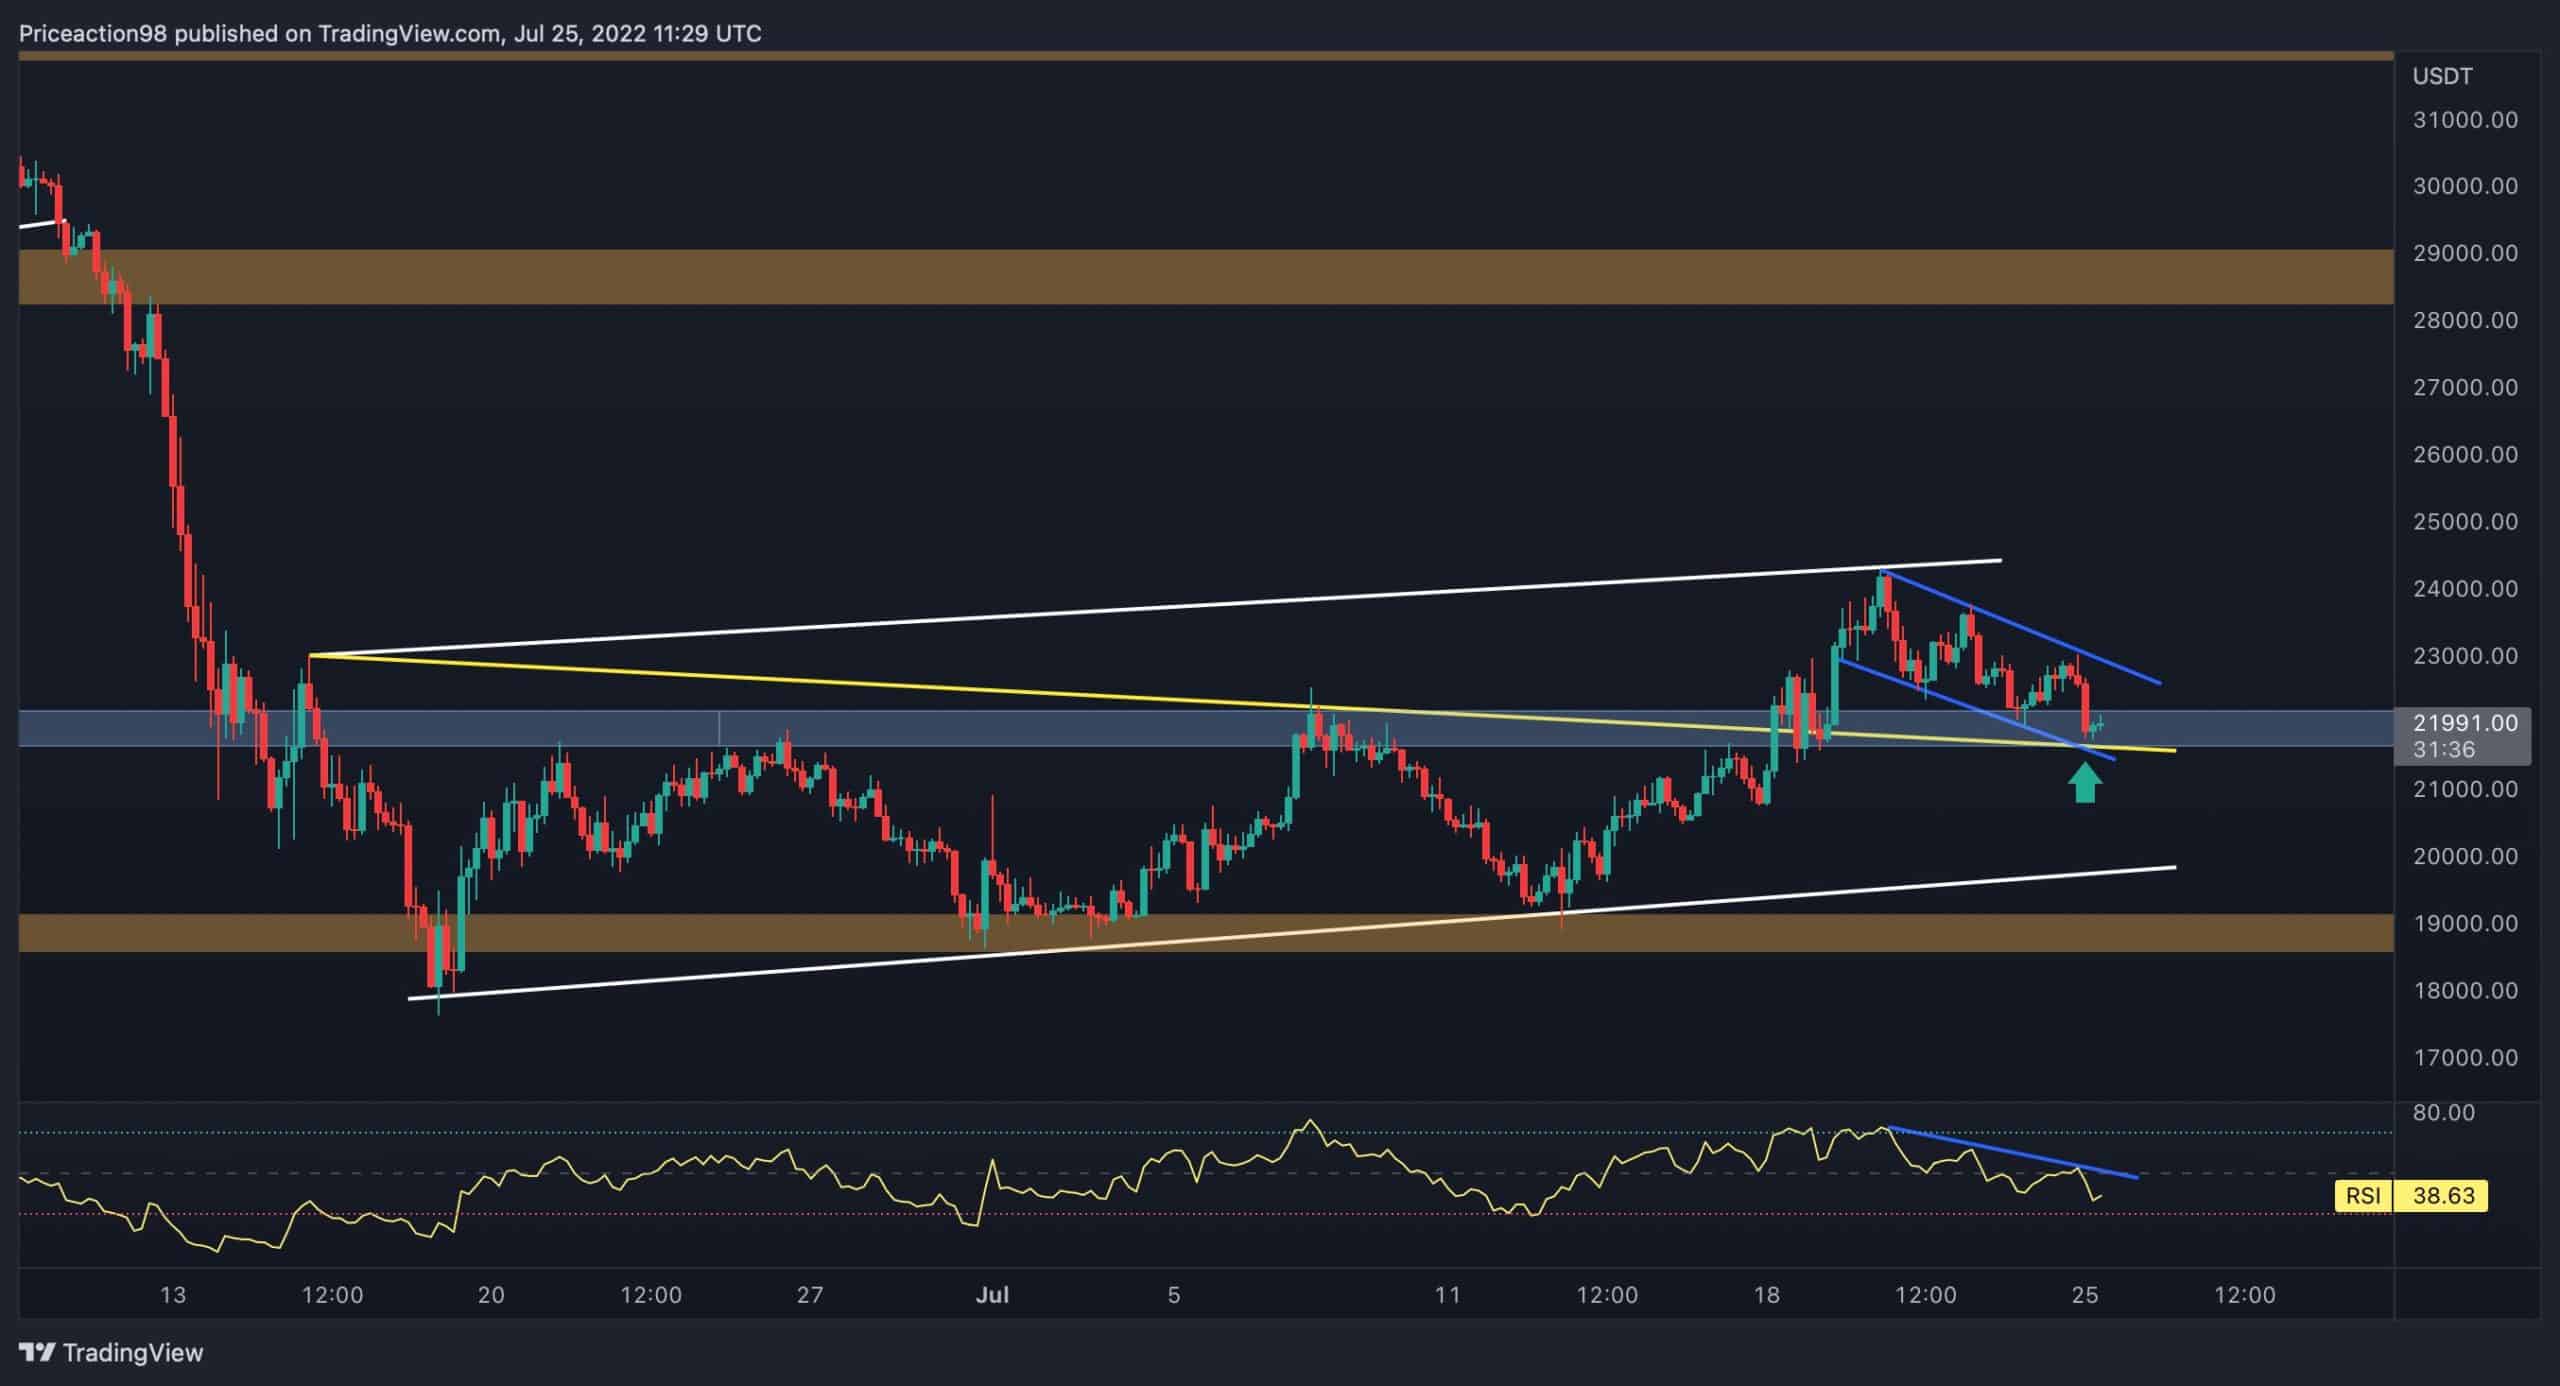
After experiencing a prolonged bearish expansion move, Bitcoin has formed an ascending continuation flag pattern. After reaching the upper boundary for the second time, the price was rejected and had been slightly declining.
However, BTC had broken a mid-term descending trend line (Yellow line) before reaching the flag’s upper band and is now forming a pullback to the broken trendline. If it is completed and the trendline supports the price, Bitcoin is likely to attempt breaking the flag upward for the third time.
Furthermore, the price is forming the pullback inside a descending bullish continuation pattern, increasing the possibility of a short-term bullish rise toward the main flag’s upper trendline. Nevertheless, as well as the weekly time frame, the RSI indicator has formed a descending resistance trendline which must be broken for the next surge towards new all-time highs.
On-chain Analysis
By Edris
Bitcoin whales’ accumulation heatmap
Bitcoin’s wealthiest investors, AKA whales, are one of the most influential cohorts in the market, and their actions significantly affect the price in the short-term and the long-term.
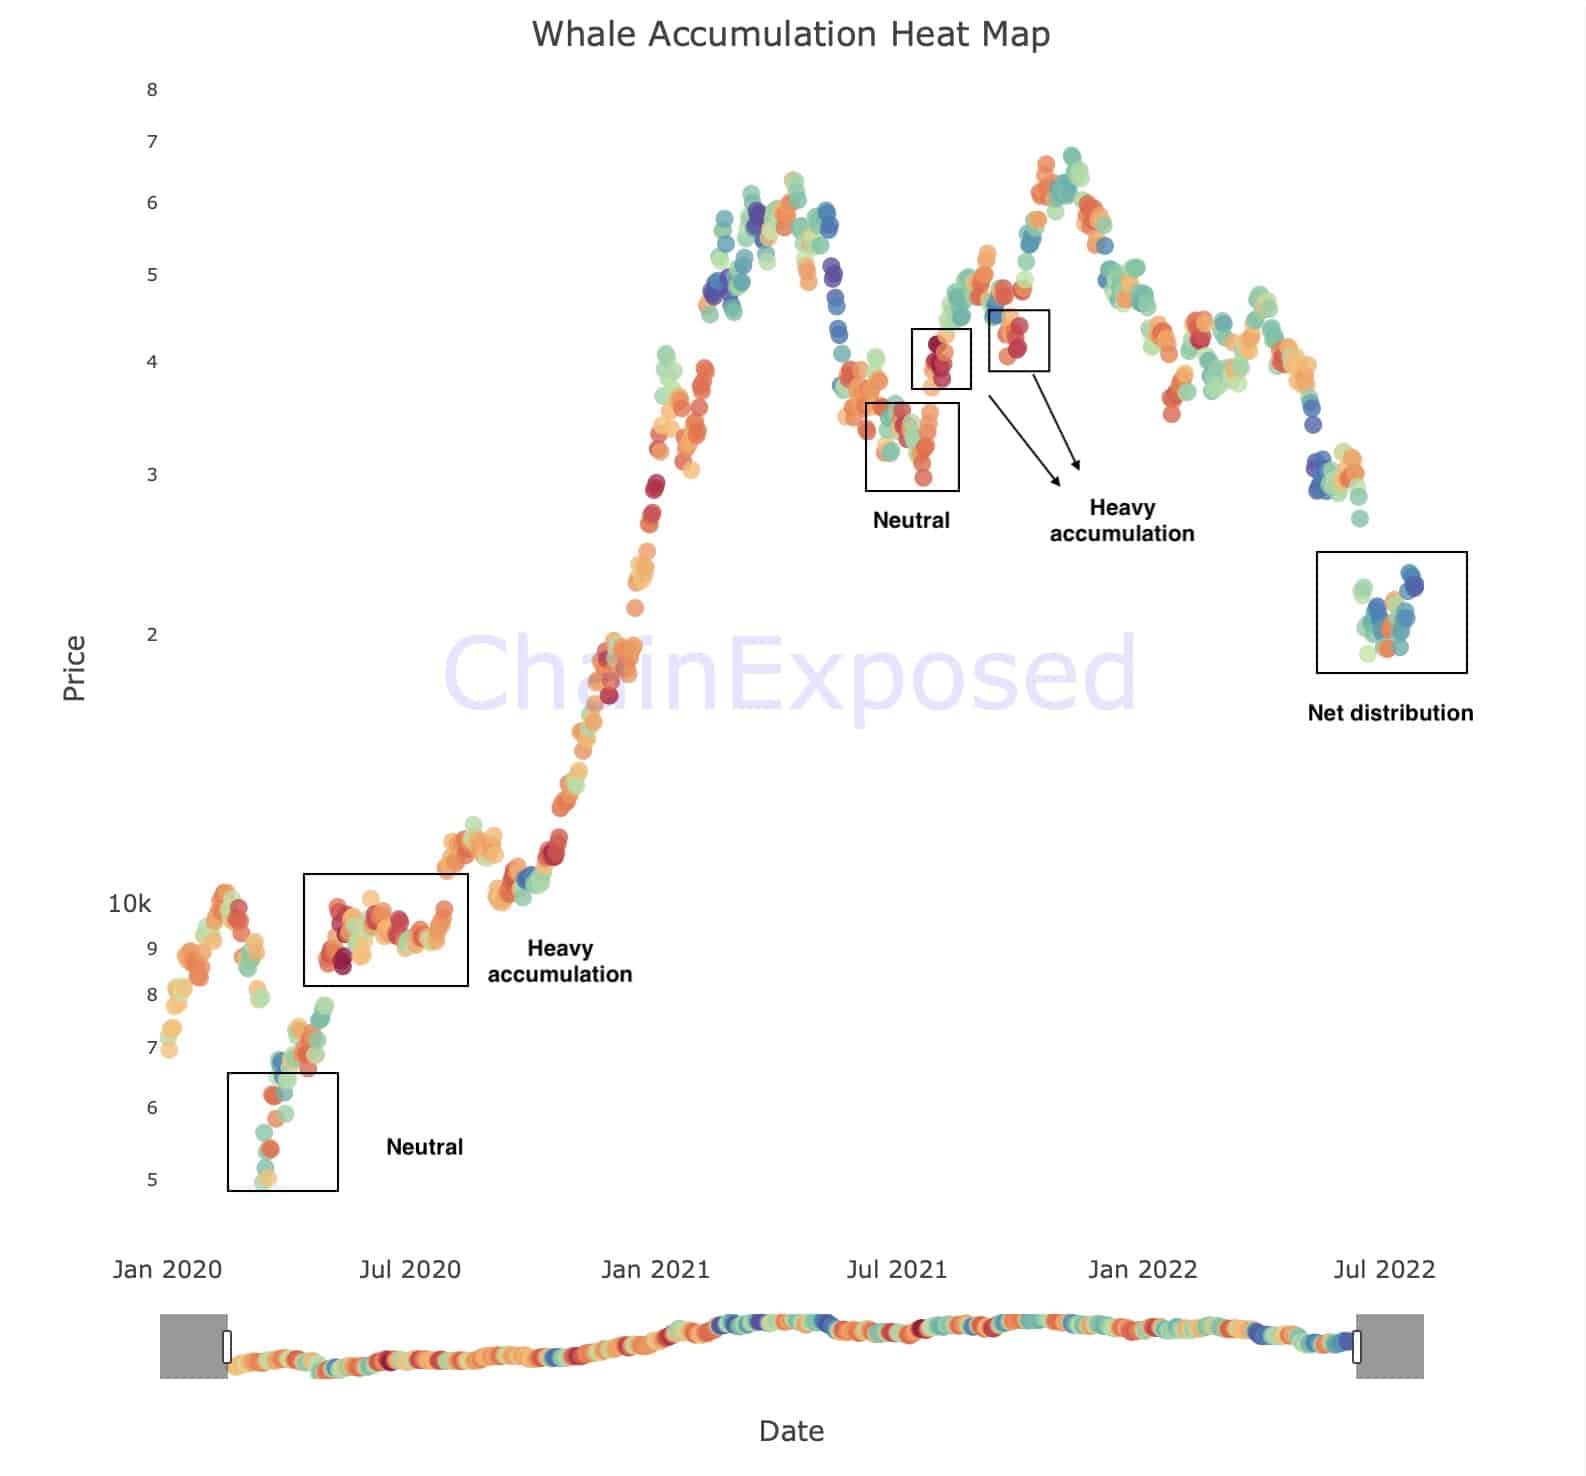
The whale’s heatmap metric demonstrates whales’ accumulation or distribution behavior by comparing their weekly balances. The warm colors on the chart represent net accumulation periods, and the cold colors represent net distribution periods.
It is evident that the whales are neutral at the absolute price bottoms, but they start aggressive accumulation after the price shows strength. So, it could be concluded that the market bottoms when the supply drains and rallies higher when the demand comes in.
Currently, the whales are not showing any significant willingness to accumulate and are rather distributing their coins. This behavior could point to more downside in the short term unless an aggressive accumulation period begins in the coming weeks.
OhNoRipple via https://www.ohnocrypto.com/ @CryptoVizArt, @Khareem Sudlow