
ETH Reclaims the Critical Level of WMA-200, Is the Danger Over? (Ethereum Price Analysis)
For almost two weeks, the bulls have been dominating the crypto markets. However, despite the rising optimism, some analysts believe the recent bullish leg is just a relief rally that will end as a dead-cat bounce.
Technical Analysis
Technical Analysis By Grizzly
The Daily Chart
On the daily, $1500 turned out to be significant support and so far successfully holds well. Ethereum has reclaimed the much-discussed 200-week moving average line (in green), but the price is still below the 200-day moving average line (in white).
The following chart shows that key levels appear by adding Fibonacci retracement levels from the all-time high to the 2022 lows at $880.
The first Fibonacci level – 23.6% (in purple) – lies at $1300, whereas the price was able to break above it. The next level is 38.2% (in yellow), which overlaps with the horizontal resistance at $1700.
Currently, this overhead resistance seems to be challenging for Ethereum. If the bulls break above this level, ETH will probably retest the daily MA-200 at the 50% Fib level (in light blue).
If ETH price spikes to $1,700, we will likely see traders realize profits and a healthy correction towards $1,500 or even $1,300.

Key Support Levels: $1500 & $1300
Key Resistance Levels: $1700 & $2100
Daily Moving Average Levels:
MA20: $1321
MA50: $1300
MA100: $1843
MA200: $2391
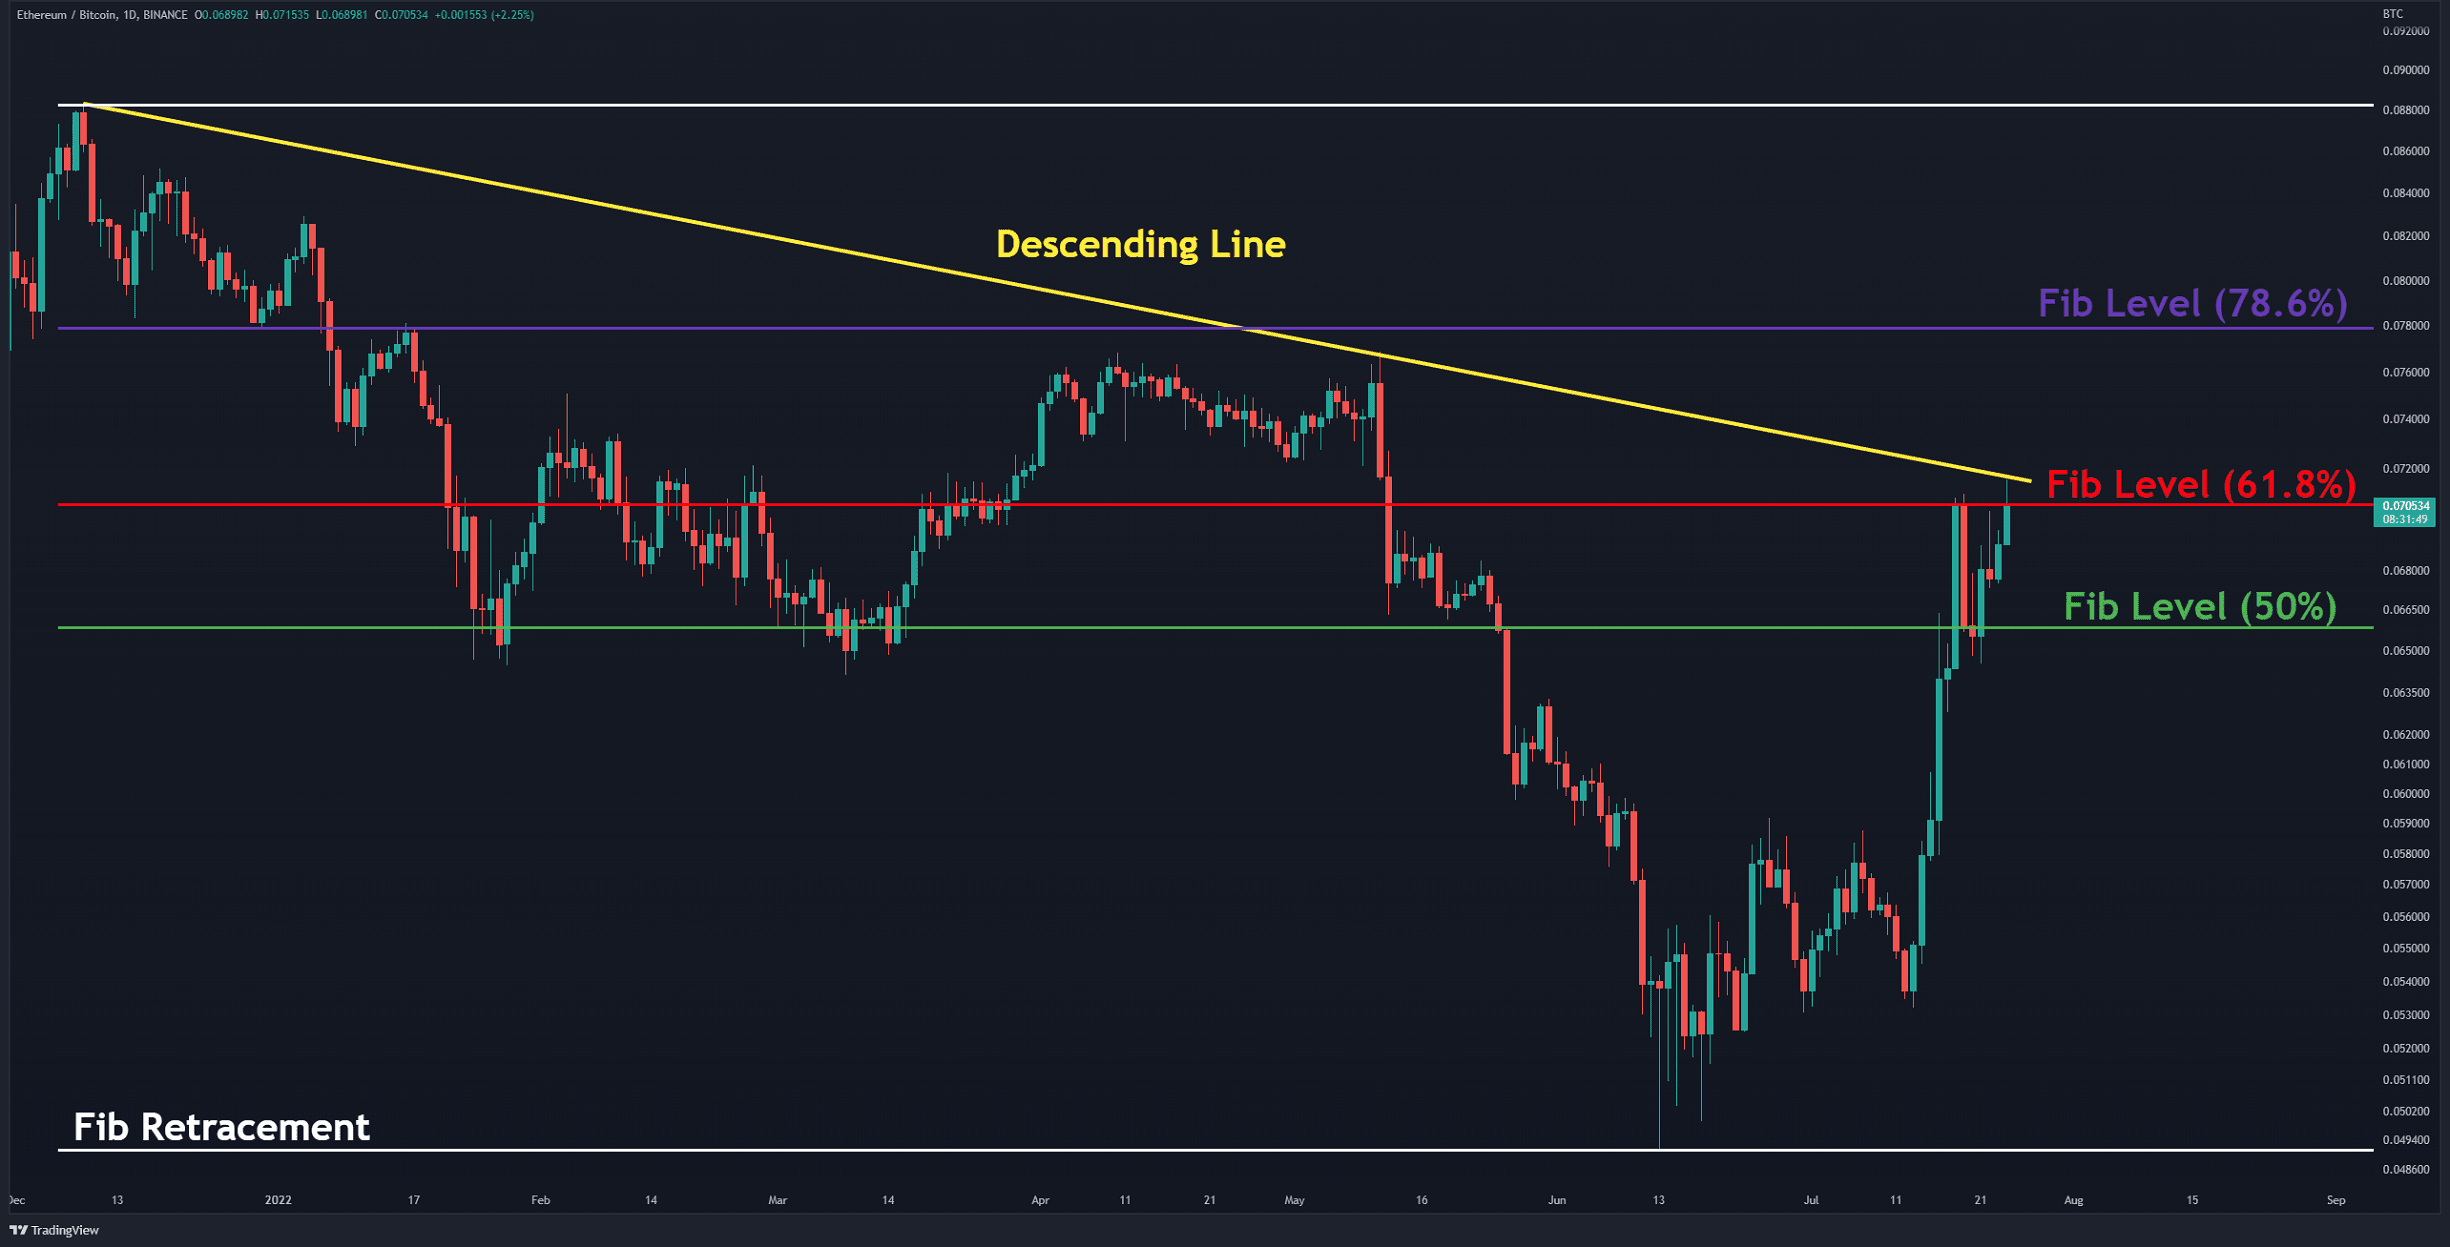
The ETH/BTC Chart
Against Bitcoin, the price is trading below the descending line (in yellow), which acts as resistance. The past two attempts to break above this line ended with a sharp retrace.
The intersection with the Fibonacci level of 61.8% (in red) has also formed a strong resistance zone. If the price can break above this area, the next resistance is likely the 78.6% level, which lies at 0.078 BTC.
The bullish structure is valid as long as the price flirts above the 0.065 BTC level.
Key Support Levels: 0.065 & 0.06 BTC
Key Resistance Levels: 0.07 & 0.078 BTC
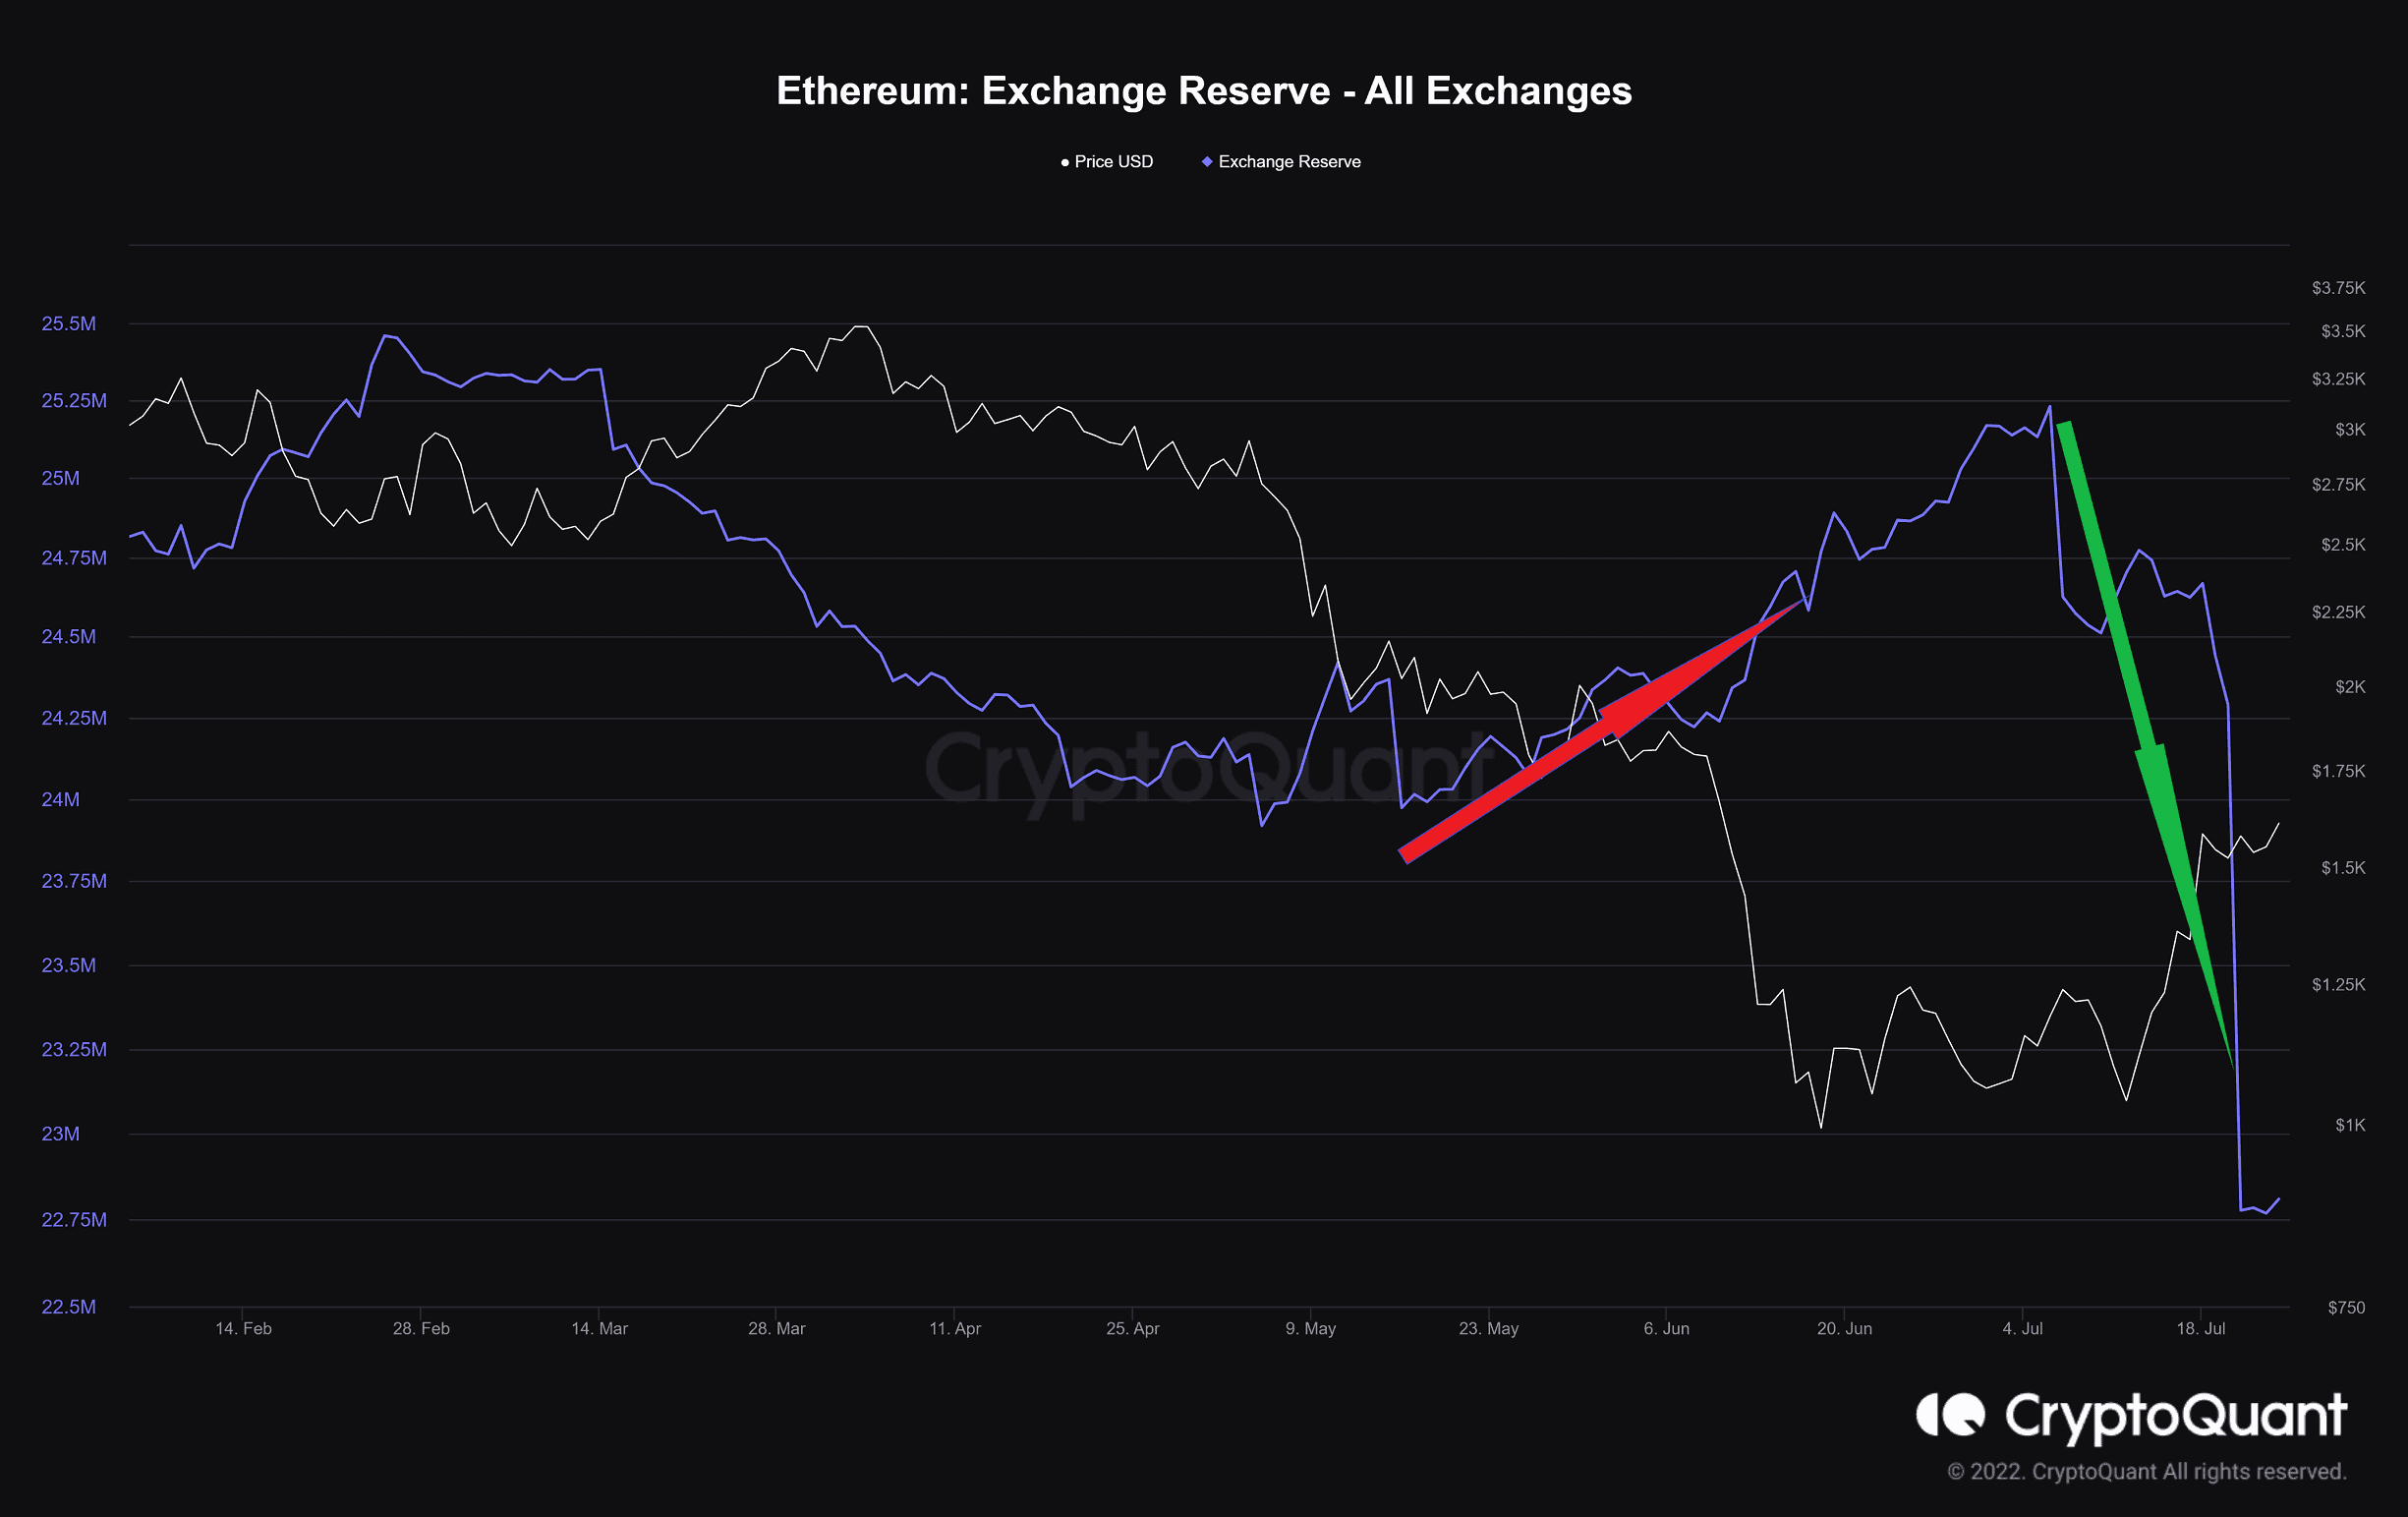
On-chain Analysis: Exchange Reserve
Definition: The total number of coins held on exchanges.
As the exchange reserves continue to rise, it indicates higher selling pressure and has a negative correlation to the price.
During the recent bear market, many investors were convinced to deposit their coins to exchanges, which increased the selling pressure of the last bearish leg.
Following the Ethereum Merge announcement, this metric sharply declined and caused the ETH’s supply on exchanges to drop from 25.2 million on July 6 to 22.8 million. It should be noted that this outflow was attributed to spot markets.
OhNoRipple via https://www.ohnocrypto.com/ @CryptoVizArt, @Khareem Sudlow