
Bitcoin Tests $24K but Is The Rally Getting Overheated? (BTC Price Analysis)
Bitcoin price action resembles a bottom formation phase, as it has rebounded from the $17K-$20K range. After creating multiple higher highs and lows over the last few weeks, the market has shown signs of strength, indicating that a bullish trend is shaping, at least in the short term.
Technical Analysis
By Edris
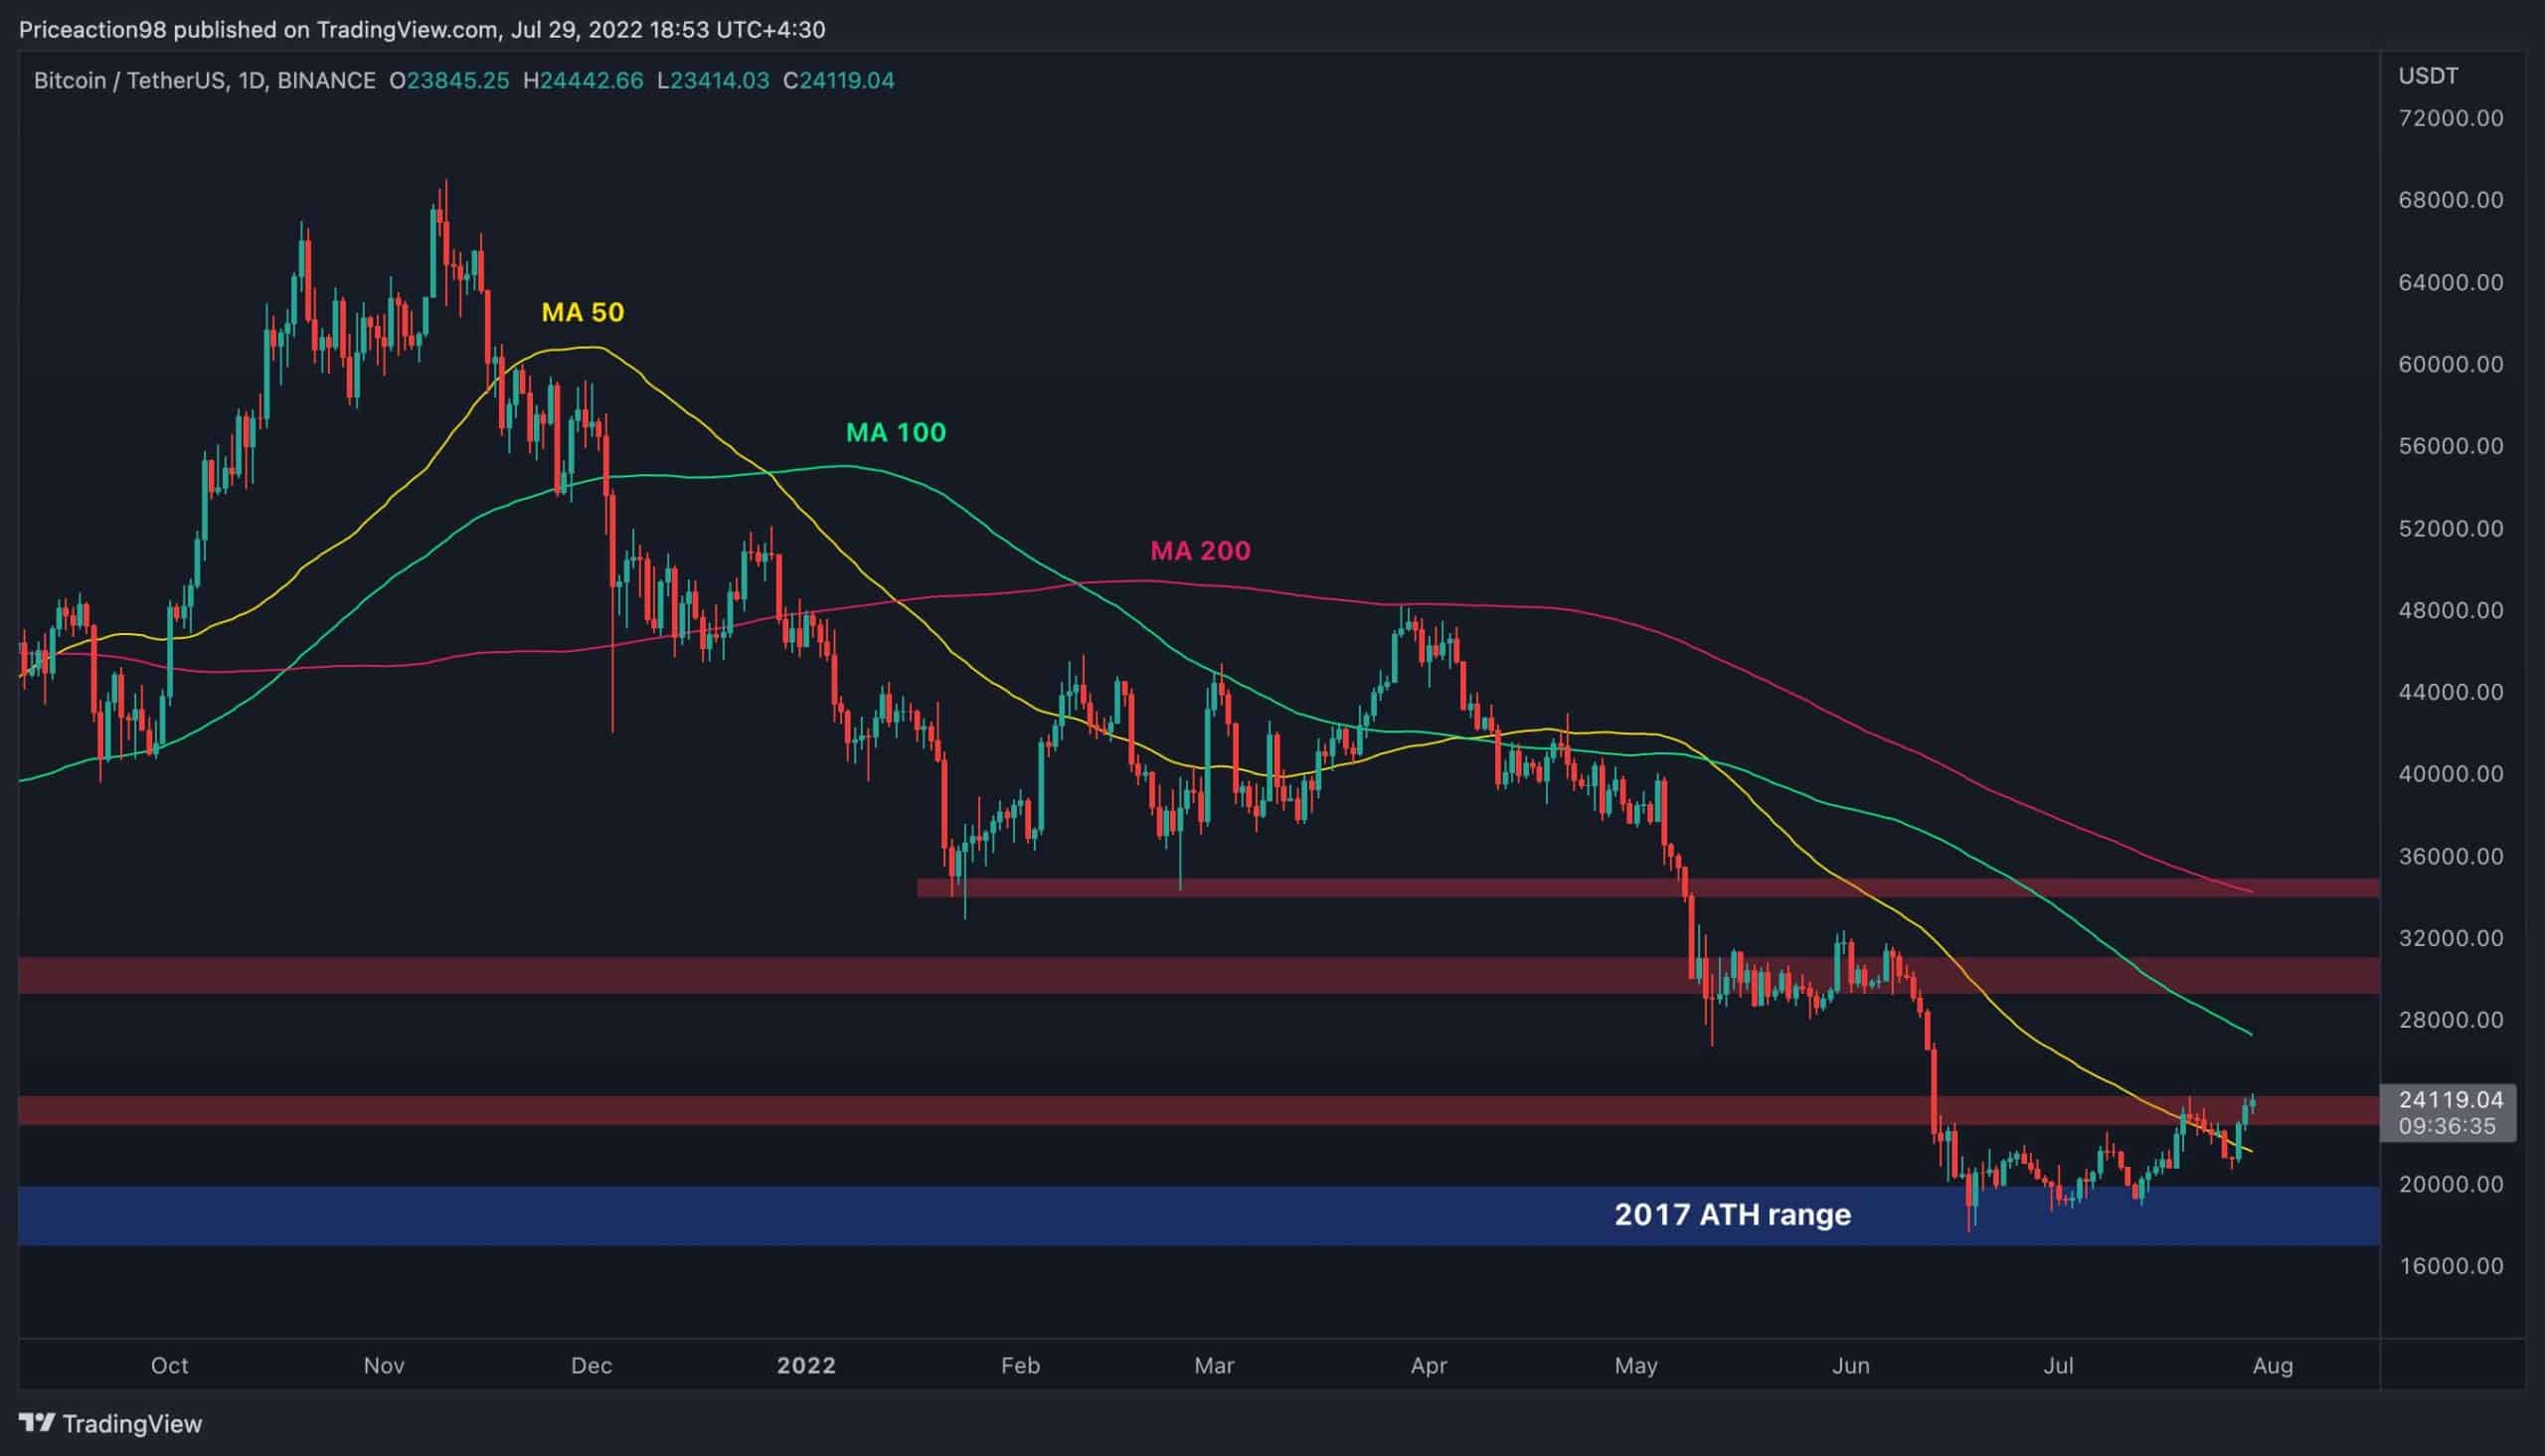
The Daily Chart
The key $24K resistance level is still intact, and the price has yet to break it to the upside with significant momentum. In case of a bullish breakout, the 100-day moving average, which currently resides near the $28K level, would be the first obstacle before the significant $30K supply zone. On the other hand, the 50-day moving average would likely act as support after getting broken to the upside if a bearish pullback was to occur in the short term.
The 4-Hour Chart
On the 4-hour timeframe, it is evident that the price is still yet to break the bearish flag pattern to the upside. The cryptocurrency is currently testing the higher boundary of the pattern for the third time, and if it successfully breaks above, a rally towards the $30K supply zone would become more likely.
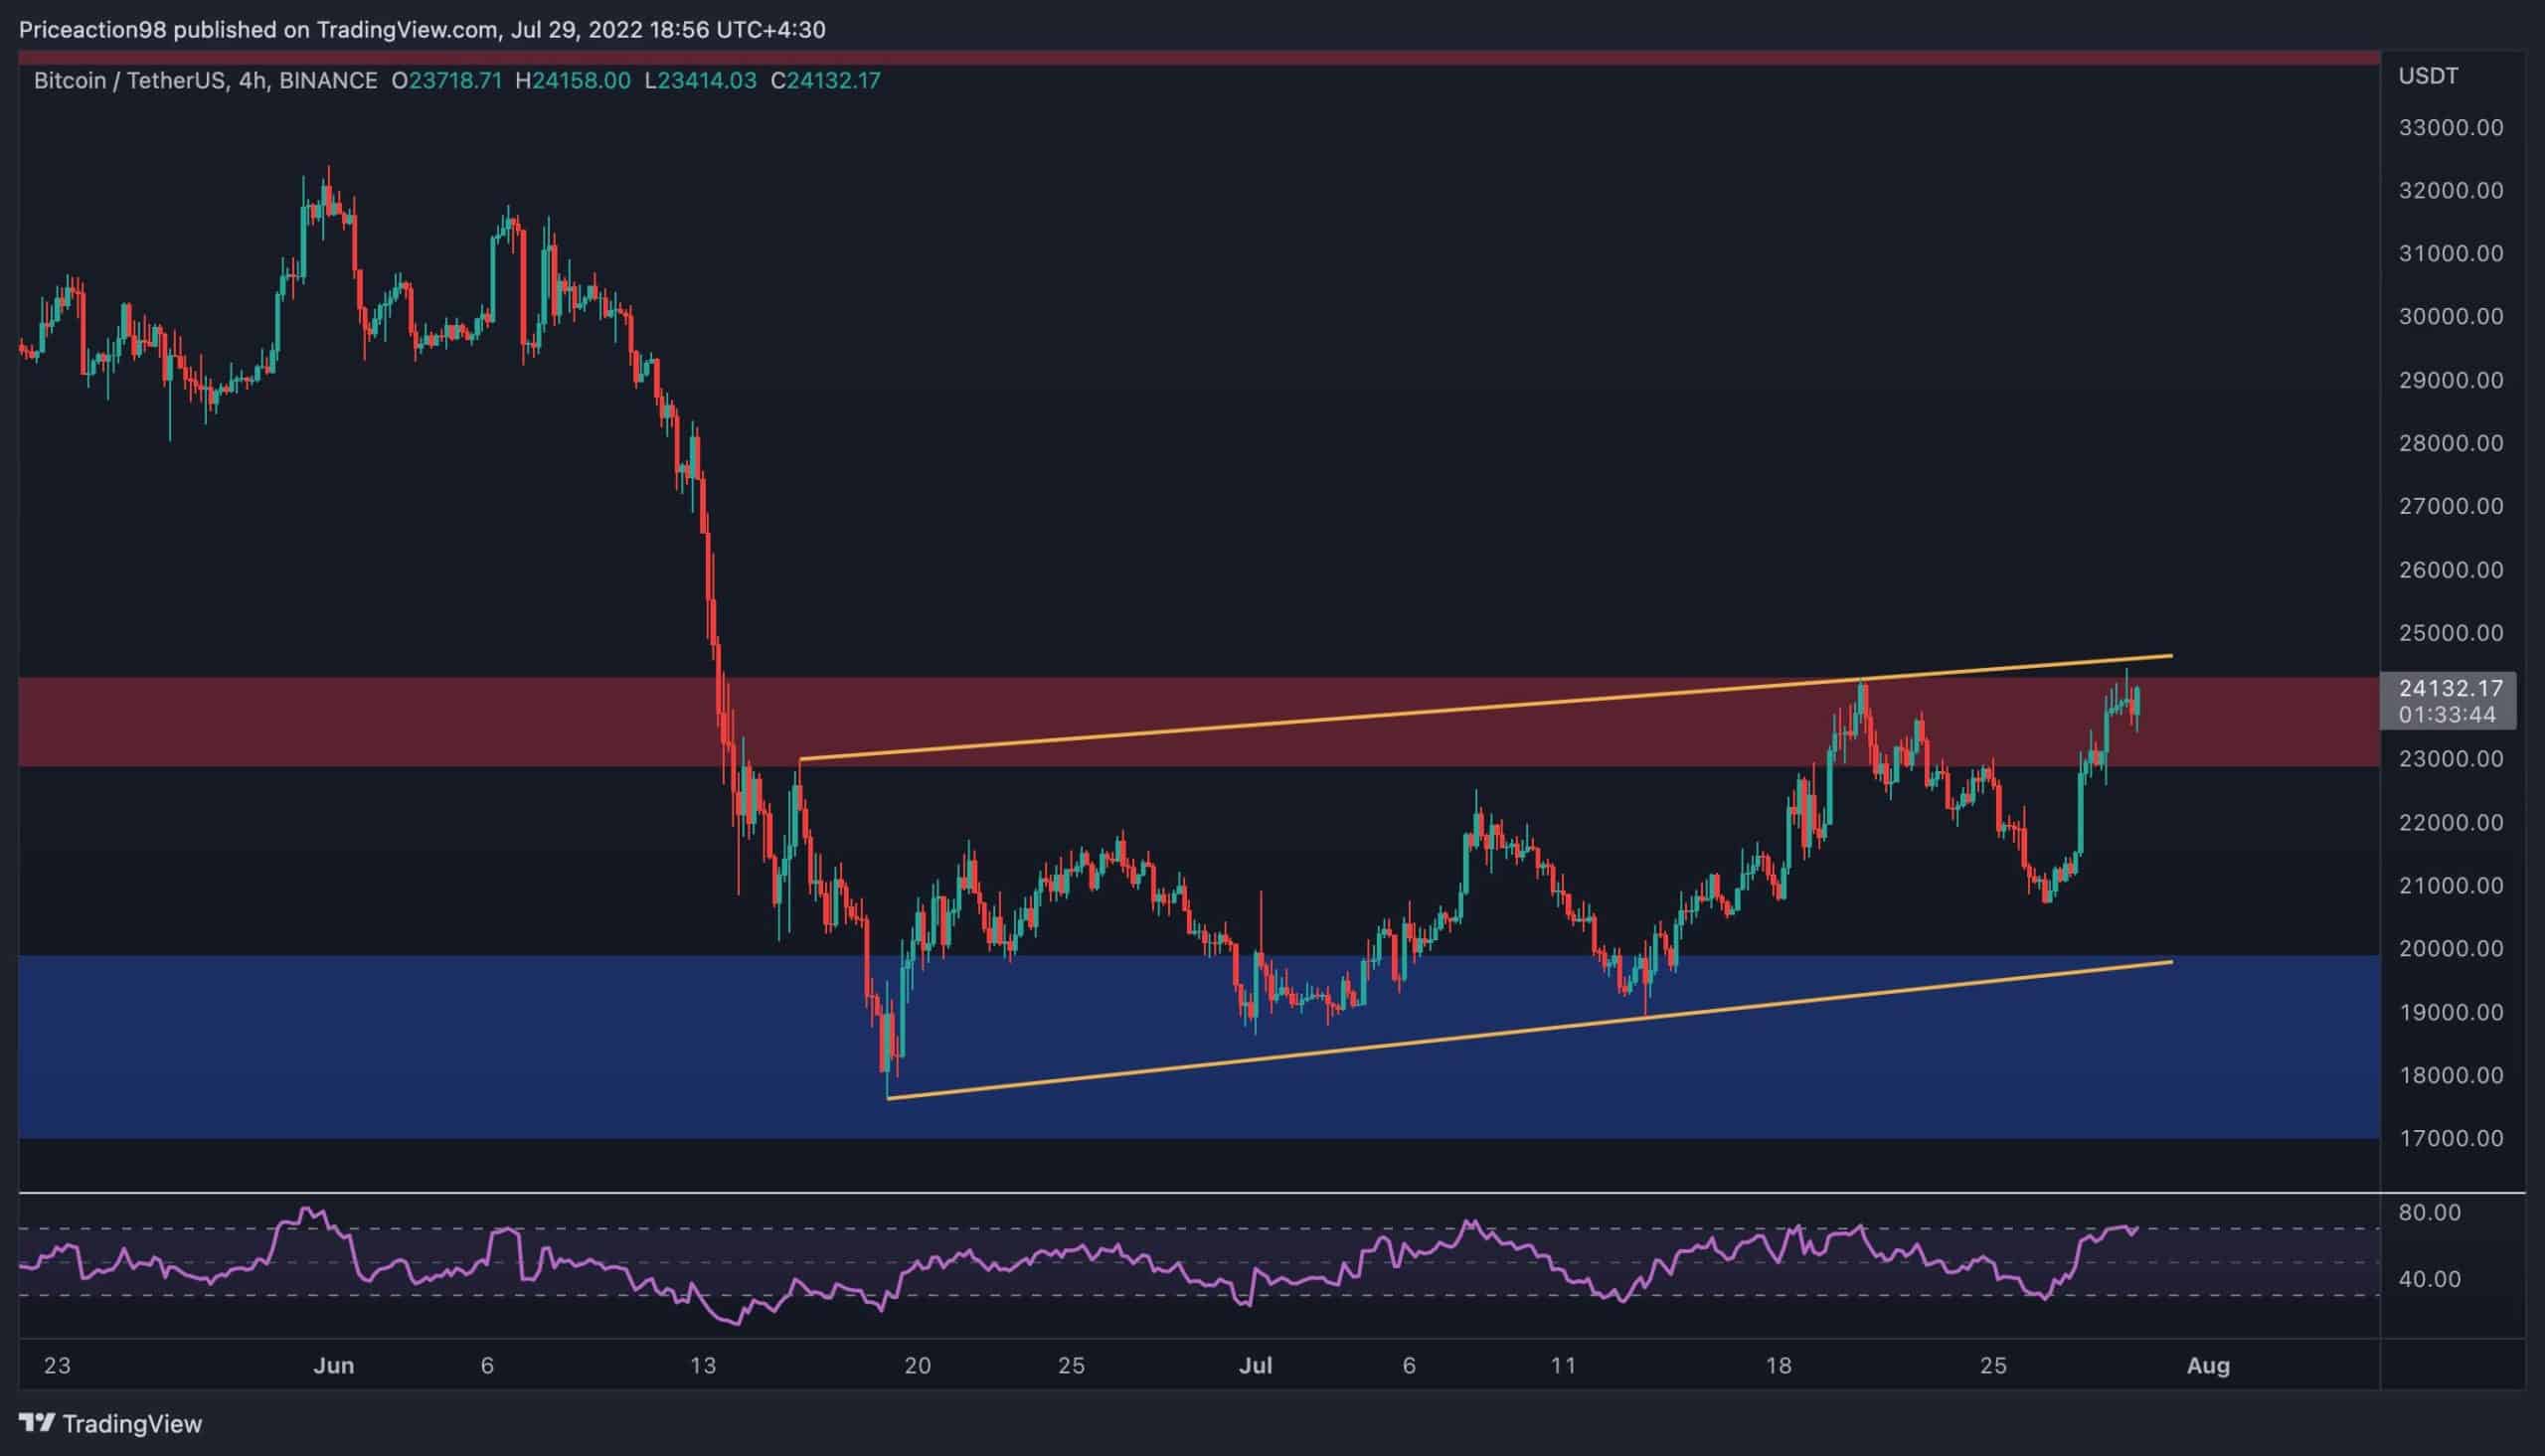
However, a third touch rejection and a bearish continuation after a break below the flag cannot be ruled out yet, especially since the RSI indicator is signaling that the market is in an overbought state (values above 70%). The bearish scenario would likely unfold if the price fails to break above the flag in the next few days, and in this case, a drop towards the $17K support and even lower comes into play.
On-chain Analysis
By: Edris
Bitcoin Exchange Inflow Spent Output Value Bands
Bitcoin’s price has been in a massive downtrend over the last six months, leading to many investors losing faith and cutting their losses by panic selling their coins. As the Exchange Inflow SOVB chart demonstrates, even the wealthier cohorts in the Bitcoin market have not been an exception and are capitulating as the price drops lower.
This metric shows the exchange inflows of more than 1 BTC, so it filters out the smaller entities. The last few marked peaks show capitulation events as significant amounts of Bitcoin have been deposited into the exchanges. Both occurred during rapid drops in May and June 2022, when Bitcoin broke below $40K and $30K, respectively.
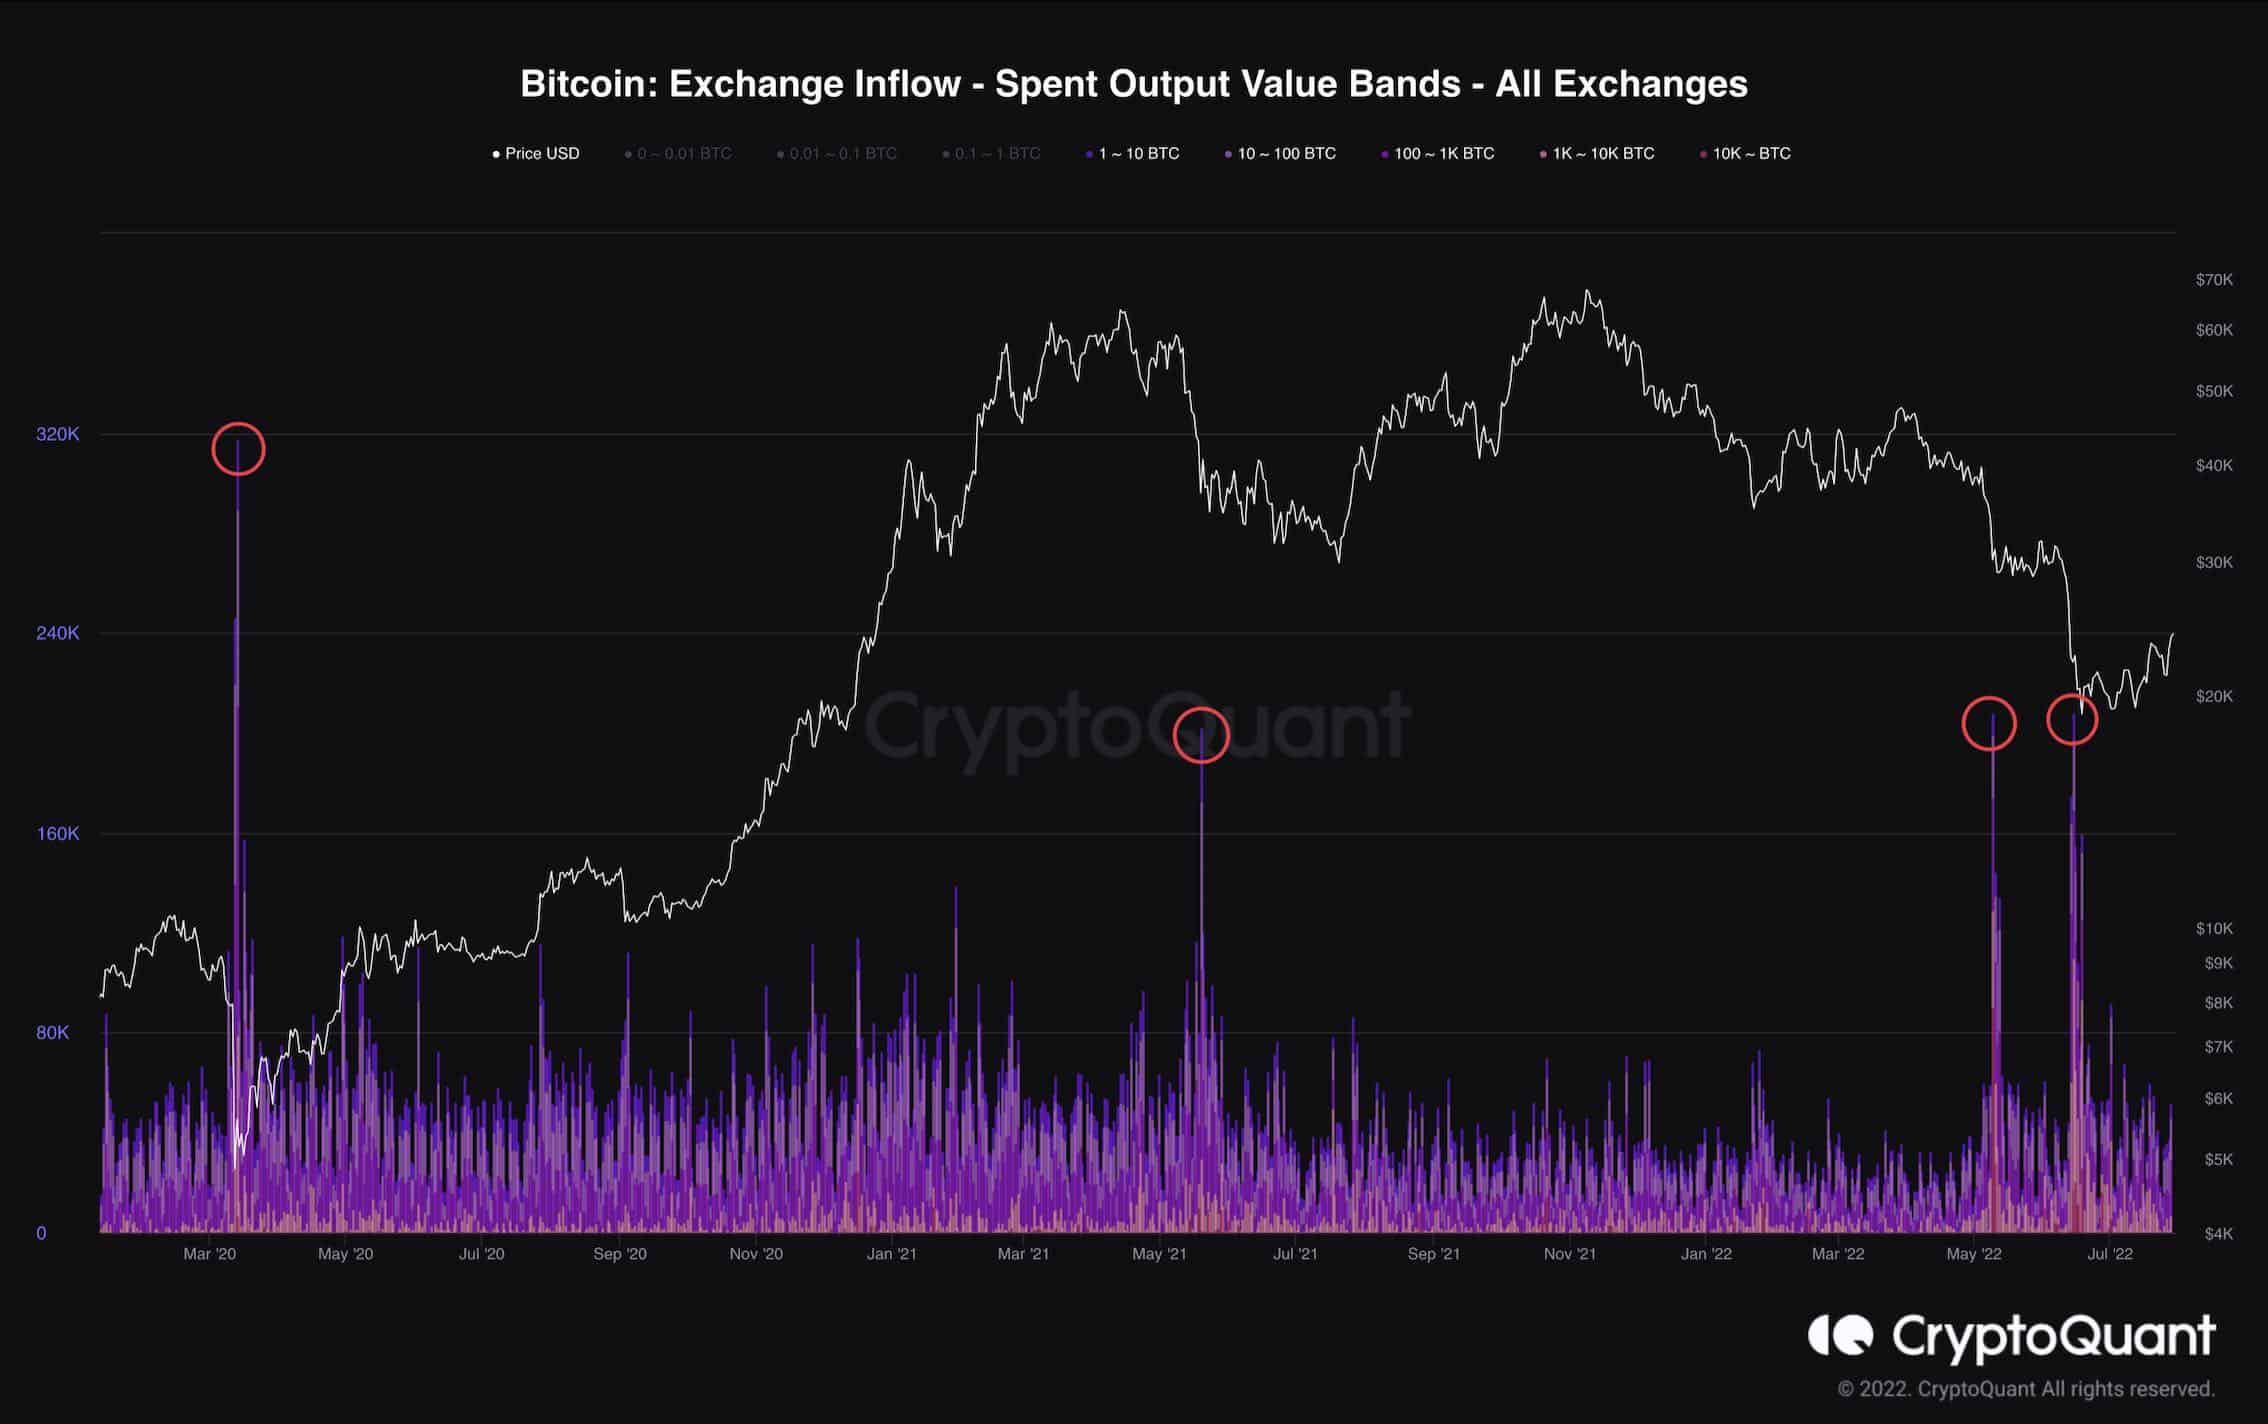
The interesting point is that the last couple of times in which this capitulation by larger entities happened was in March 2020 and May 2021, and both marked the bottom of the bearish trend. History may not repeat, and many other data indicate that Bitcoin could drop even lower, however, the bottom may be much closer than many market participants assume.
OhNoRipple via https://www.ohnocrypto.com/ @CryptoVizArt, @Khareem Sudlow