
Bitcoin Price Analysis: Here’s the Level BTC Need to Break to Escape from Danger Zone
Bitcoin’s price has been consolidating between the $20K and $23K over the last few weeks, following a massive crash from the $30K mark. So far, the price has been supported by the $17K-$20K range, which also contains the previous cycle’s ATH.
Technical Analysis
By Edris
The Daily Chart
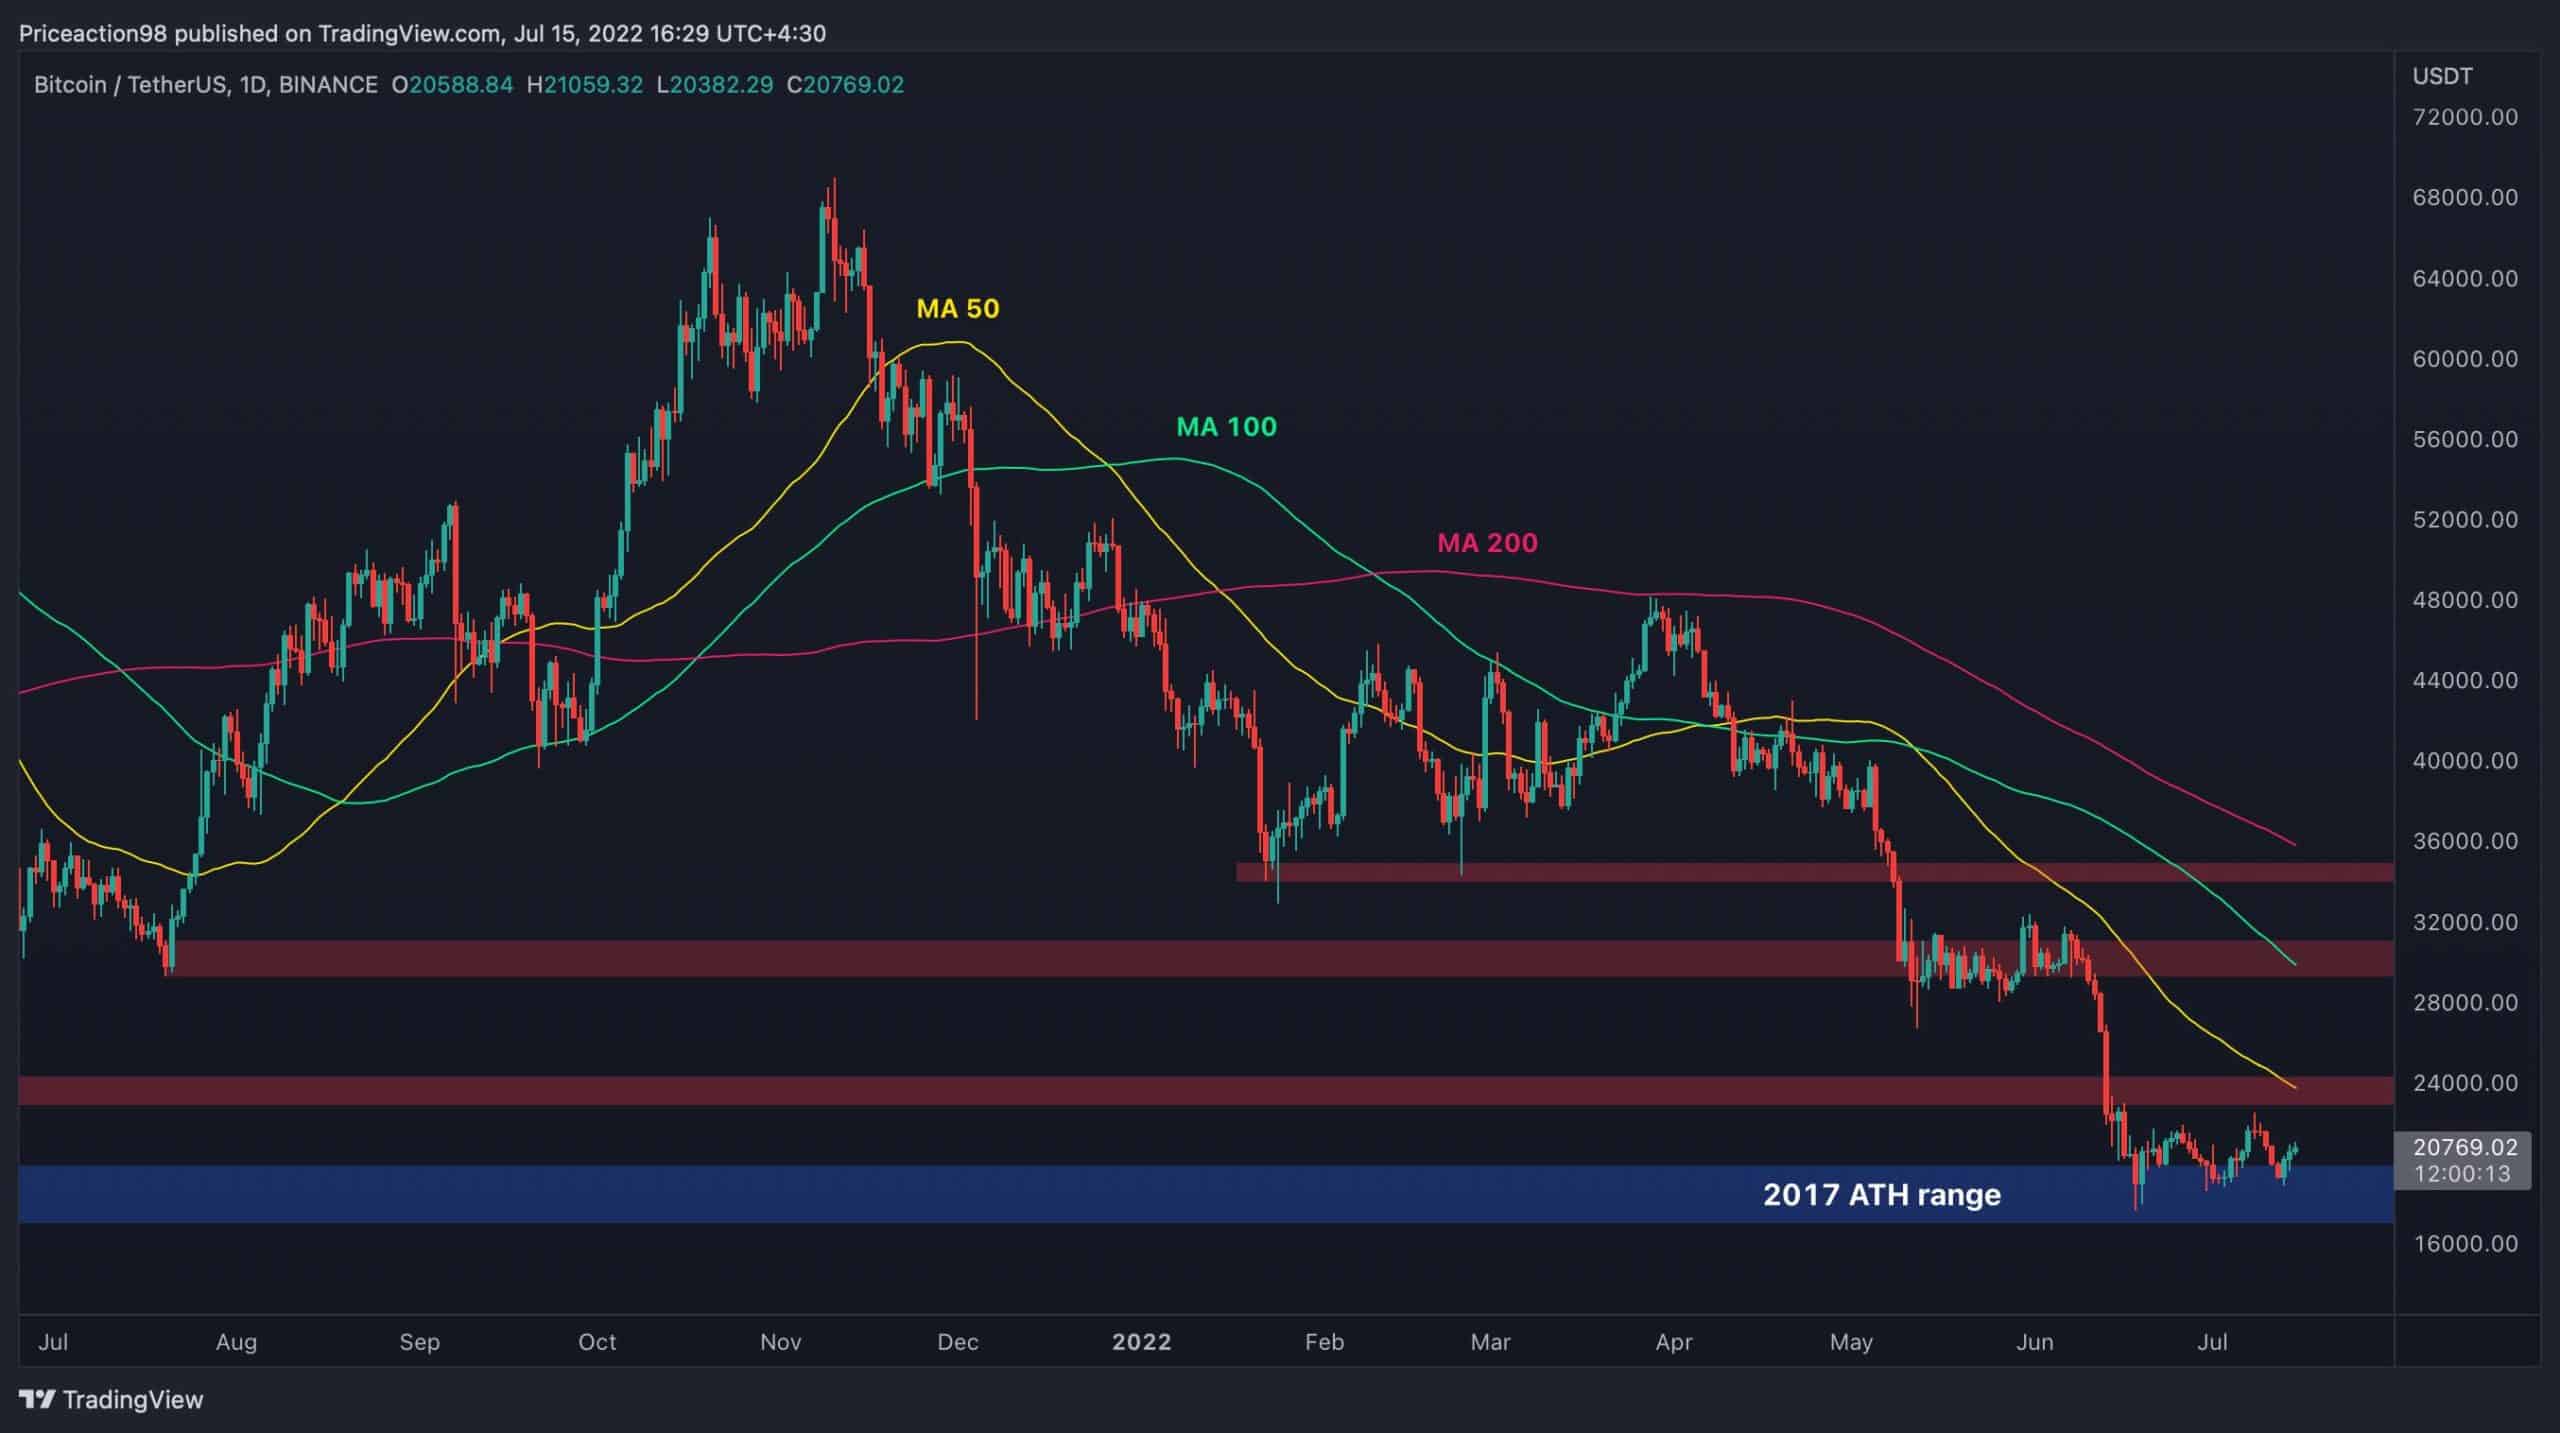
Bitcoin’s price has been consolidating between the $20K and $23K over the last few weeks, following a massive crash from the $30K mark. The price seems to be receiving serious support at the $17K-$20K. This level is very significant, and in case of a breakdown, the price could rapidly drop towards the $15K mark and even lower.
However, considering the current price action and the third rejection from this area, a run to the $24K resistance level and the 50-day moving average seems more likely. A bullish breakout from these levels would initiate a rally towards the $30K supply zone – a key level to which the price’s reaction would determine the mid-term trend of the market.
The 4-Hour Chart
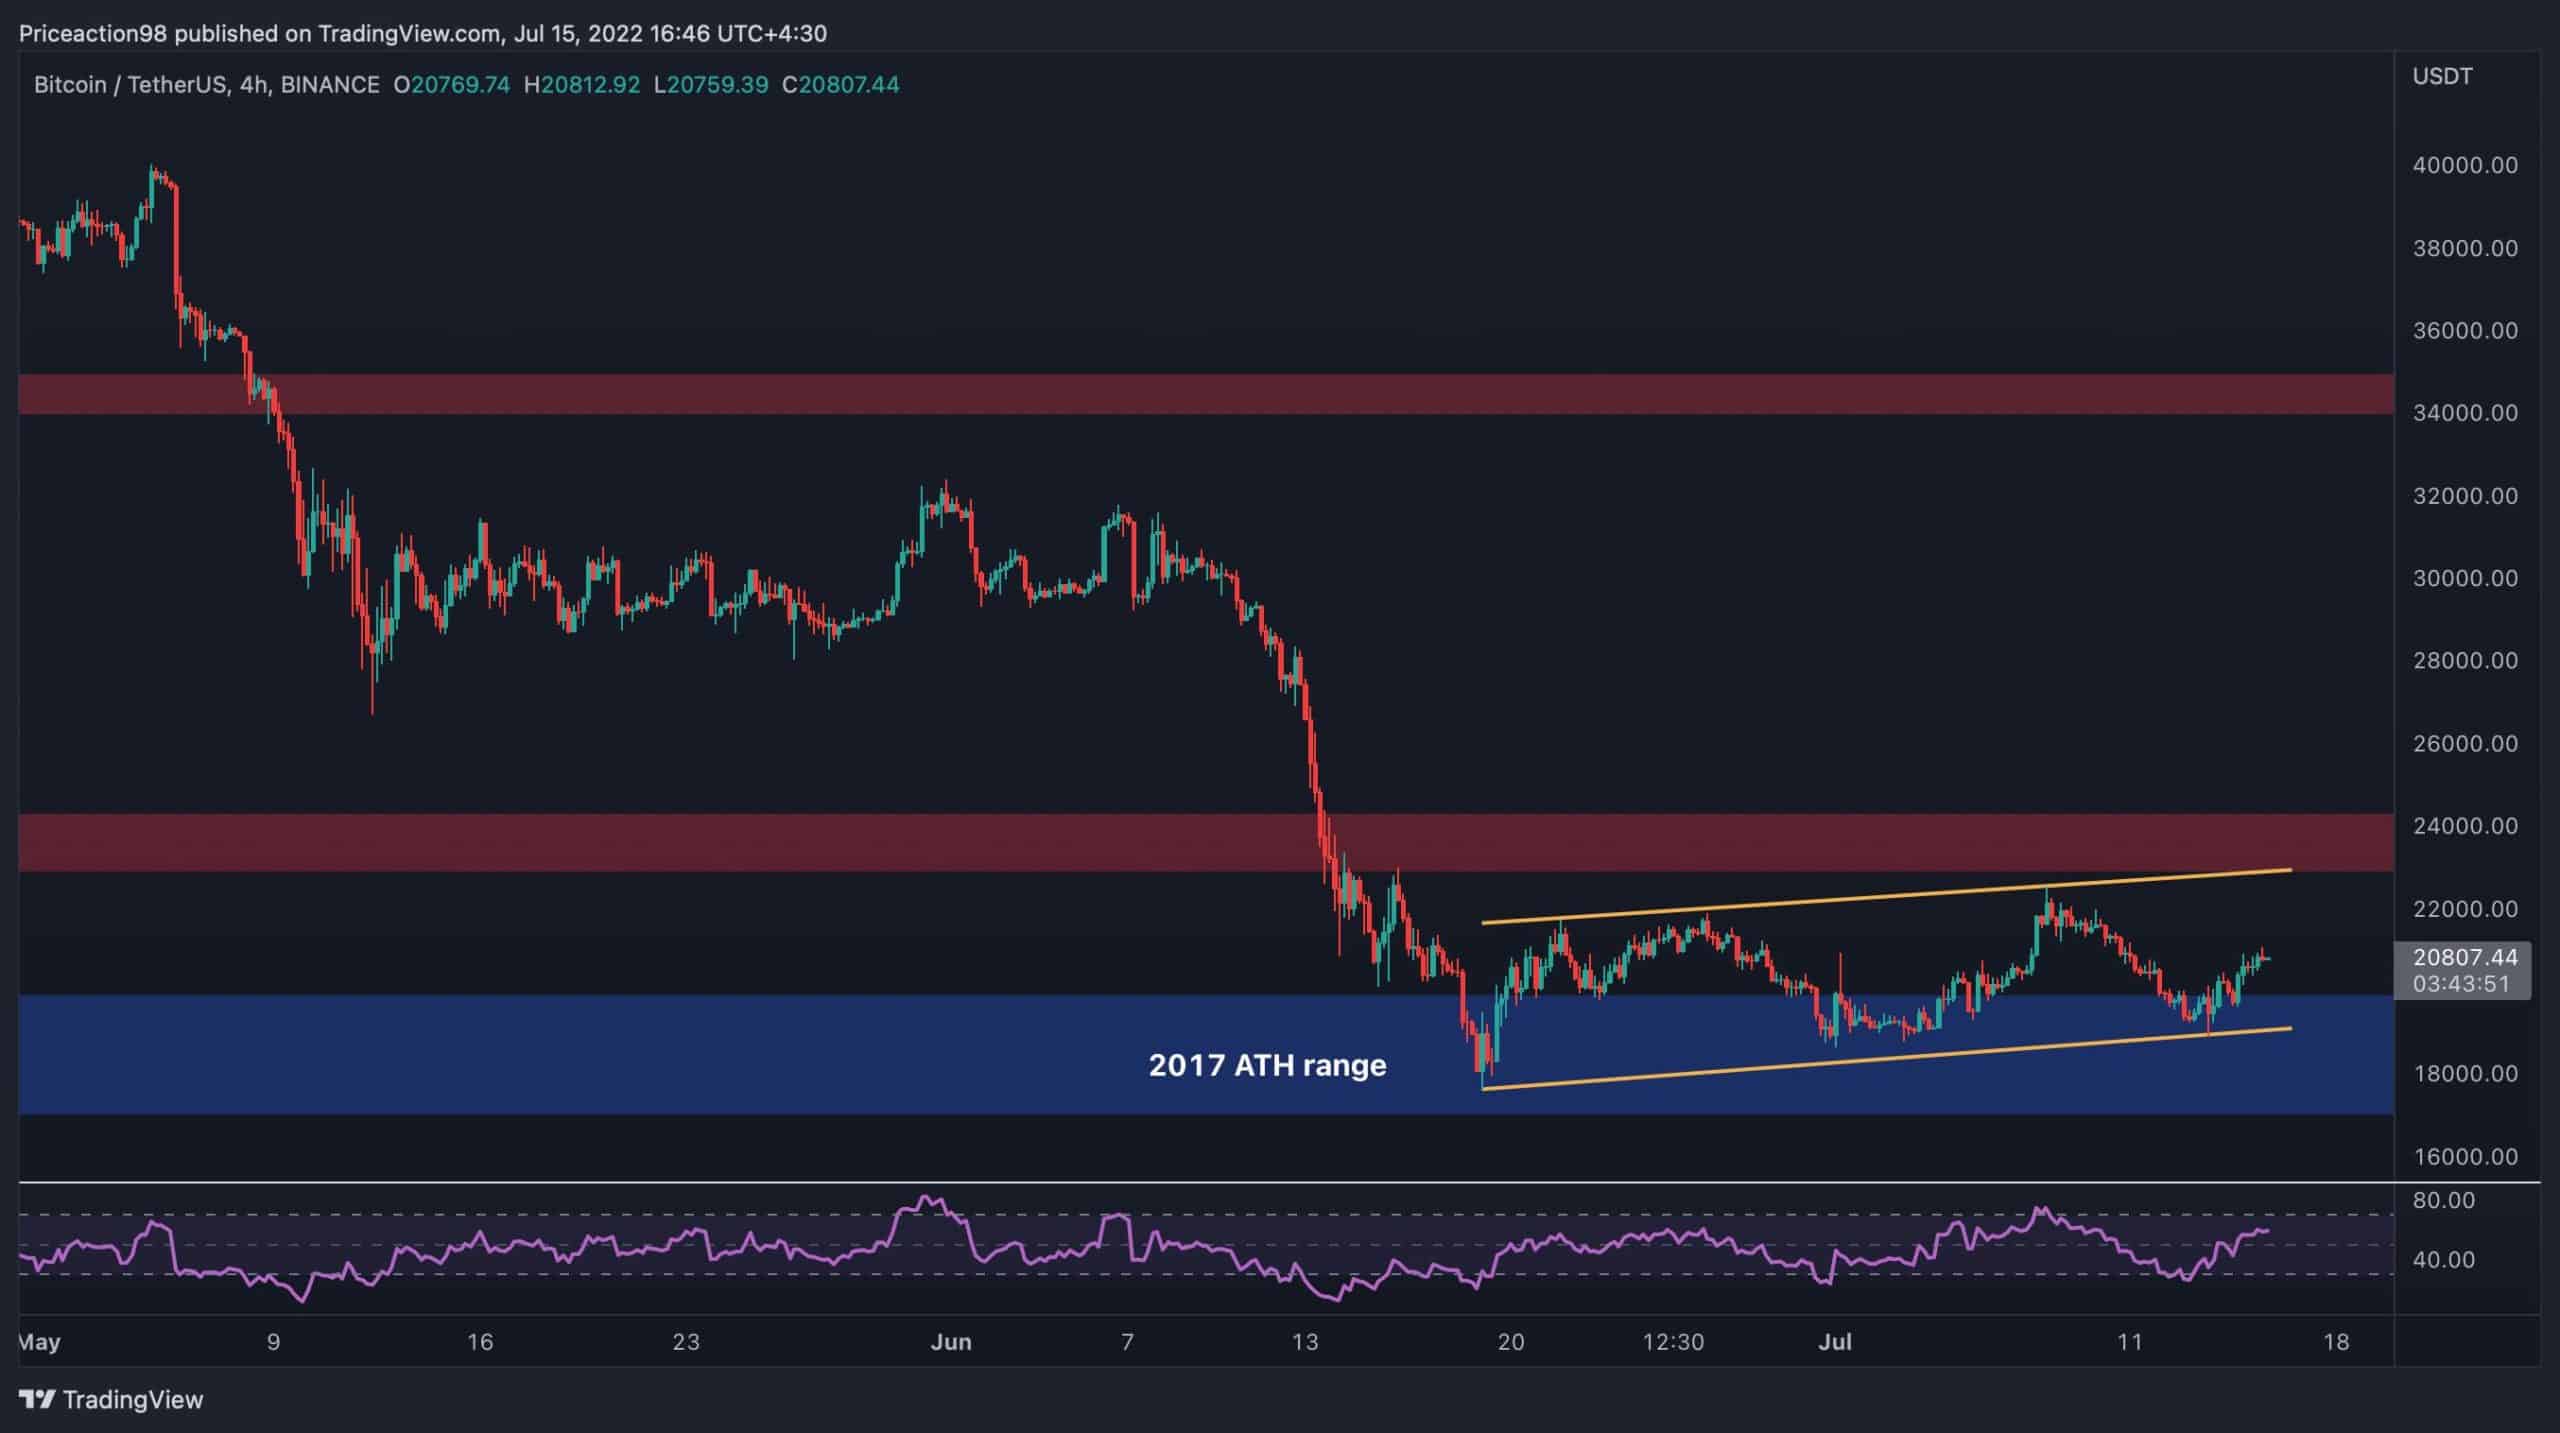
On the 4-hour timeframe, it is evident that the price is still bouncing inside a bearish flag after rebounding from the lower boundary of the pattern. Currently, the price is trending towards the $23-$24K area once again and could retest the higher trendline of the pattern. If the mentioned levels hold and reject the price once again, a bearish breakout from the flag and continuation of the downtrend would be expected.
The RSI indicator also hints at the relative dominance of the bulls, further boosting the probability of a move towards $23K. Overall, the formation of this bearish flag is pointing towards more downside in the short-term, unless it gets invalidated by the price breaking it to the upside.
Onchain Analysis
By Shayan
Analyzing the overall sentiment of market players helps in identifying current trends. A bullish cycle often ends when major participants enter t”e “distribution pha”e,” when they begin to sell their assets and realize their profits.
Retailers are supplying the demand side of the market while also experiencing FOMO. Conversely, a bearish cycle frequently concludes when significant players enter t”e “accumulation pha”e,” when they start purchasing coins from weak hands at a discount.
Small investors panic-sell their assets and suffer significant losses during this market period, known as t”e “Capitulation pha”e,” while the smart money accumulates.
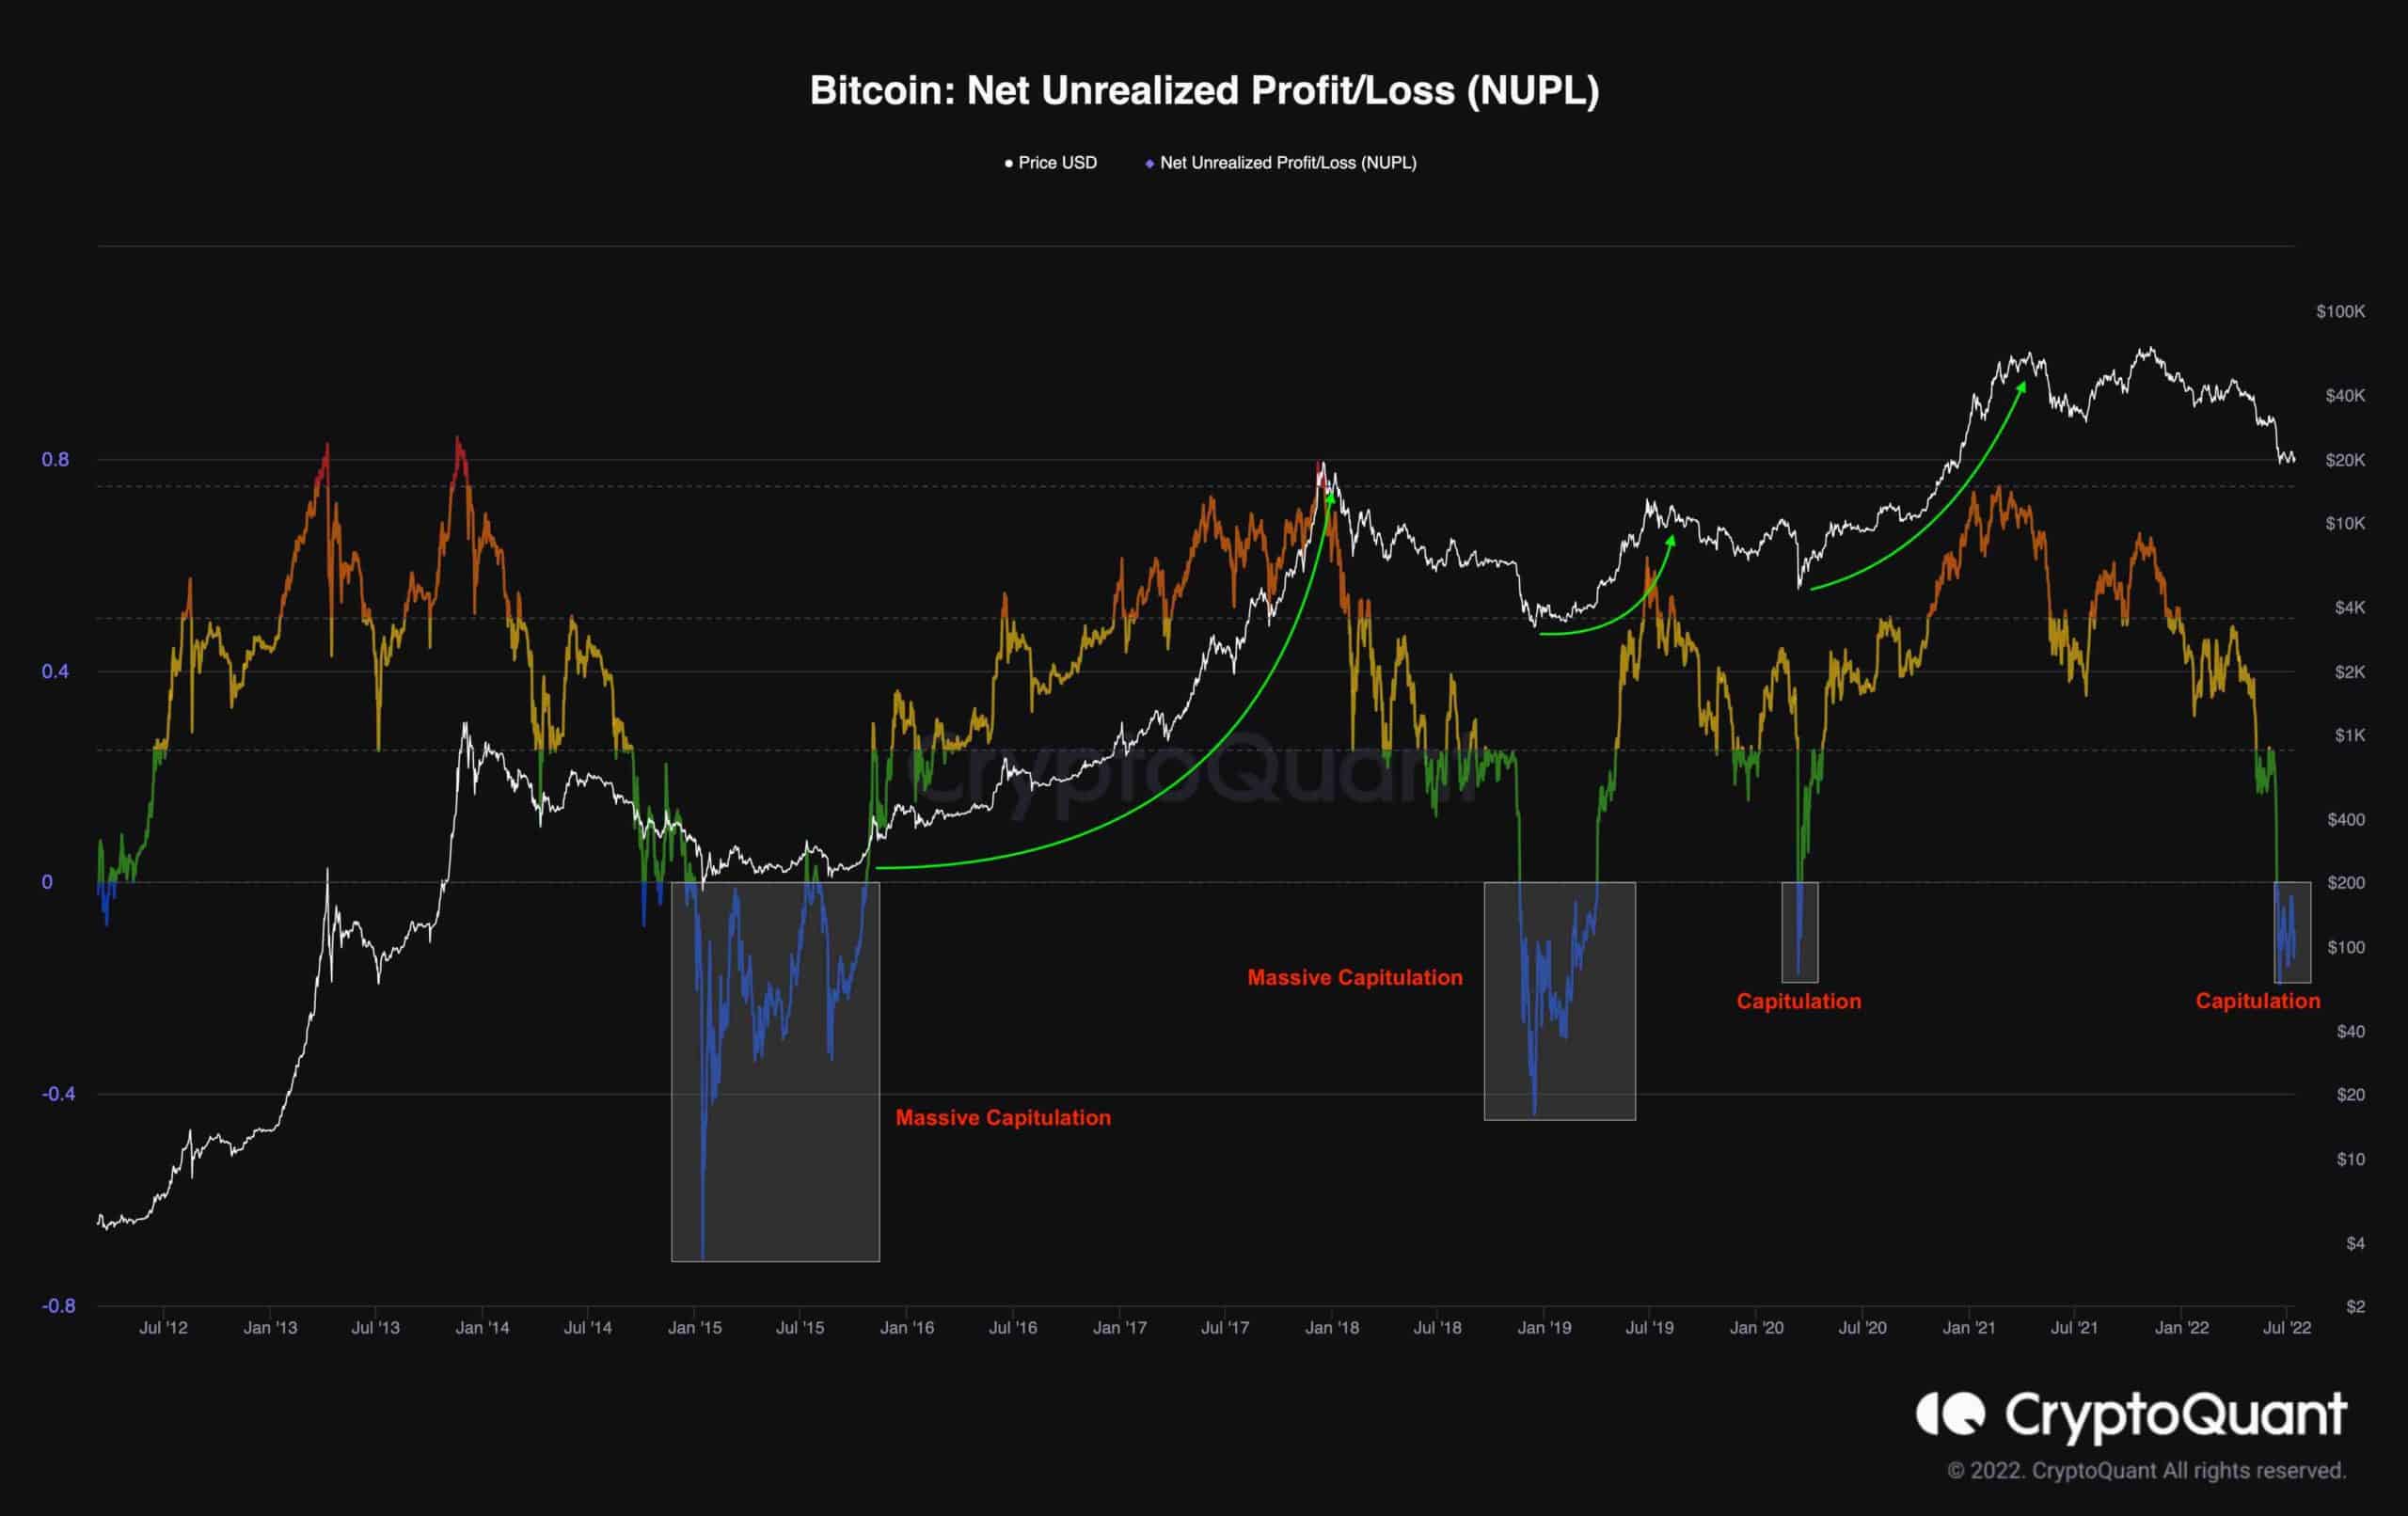
The figure displays the NUPL metric, representing the overall profit/loss ratio. The measure has dropped to the blue range (= -0.09) due to a massive decline Bitcoin’sn’s price below $20K for the first time since the Covid meltdown. When this measure enters the blue region, the market has historically seen significant surrender resulting in a new bullish rally.
OhNoRipple via https://www.ohnocrypto.com/ @CryptoVizArt, @Khareem Sudlow