
After Losing $20K, is $15,000 the Next Target for BTC Bears? (Bitcoin Price Analysis)
There are no signs of strength or rebound in Bitcoin’s price while the cryptocurrency has been experiencing choppy price action with low overall volatility (with certain exceptions). The price is slowly decreasing to retest the demand zone at $18K after a short-term rally towards the $21K mark. Additionally, this zone aligns with the 2017 peak and offers psychological support.
Technical Analysis
By Shayan
The Daily Chart
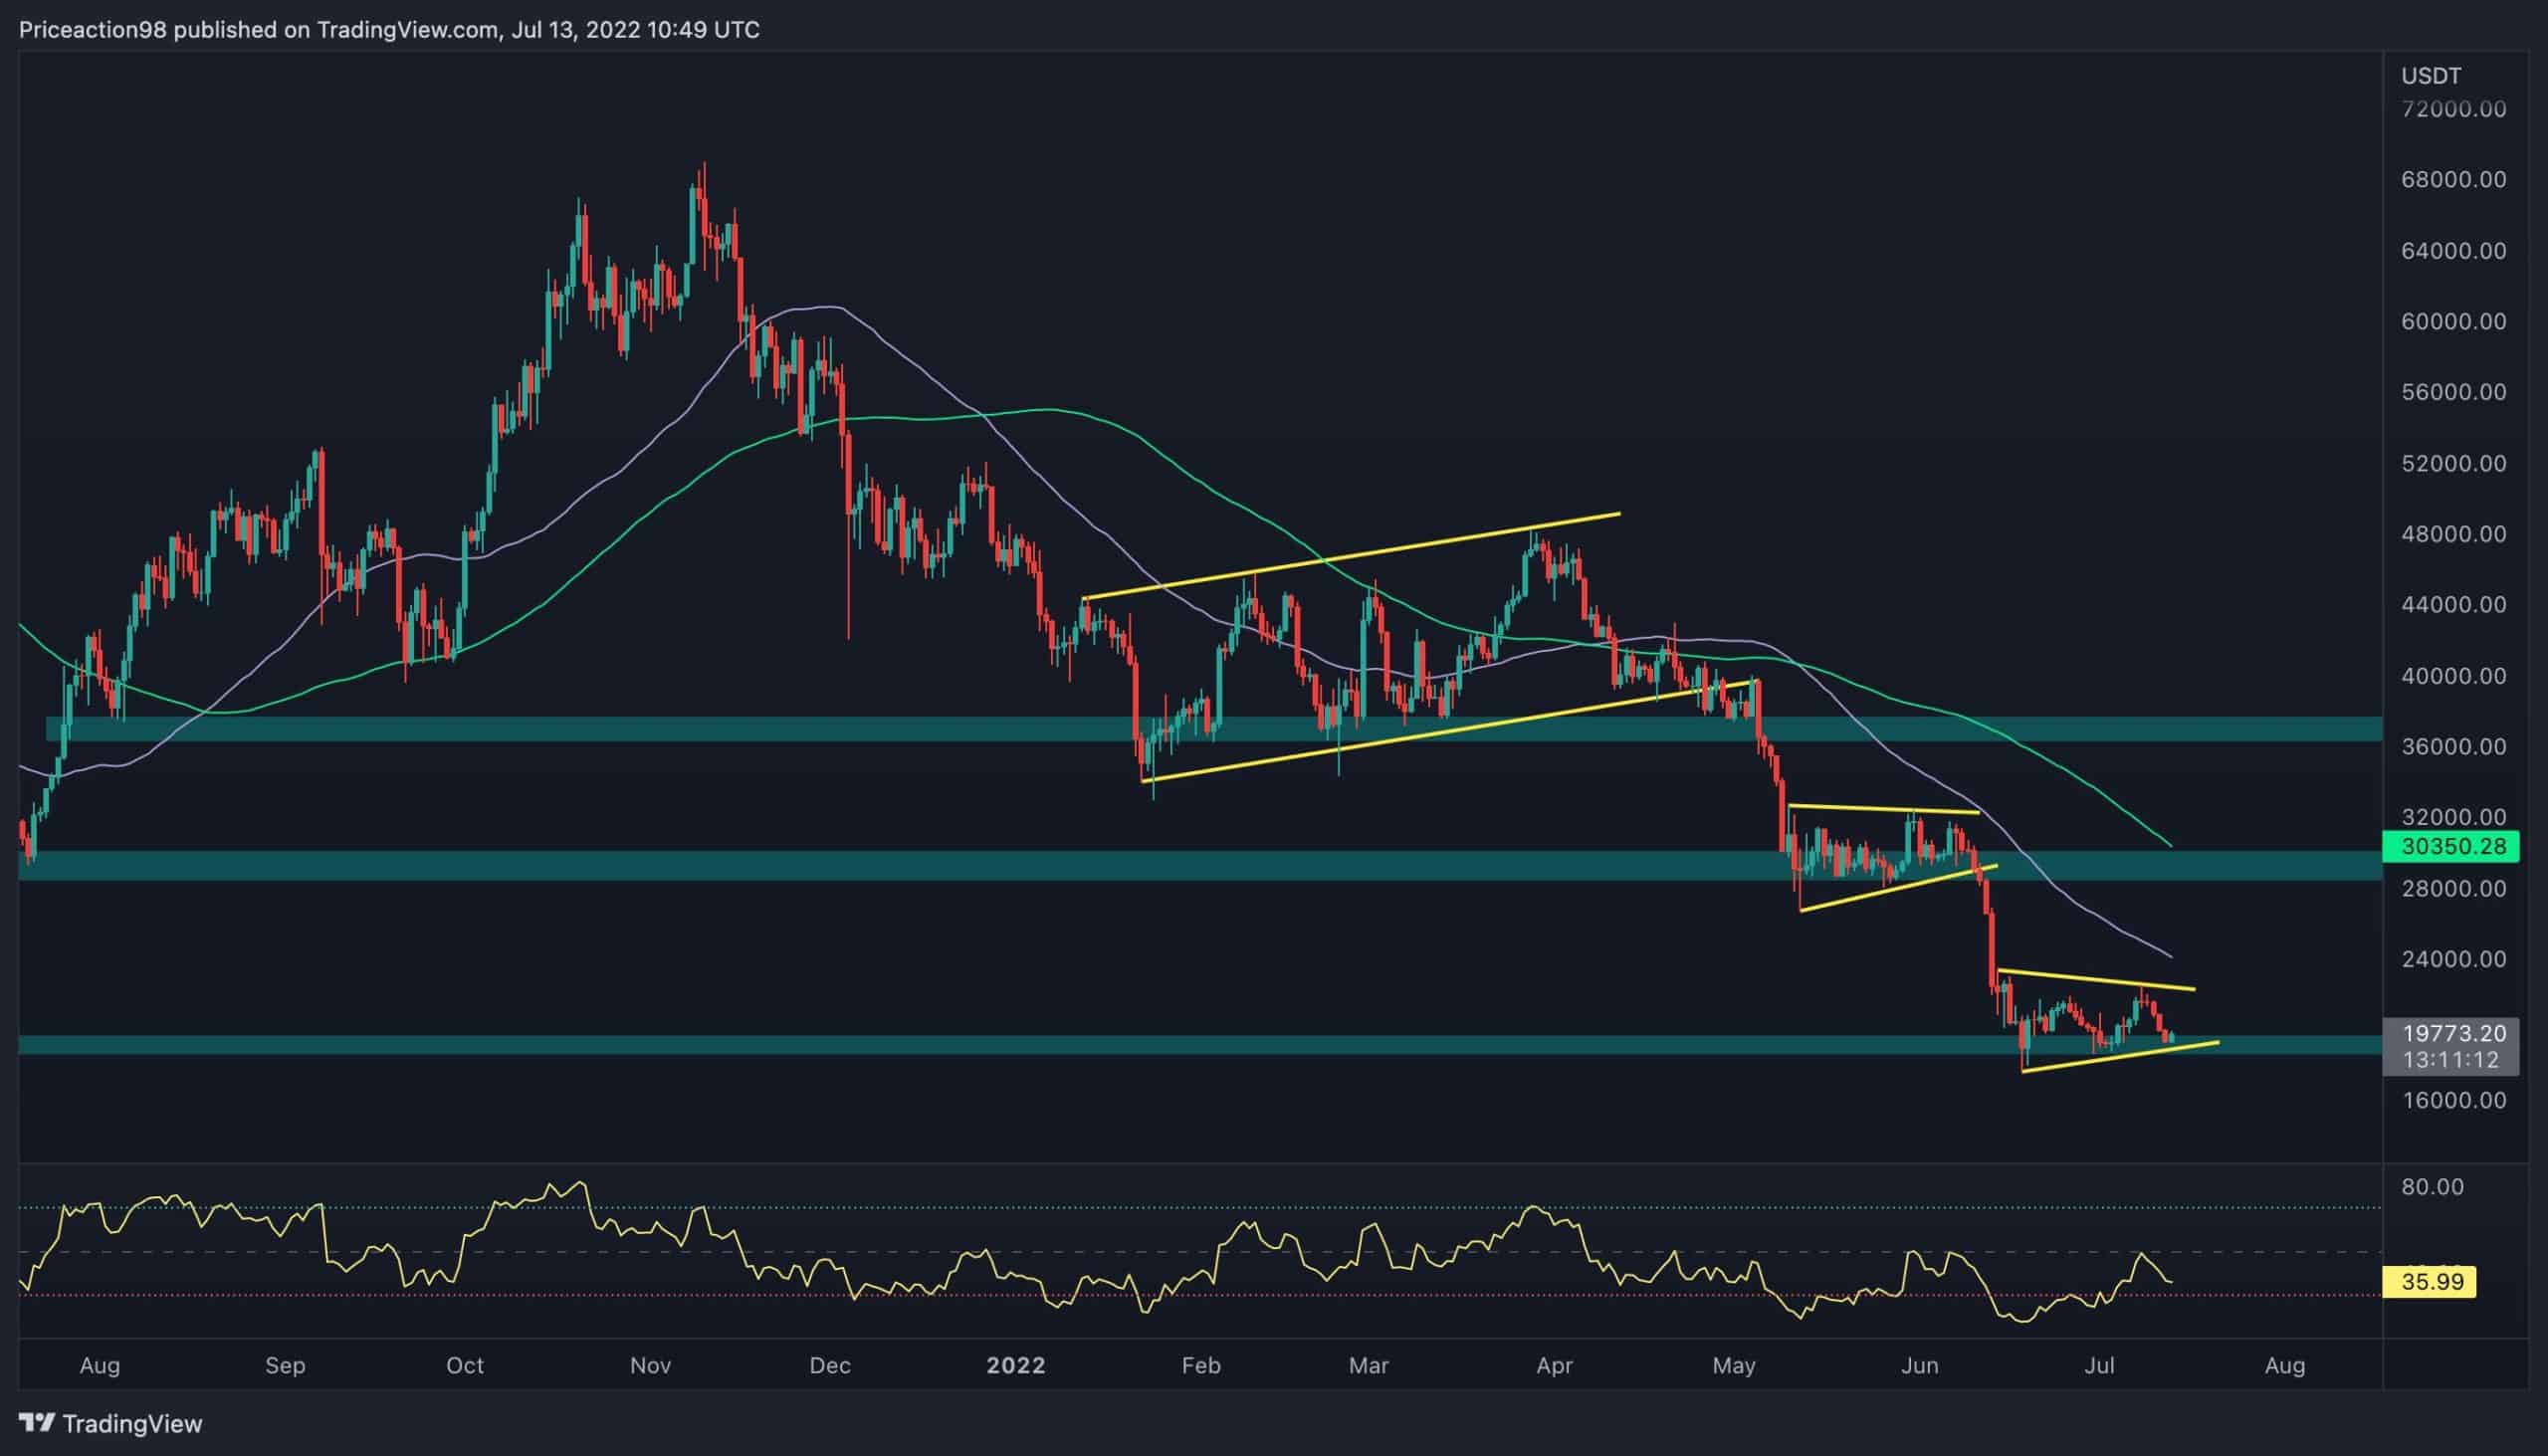
On the other hand, as mentioned in our previous analysis, an expansion move is always accompanied by short- to mid-term consolidation and correction patterns. As is evident in the following chart, the price has always formed a correction pattern after each expansion move. After a steep decline, BTC is forming a continuation correction pattern and is attempting to break it to the downside. Hence, a bearish scenario followed by a cascade to the $13K-$15K region seems like a real probability.
Nevertheless, the 50-day and 100-day moving averages alongside the $30K level are the main obstacles in Bitcoin’s path to reverse the bearish trend and initiating the next major bull run.
The 4-Hour Chart
Bitcoin has been plummeting inside a sharp descending channel and consolidating after testing the lower boundary for the third time. During the consolidation phase, the price has formed a well-known continuation pattern called a ‘wedge’ and reached the lower trendline.
It’s important to note that the wedge could turn into a continuation or a reversal pattern, depending on whether the price breaks to the upside or the downside. Hence, if the trendline fails to support the price, a new short-term rally towards the $16K mark would be possible. In contrast, if the mentioned trendline supports the price, Bitcoin’s next destination will be the channel’s upper boundary and the $22K significant resistance level.
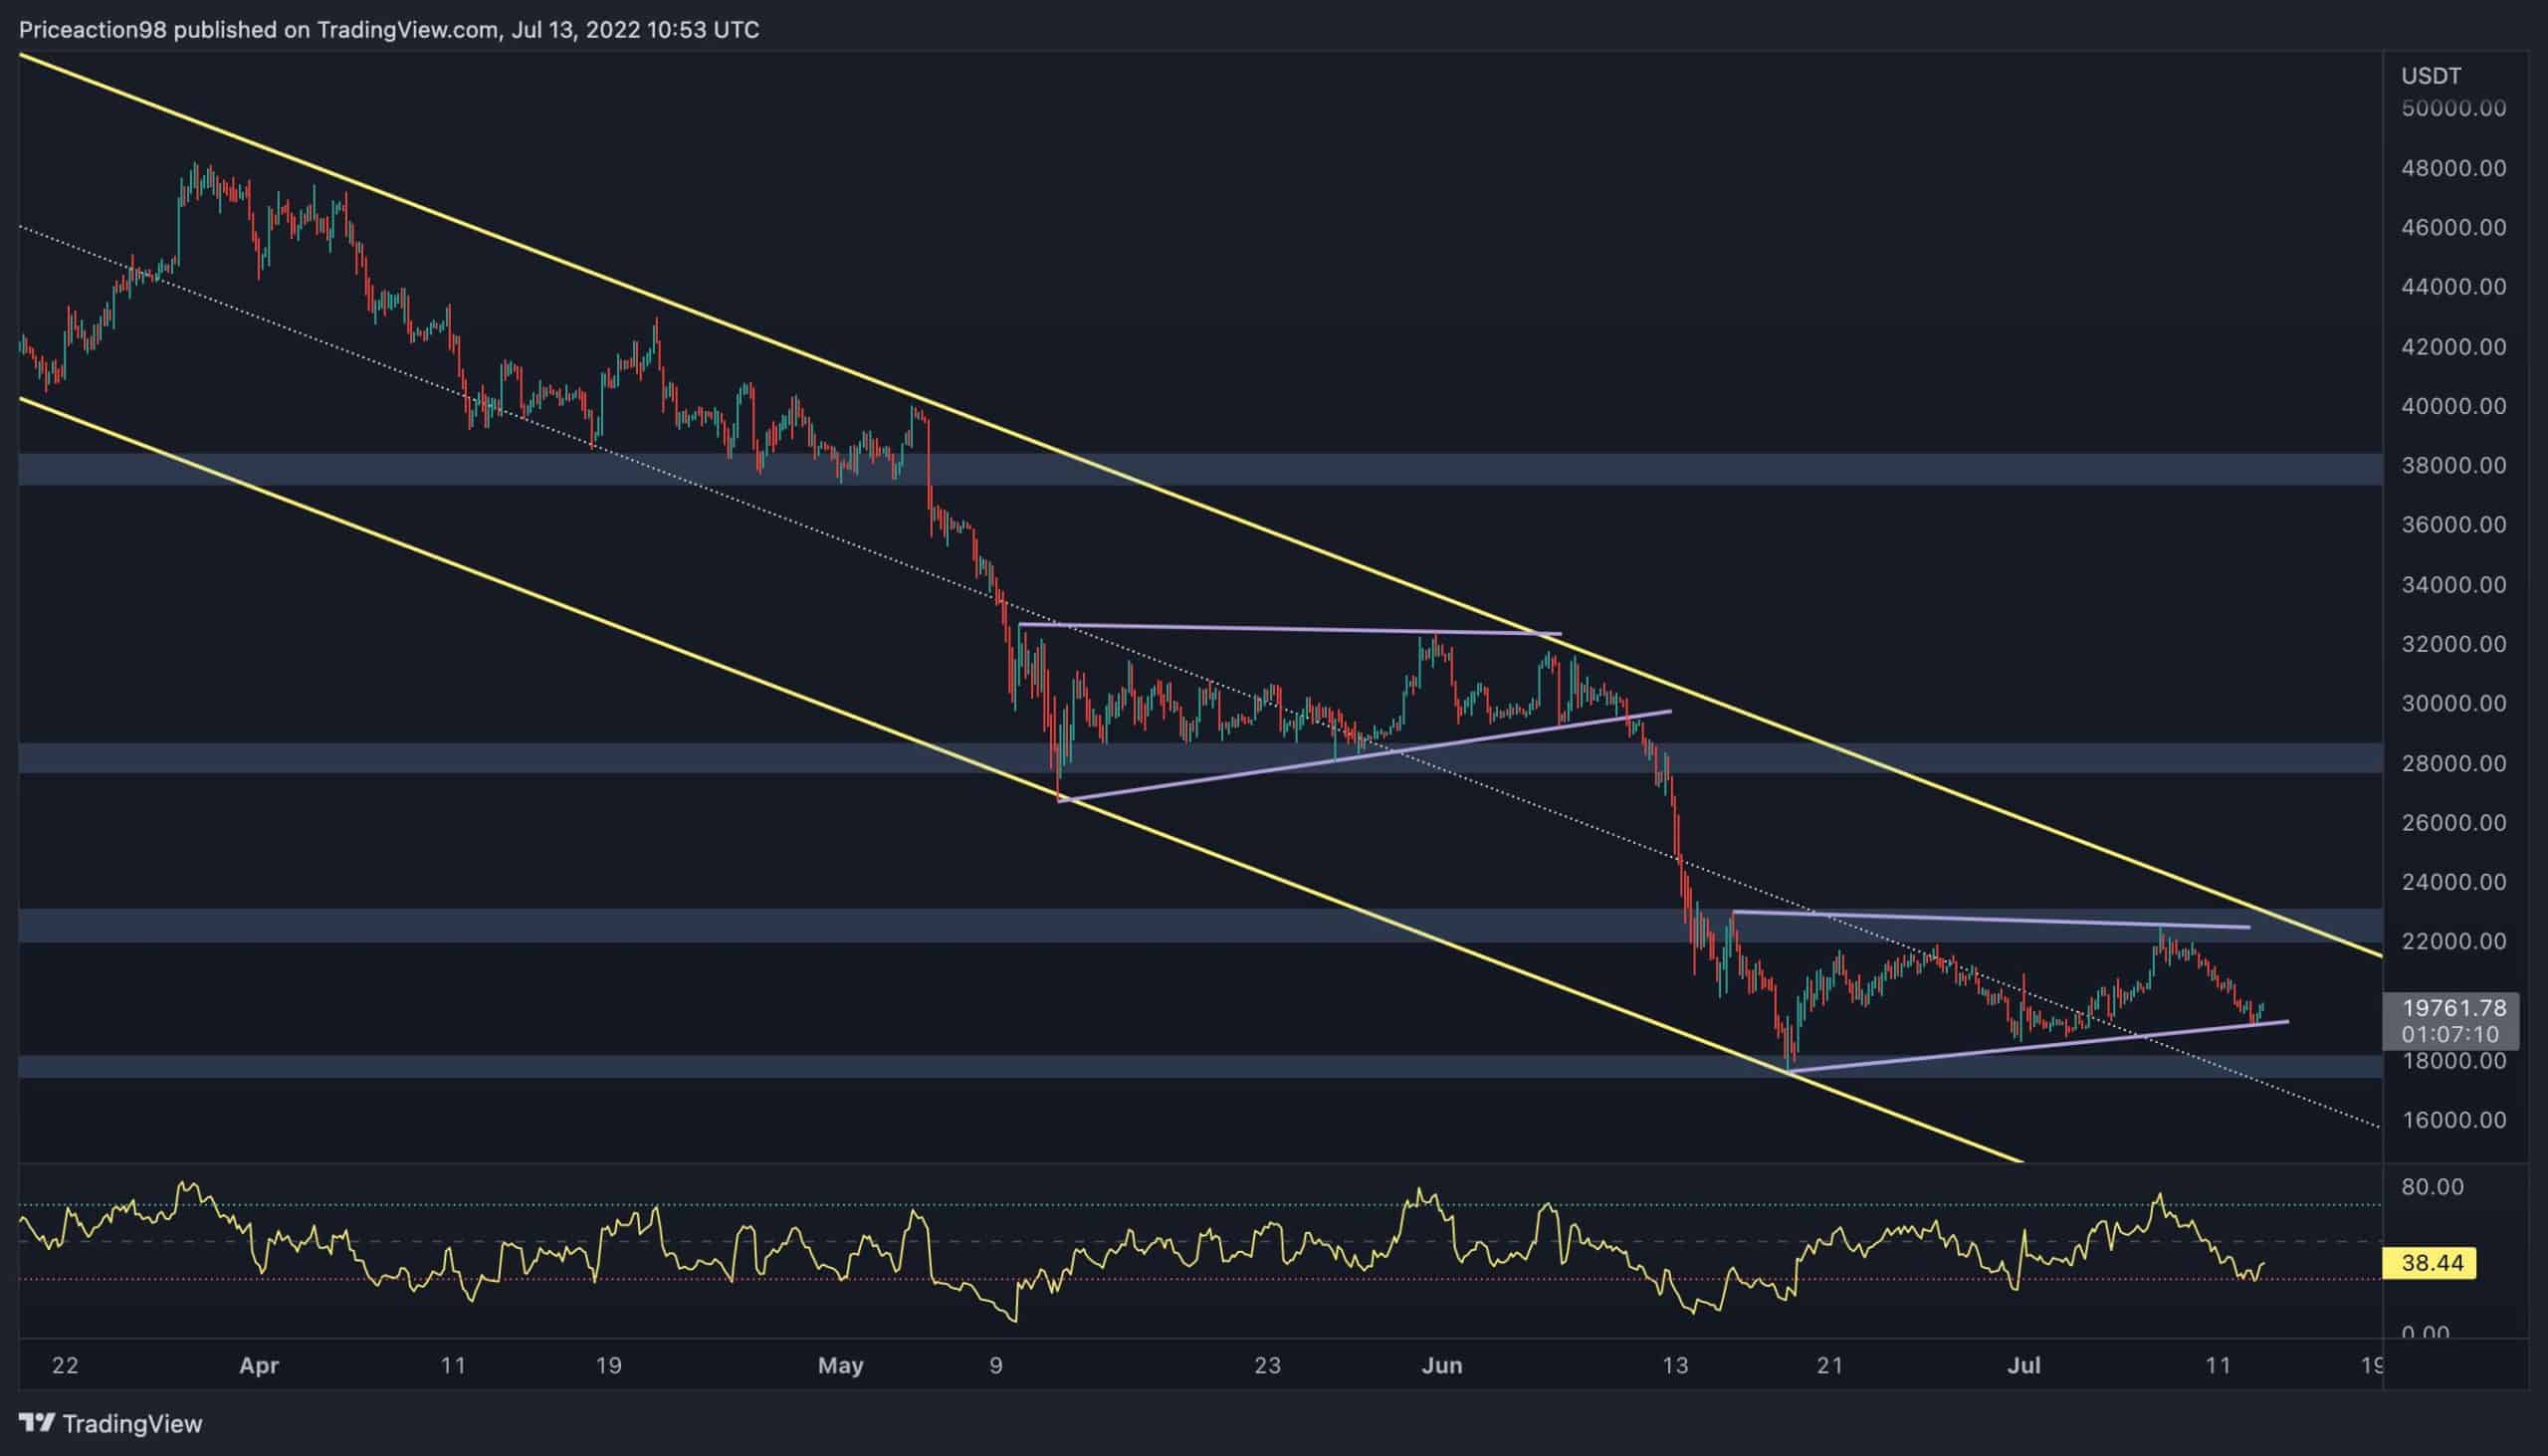
Given the overall financial markets’ condition and the current bearish sentiment in the crypto market, a lengthy consolidation followed by a new bearish rally seems like the most probable scenario for Bitcoin.
On-chain Analysis
By Edris
Bitcoin Exchange Whale Ratio
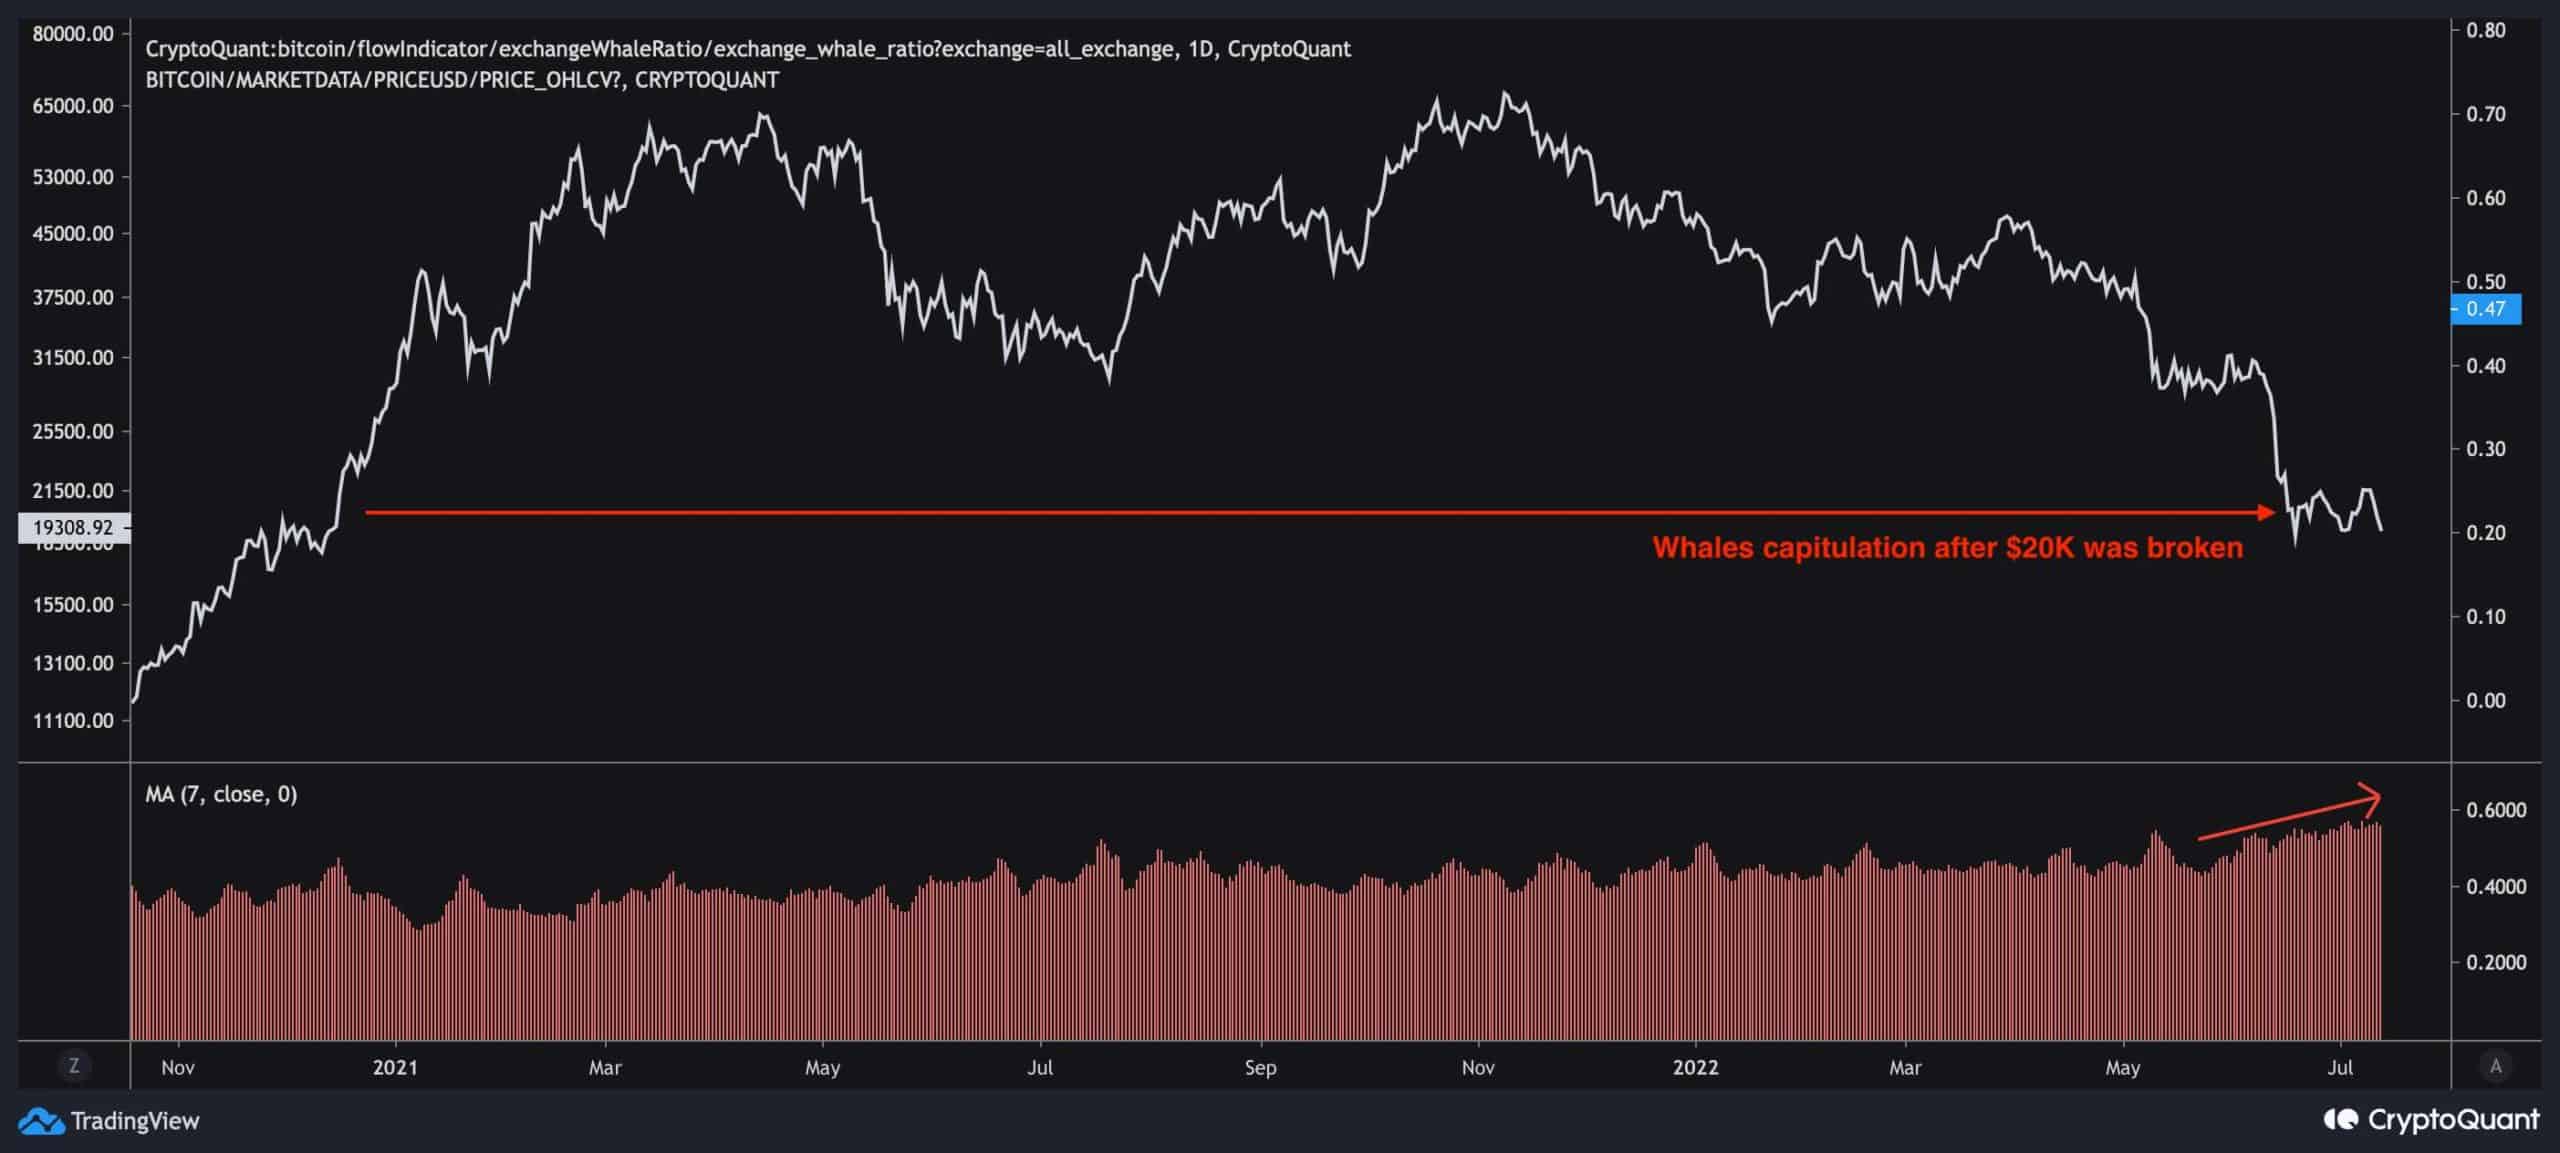
The last phase of a bear market is where even the strongest of hands begin to panic and sell their undervalued coins to exit the market as soon as possible. Whales, who are investors with huge capital and are one of the stronger hands in the Bitcoin market, have recently entered the drawdown region, as the market has dropped below their realized price and the significant $20K level.
This means that many of these large entities are now holding their coins at a loss, forcing some of them to sell before a bigger loss is inflicted on their portfolios. The Exchange Whale Ratio metric – a useful tool for tracking Whales’ behavior, is showing a massive rise over the past few weeks, indicating a substantial increase in Bitcoin deposits to exchanges by whales.
It seems like many of them have reached their risk threshold and are offloading their Bitcoin at these price levels. This selling pressure and rise in supply might cause another drop in the short term. However, as mentioned at the beginning of the analysis, it also means that the bottom could be close, as Bitcoin seems to have entered the final stage of the bear market. Although, the geopolitical and macroeconomic conditions worldwide should also be monitored in the coming weeks and months to predict the formation of a bottom more precisely.
OhNoRipple via https://www.ohnocrypto.com/ @CryptoVizArt, @Khareem Sudlow