
A Move To $2K or an Imminent Correction for ETH? (Ethereum Price Analysis)
Ethereum started a rally after breaking above $1000 and gained 50% in six days. Largely propelled by the Merge anticipated in September, many are calling for the $2K price target, although there is serious resistance before that.
Technical Analysis
By Grizzly
The Daily Chart
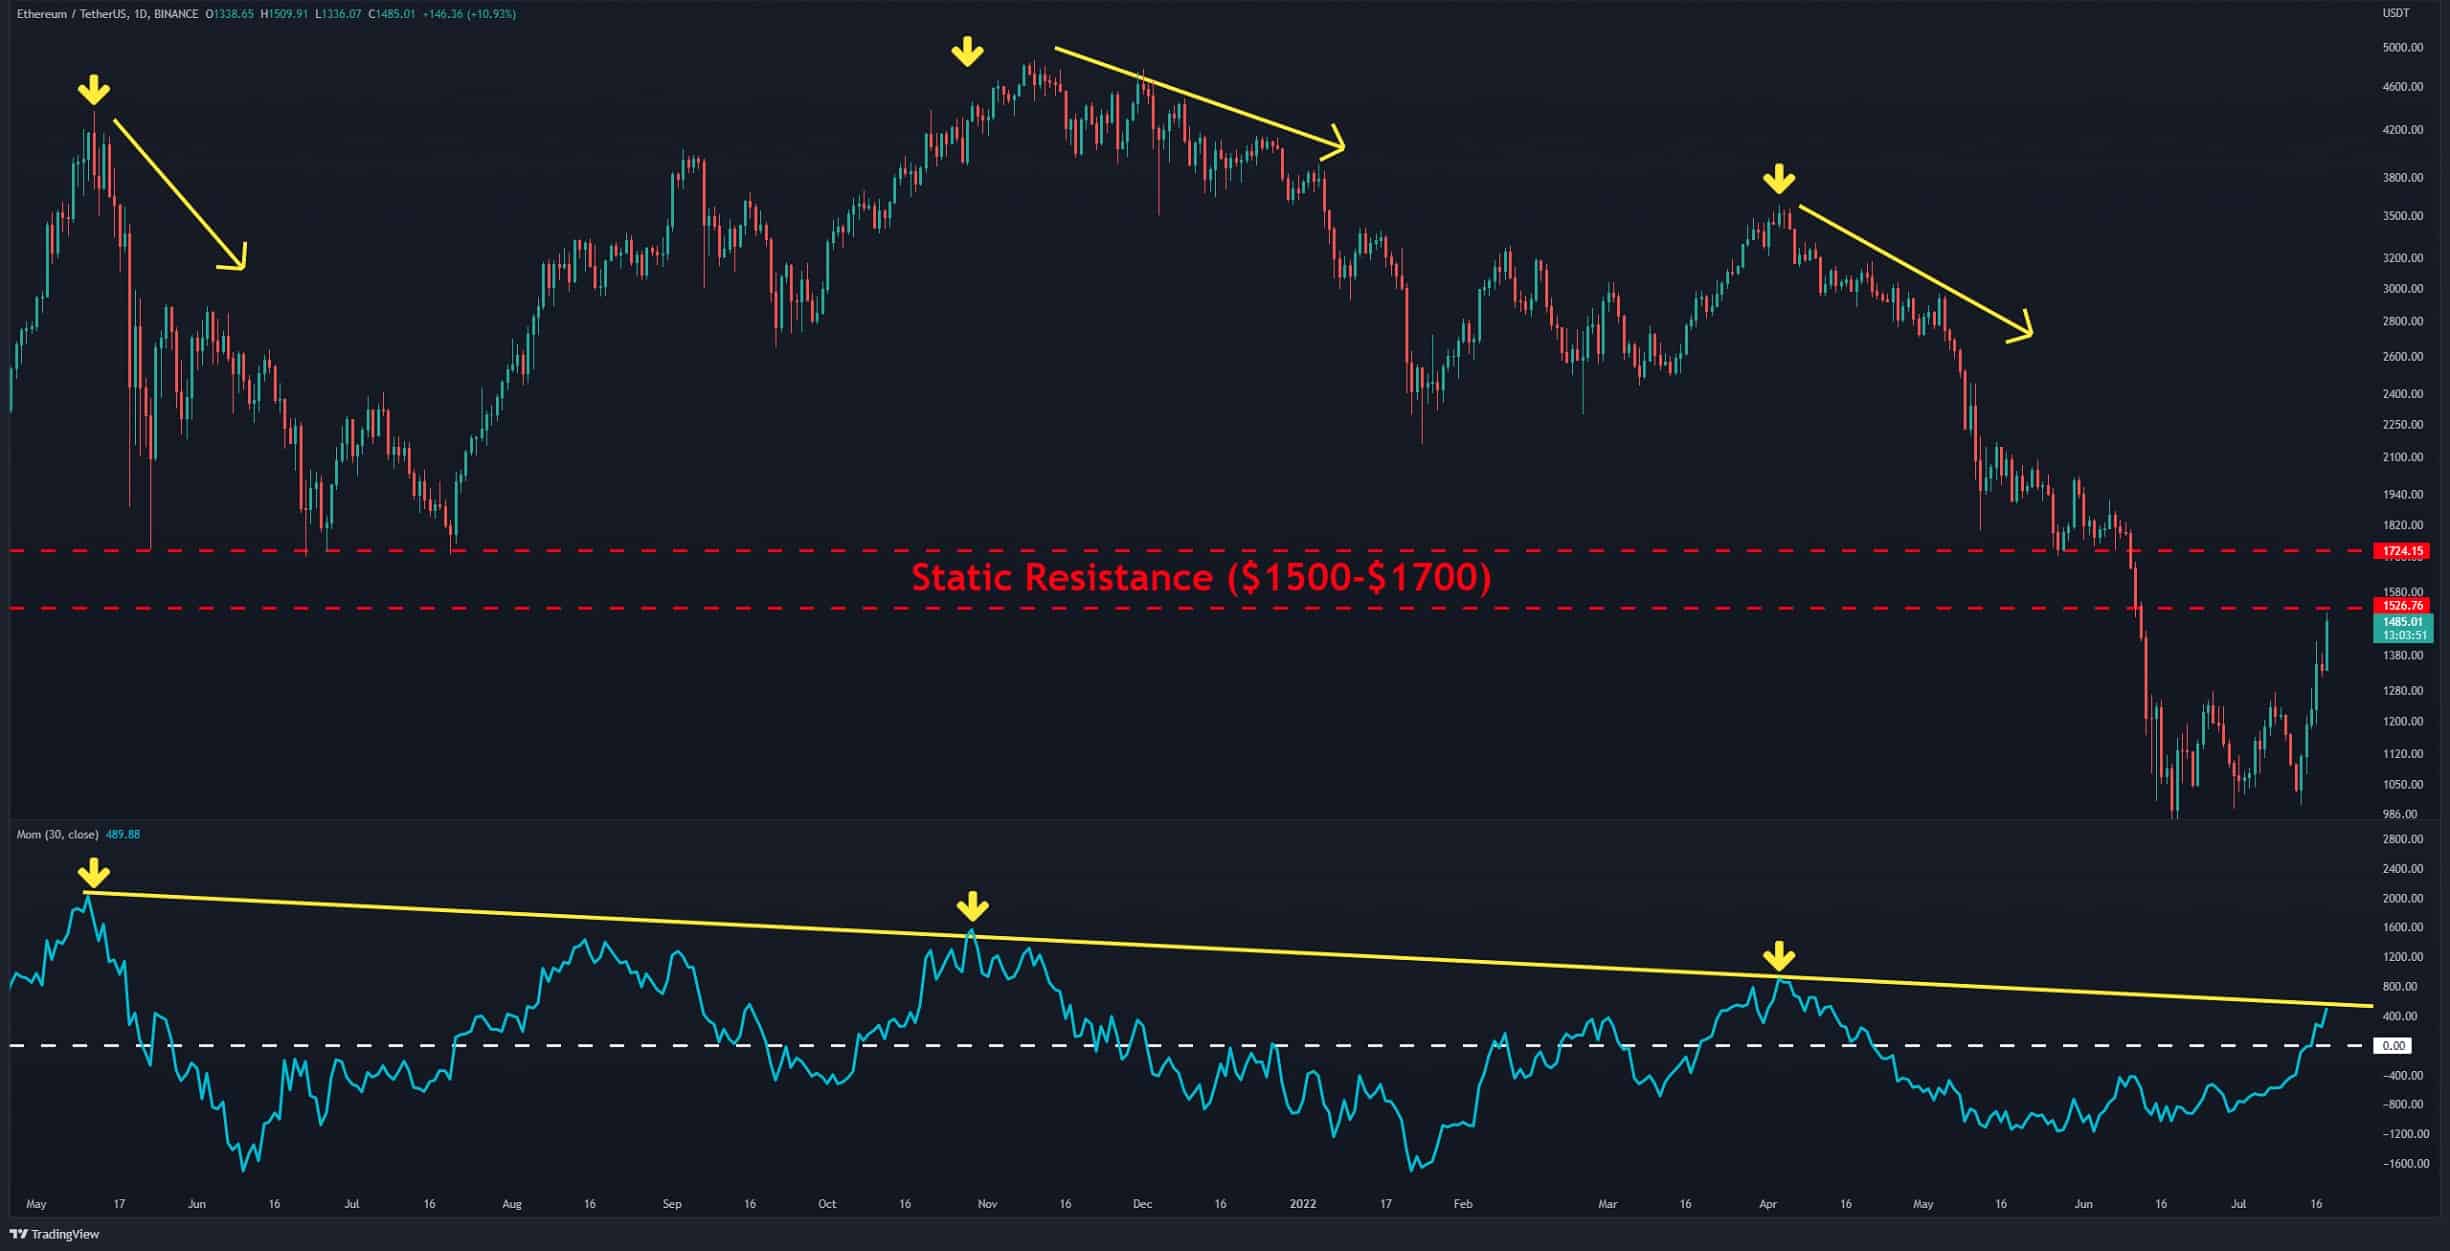
On a daily time frame, the bulls took another step closer to reclaiming $2,000. ETH was able to recover above $1280 and break out of the sideways trend after a month. However, it’s important to note that the positive divergence in the Momentum indicator also caused the index to break the baseline. So far, whenever it hit the descending line (in yellow) – over the past three occasions – the market had dropped aggressively. Currently, the Momentum has touched the yellow line, and if it can break above it, the bullish sentiment will likely increase further.
The bulls have no choice but to break above the resistance zone at $1,500-1,700 (in red) to develop a sustainable positive trend in the market. If successful, this may even propel ETH to $2,000 and perhaps even confirm a mid-term trend reversal.
Key Support Levels: $1280 & $1000
Key Resistance Levels: $1500 & $1700
Daily Moving Averages:
MA20: $1176
MA50: $1335
MA100: $1933
MA200: $2456
The ETH/BTC Chart
ETH performed better than BTC this week and achieved an upside breakout from the monthly consolidation phase. The price has now touched the 200-day moving average line (in white) after breaking the horizontal resistance at 0.065 BTC (in yellow).
The structure is entirely bullish as far as the buyers hold the price above 0.065 BTC. Presently, ETH seems to need more momentum to break above the MA200. Therefore, any correction towards 0.065, which is a chance to gain the required momentum, is healthy.

Sentiment Analysis
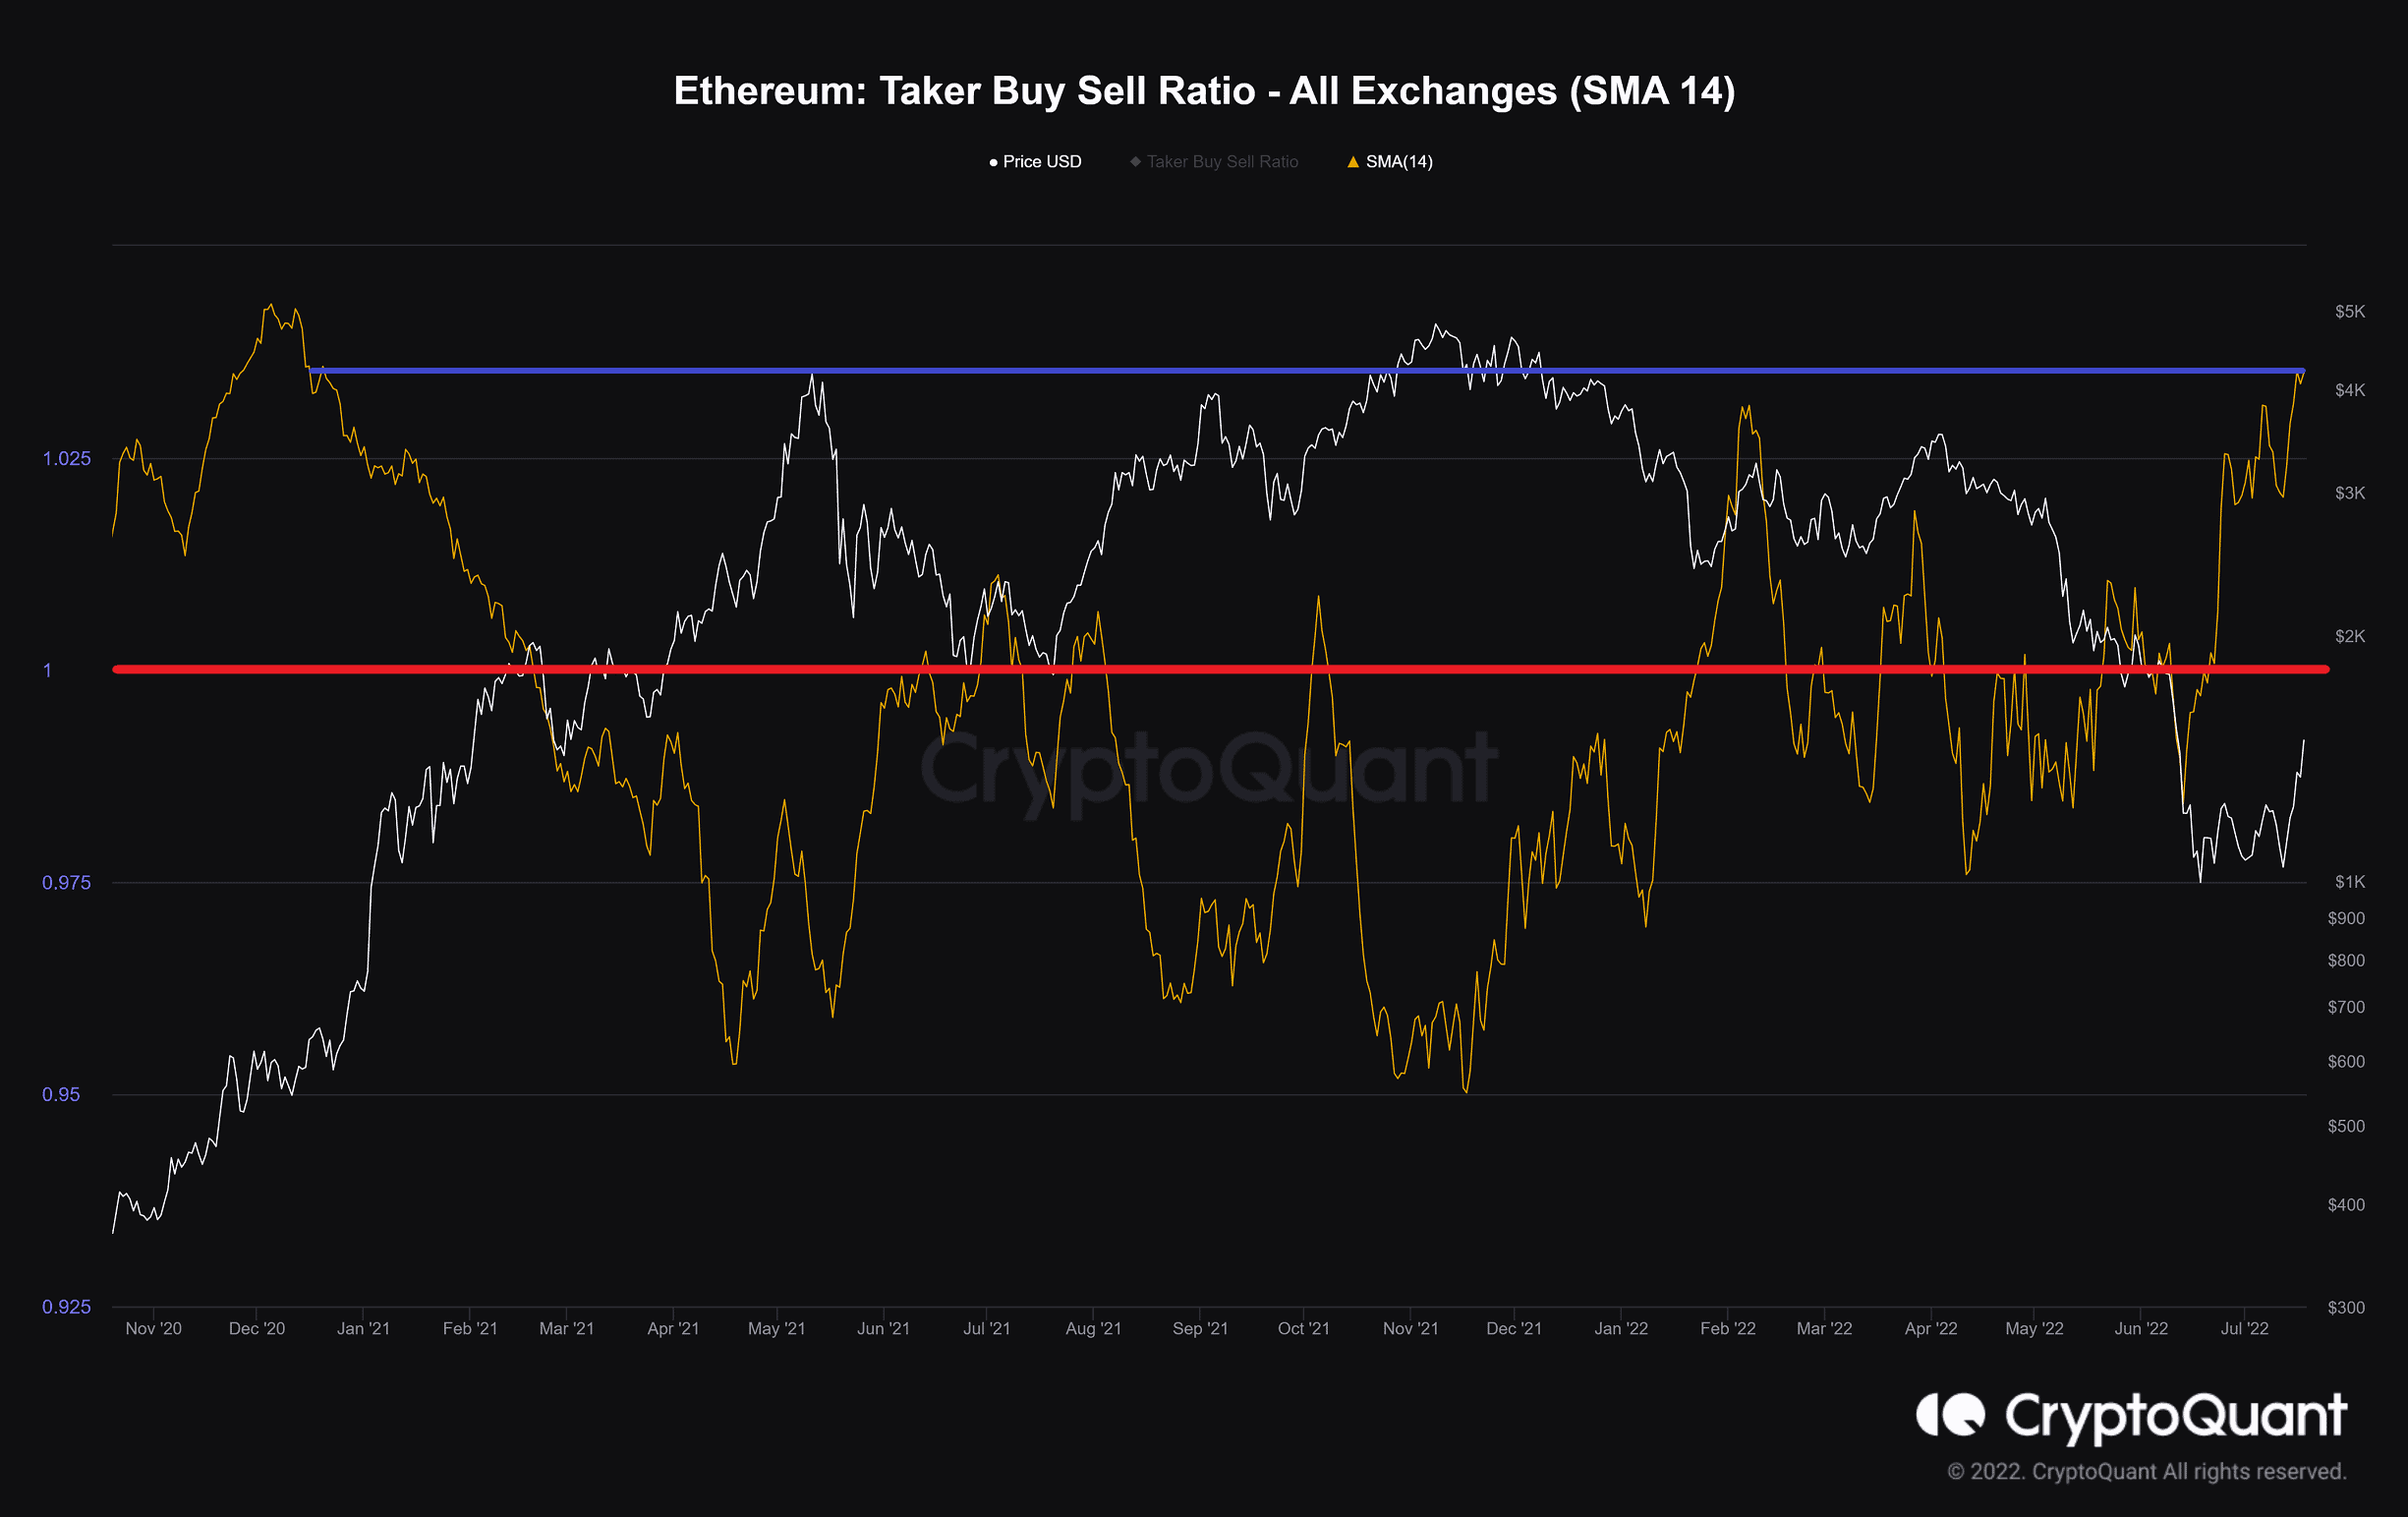
Taker Buy Sell Ratio
Definition: The ratio of buying volume divided by selling volume of takers in perpetual swap trades. Values over 1 indicate that the bullish sentiment is dominant. Values under 1 indicate that the bearish sentiment is dominant.
Takers have filled more buy orders after the last market crash. This caused the bullish sentiment to prevail in the derivatives market. This metric has now reached its highest level since the end of 2020. At that time, Ethereum recorded a historic bull run. The derivatives market is very hot, and many positions, mostly short, were liquidated in the last 24 hours.
OhNoRipple via https://www.ohnocrypto.com/ @CryptoVizArt, @Khareem Sudlow