Weekly Cryptocurrency Market Analysis: Fantom and Harmony Show a Significant Decline but Have a Chance for Recovery
Nov 03, 2021 at 10:46 //
NewsAlthough the general trend of the cryptocurrency market seems to be bullish, some altcoins recorded a significant decline in the last 7 days. However, the downtrend might be short-lived.
On the daily chart, it is likely that the Fantom and Harmony cryptocurrencies will resume their upward momentum. This is because the altcoins have retraced above the moving averages, which indicate a possible rise in the cryptos. The other altcoins are at risk of further declines as the cryptocurrencies are trading in the bearish trend zone.
CoinIdol, a world blockchain news outlet, has compiled a list of cryptocurrencies that have seen the biggest drop in price over the past 7 days. Here is what it looks like:
Fantom
Fantom (FTM) is in a downtrend. Today, the cryptocurrency has fallen and is trading at $2.73 at the time of writing. The downtrend is due to the failure of buyers to keep the price above the high of $3.40. The bulls tested the recent high twice, leading to the formation of a bearish double top pattern. Below are the characteristics of the cryptocurrency:
Price: $2.73
Market Capitalization: $8,670,038,905
Trading Volume: $547,953,182
7-Day Loss: 17.57%
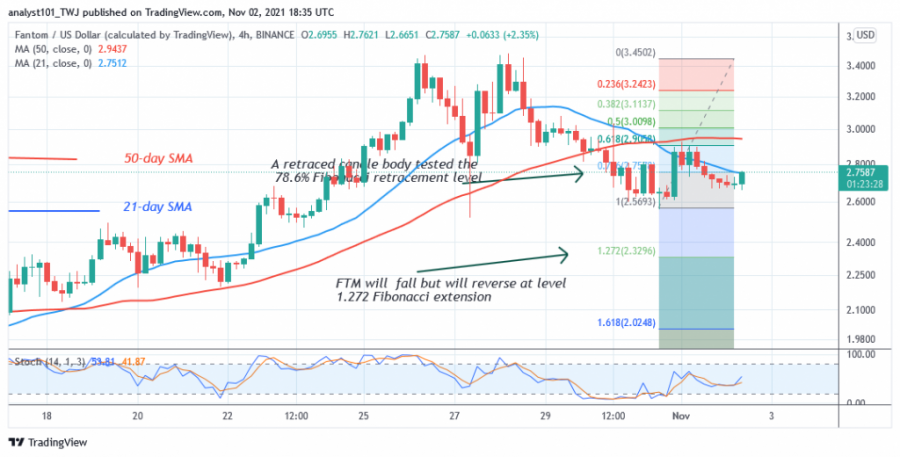
Meanwhile, the selling pressure has reached bearish exhaustion. The altcoin has fallen and found support above $2.60. The cryptocurrency will resume its uptrend if the current support holds. Meanwhile, the downtrend from October 31 has a candle body testing the 78.6% Fibonacci retracement level. The retracement suggests that FTM will fall but reverse at the 1.272 Fibonacci extension level or $2.32.
Harmony
Harmony (ONE) is trading in the bullish trend zone despite the recent dip. The cryptocurrency asset has fallen from the high of $0.37 to the low of $0.28 after forming a bearish double top. The altcoin was the second biggest loser in the previous week. These are some of the features:
Price: $0.2978
Market Capitalization: $3,981,053,378
Trading Volume: $191,866,447
7-Day Loss: 16.90%
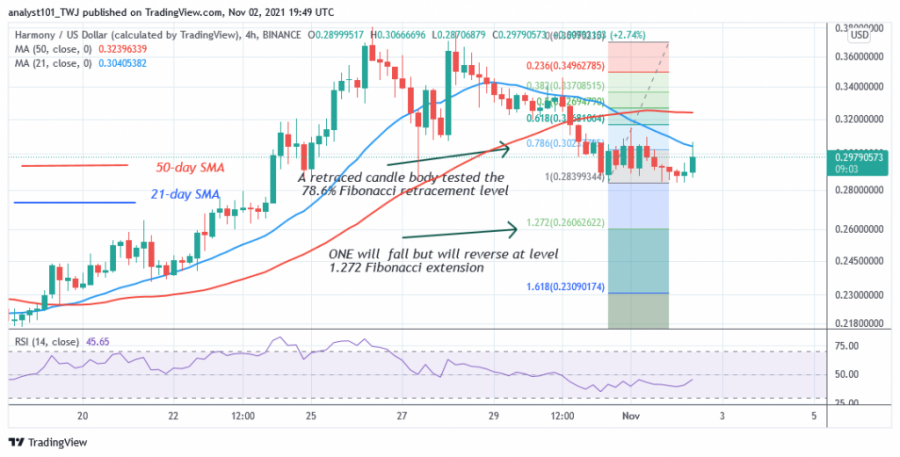
Today, the price of ONE /USD is correcting higher, but the correction is meeting rejection at the 21-day moving average line. If buyers push the altcoin above the moving averages, the uptrend will resume. Selling pressure will continue if the altcoin is rejected at the recent high.
Meanwhile, the downtrend from October 31 has a candlestick testing the 78.6% Fibonacci retracement level. The retracement suggests Harmony will fall but reverse at the 1.272 Fibonacci extension level or $0.26.
Mina
Mina (MINA) is in a downtrend after falling below the moving averages and finding support above the $4.45 low. The crypto price corrected higher but found resistance at $5. Selling pressure will resume if the price falls below $4.45 support. Meanwhile, MINA /USD has the following characteristics:
Current Price: $4.48
Market capitalization: $3,681,412,726
Trading Volume: $58,228,664
7-Day Loss: 13.79%
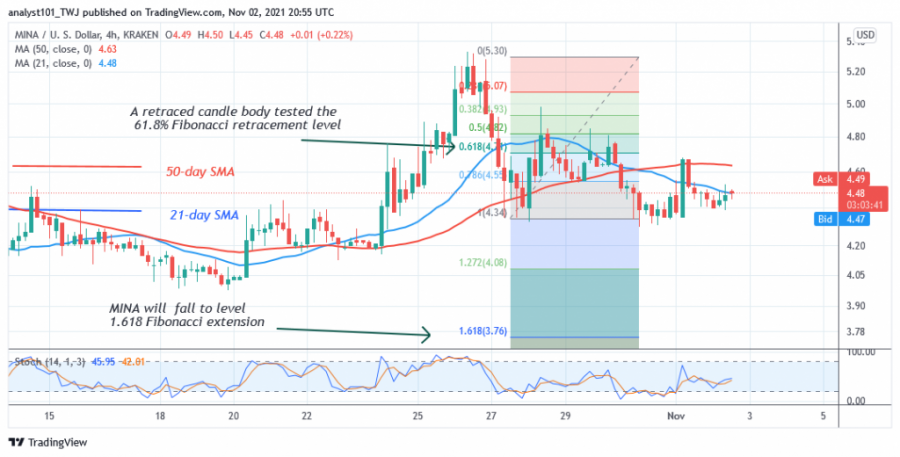
The cryptocurrency is moving above the $4.45 support. Nevertheless, on October 27, the downtrend tested the 61.8% Fibonacci retracement level with a retreating candlestick. The retracement suggests that MINA will fall to the 1.618 Fibonacci Extension level or $3.76.
Quant
Quant (QNT) has been in a sideways trend since September 23. The cryptocurrency is trading below the upper resistance level of $320. Bulls have pushed the altcoin up to the overhead resistance five times, encountering resistance along the way. The sideways movement will continue until the overhead resistance is broken. The cryptocurrency has the following characteristics:
Current Price: $274.16
Market capitalization: $4,006,106,356
Trading Volume: $59,791,587
7-Day Loss: 14.24%
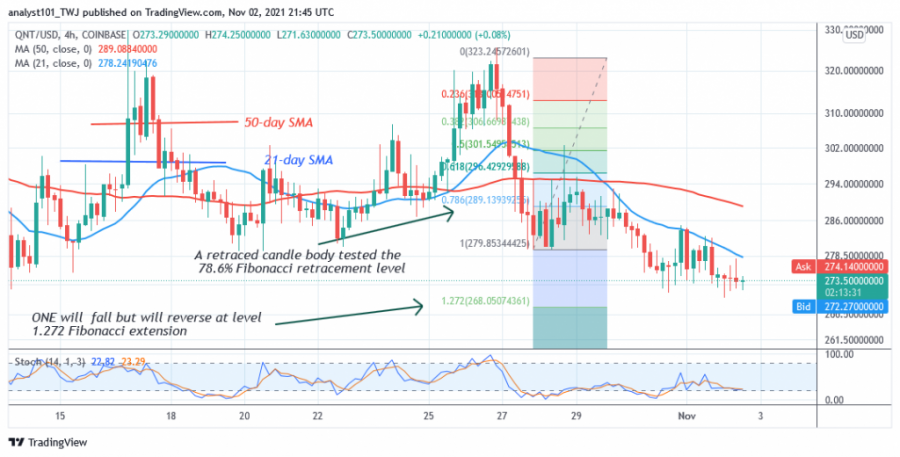
However, the current downturn has reached its bearish exhaustion. In the October 27 downtrend, a retracement candlestick tested the 78.6% Fibonacci retracement level. The retracement suggests QNT will fall but reverse at the 1,272 Fibonacci extension level or $268.05.
Curve DAO Token
Curve DAO Token (CVR) is trading in a sideways trend. Today, the cryptocurrency has fallen from a high of $5.20 to a low of $4.17. Since October 25, buyers have failed to break above the overhead resistance of $5.20. The overhead resistance has been retested three times. Each time, the market falls back to the previous low. It is likely that the altcoin will rise again when selling pressure reaches bearish exhaustion. The cryptocurrency has the following characteristics:
Current Price: $4.34
Marktkapitalisierung: $14.328.593.422
Trading Volume: $330,080,906
7-Day Loss: 11.94%
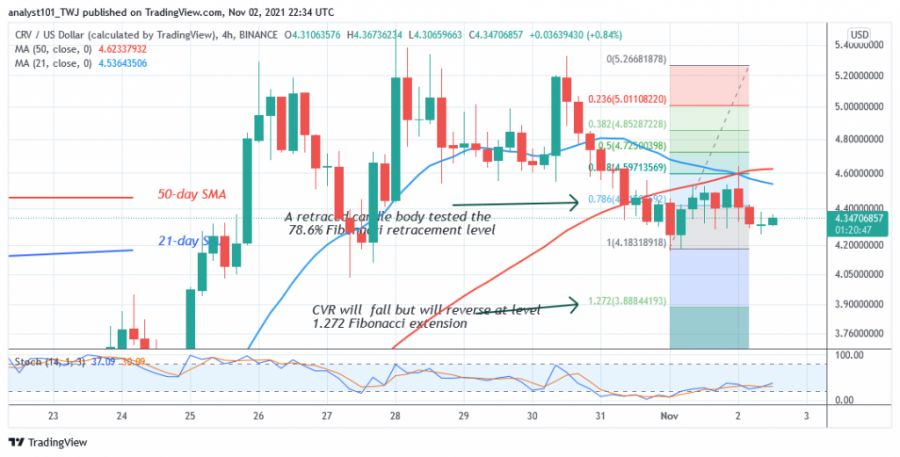
Nonetheless, the downtrend has a candlestick body on November 1 that tested the 78.6% Fibonacci retracement level. The retracement suggests CVR will fall but reverse at the Fibonacci extension level of 1.272 or $3.88.
Disclaimer. This analysis and forecast are the personal opinions of the author and are not a recommendation to buy or sell cryptocurrency and should not be viewed as an endorsement by CoinIdol. Readers should do their own research before investing funds.
OhNoCryptocurrency via https://www.ohnocrypto.com/ @coinidol.com By Coin Idol, @Khareem Sudlow
