
Bitcoin Price Analysis: China FUD Caused Heavy Liquidations, Is the Bottom In?
Just as Bitcoin rallied slightly above $45k on Friday, recycled news on China’s central bank vowing to ban crypto trading for Chinese citizens came out, liquidating more than $600 million of derivative positions at the time of writing.
It is crucial to remember that large liquidations tend to cause cascades of forced sell orders, creating a near-term imbalance between supply and demand. In these events, supply overwhelms demand, and prices drop until the next large bid (supply) is hit.
Despite the near-term volatility, the overall trend in fundamentals and on-chain metrics remains firmly bullish as long-term holders and miners continue to hold. In contrast, the weak hands combined with ‘young’ held coins continue to panic sell. Exactly as happened in yesterday’s drawdowns.
China FUD Flushed Out the Weak Hands
The recent China FUD on banning crypto trading appears to be old news which was published on September 3rd, 2021. Considering the $4B in liquidations causing an intraday drop of 20% on September 7th, 2021, the day El Salvador adopted Bitcoin as legal tender, the news has already been priced in.
Wave 2: Bitcoin Price is Attempting to Find a Bottom
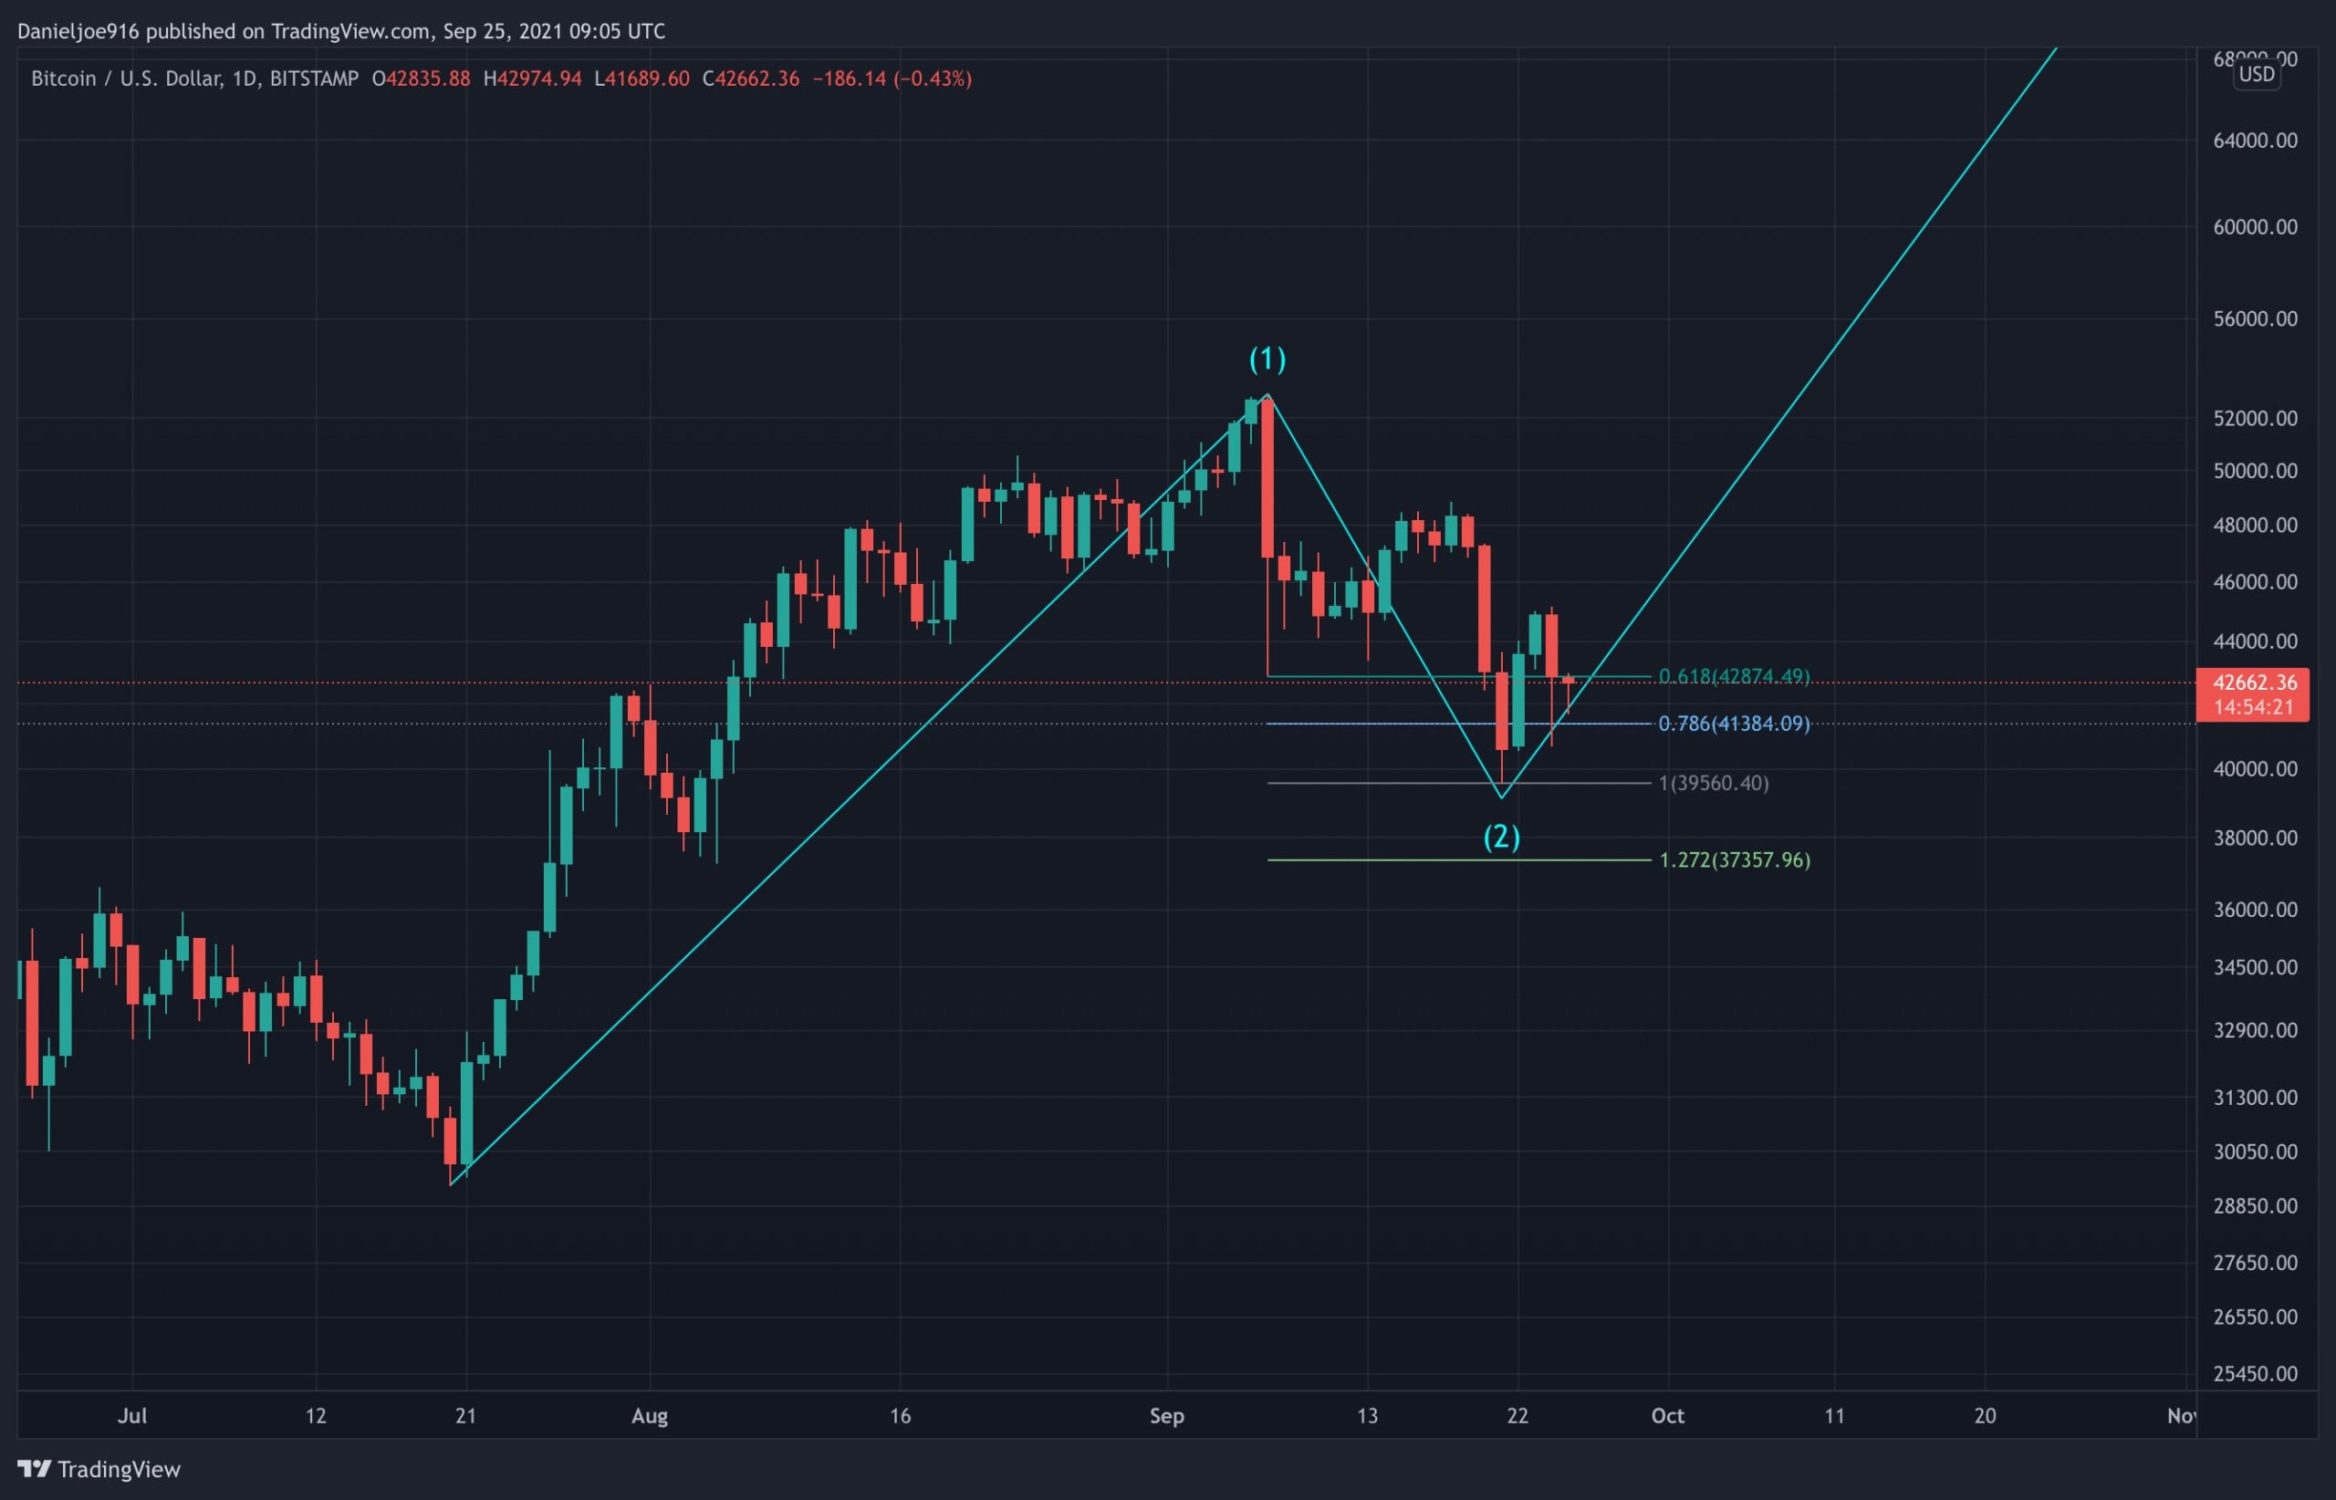
The recent volatility and large liquidations managed to push BTC down to a weekly low of $39.5k on Tuesday, confluent with a critical Fibonacci retracement level. So far, the technical structure suggests that the pullback from $52.9k to $39.5k is a Wave 2 corrective wave (according to Elliot Waves).
According to Elliot Wave structure, Corrective waves follow a 3 wave move to the downside. Technical analysts refer to this as an ABC corrective wave, where A is the initial leg down, B is a push-up, then C is the final leg down.
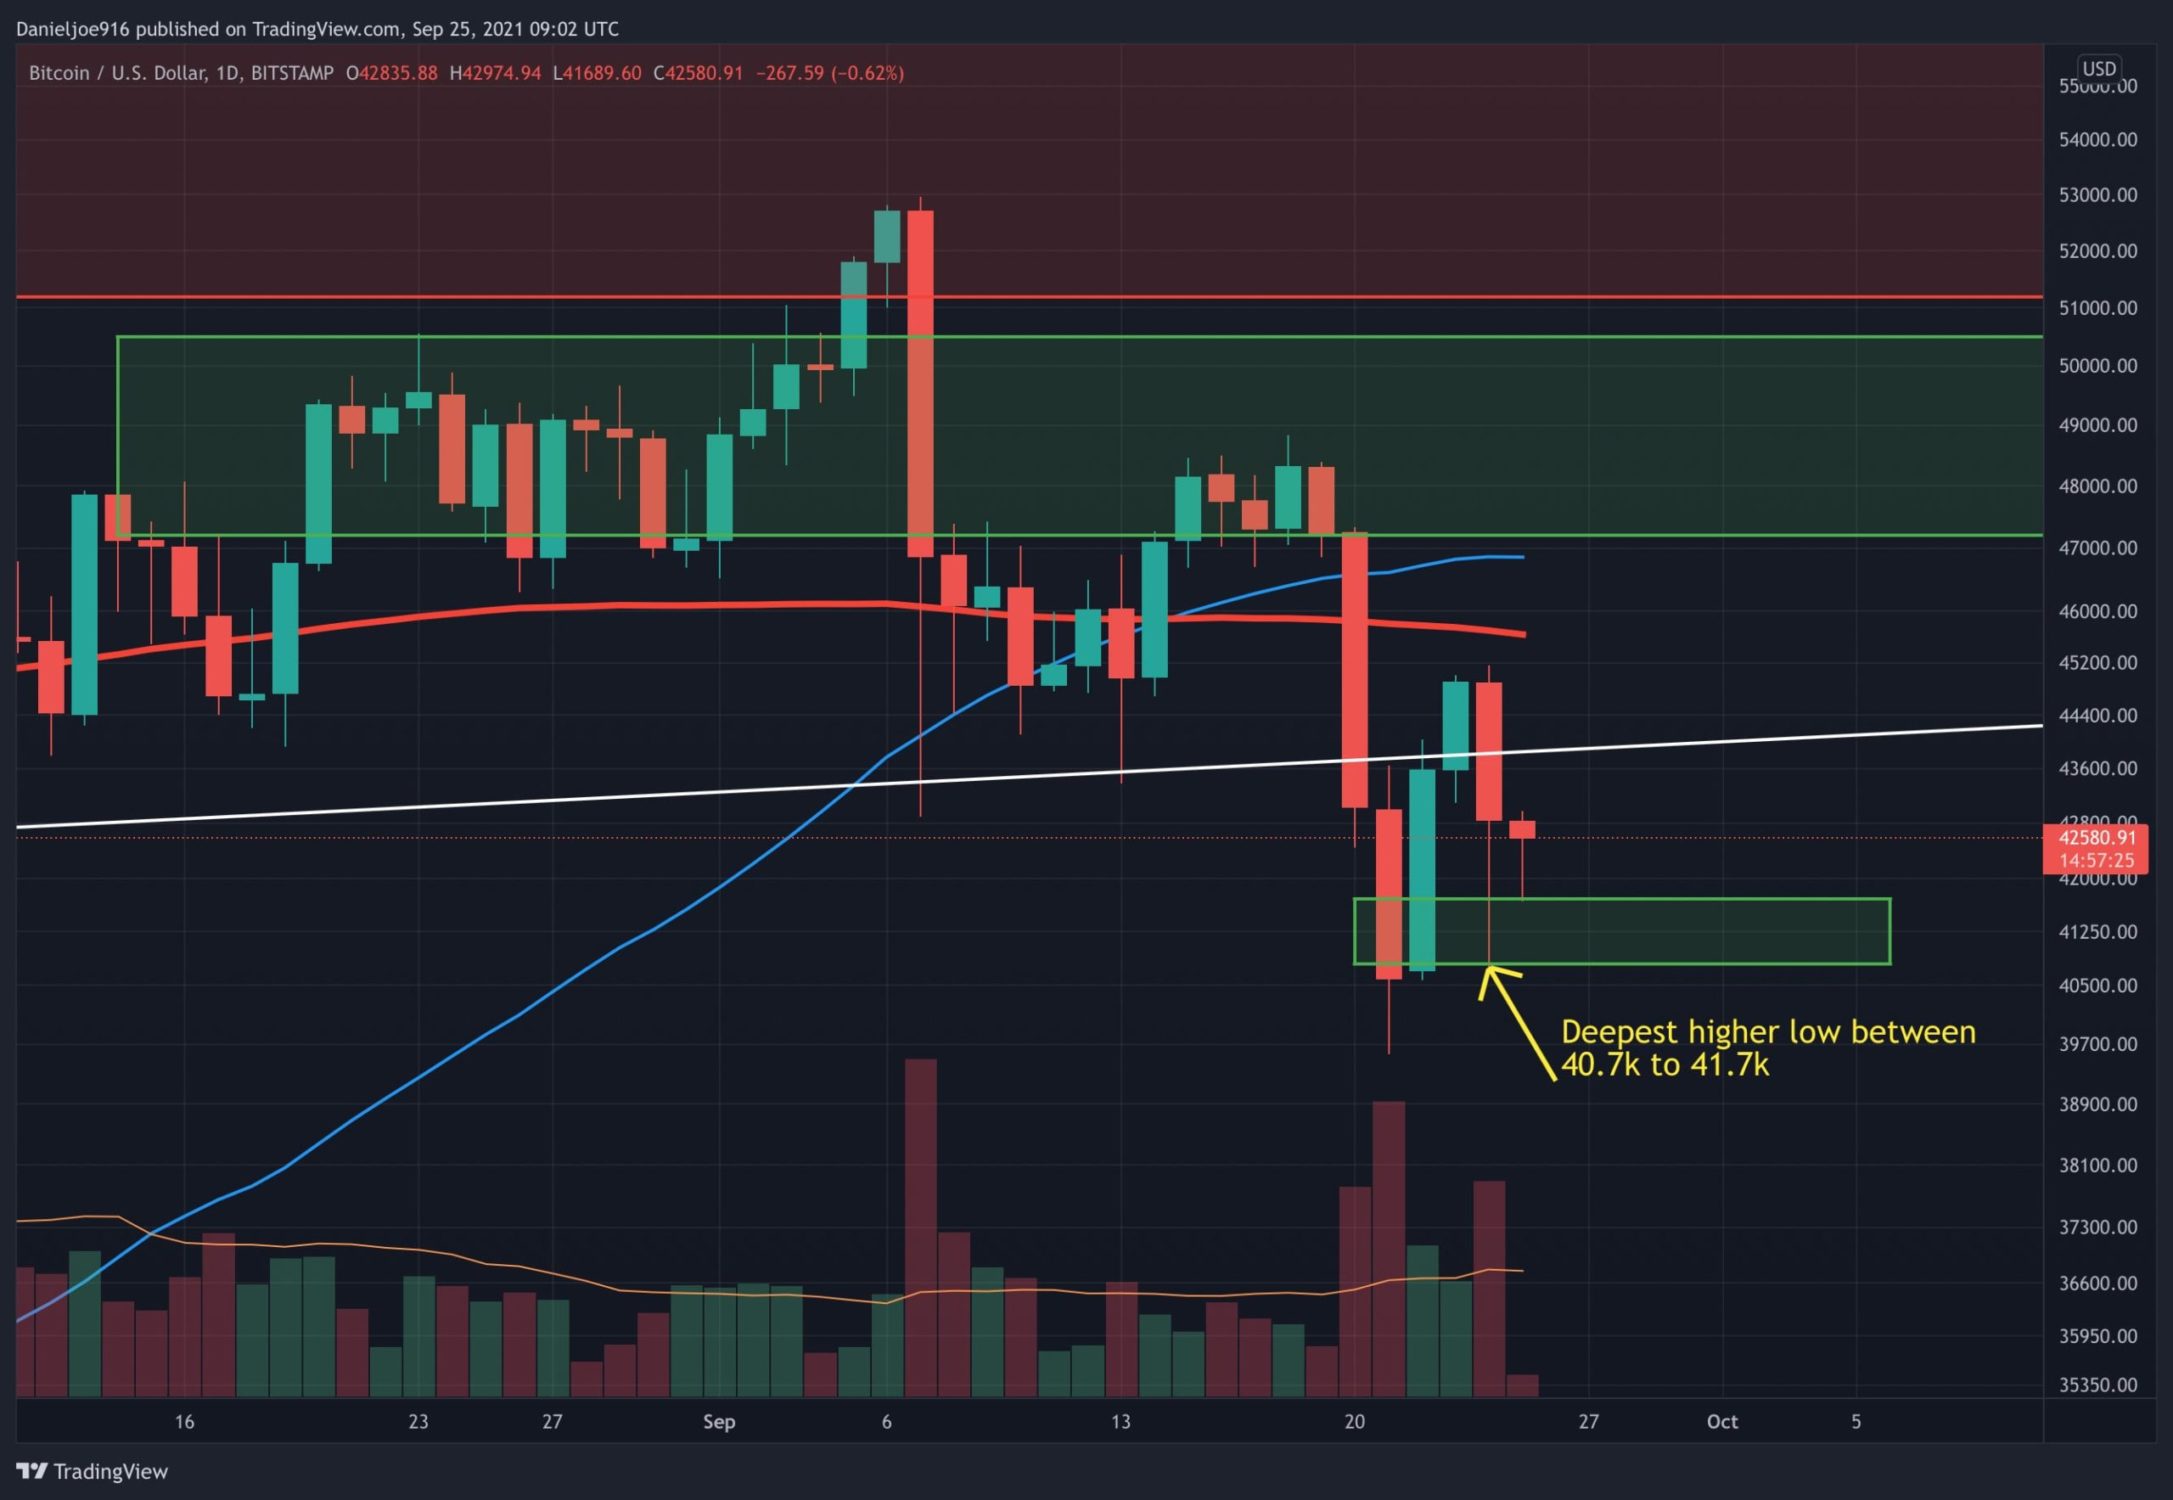
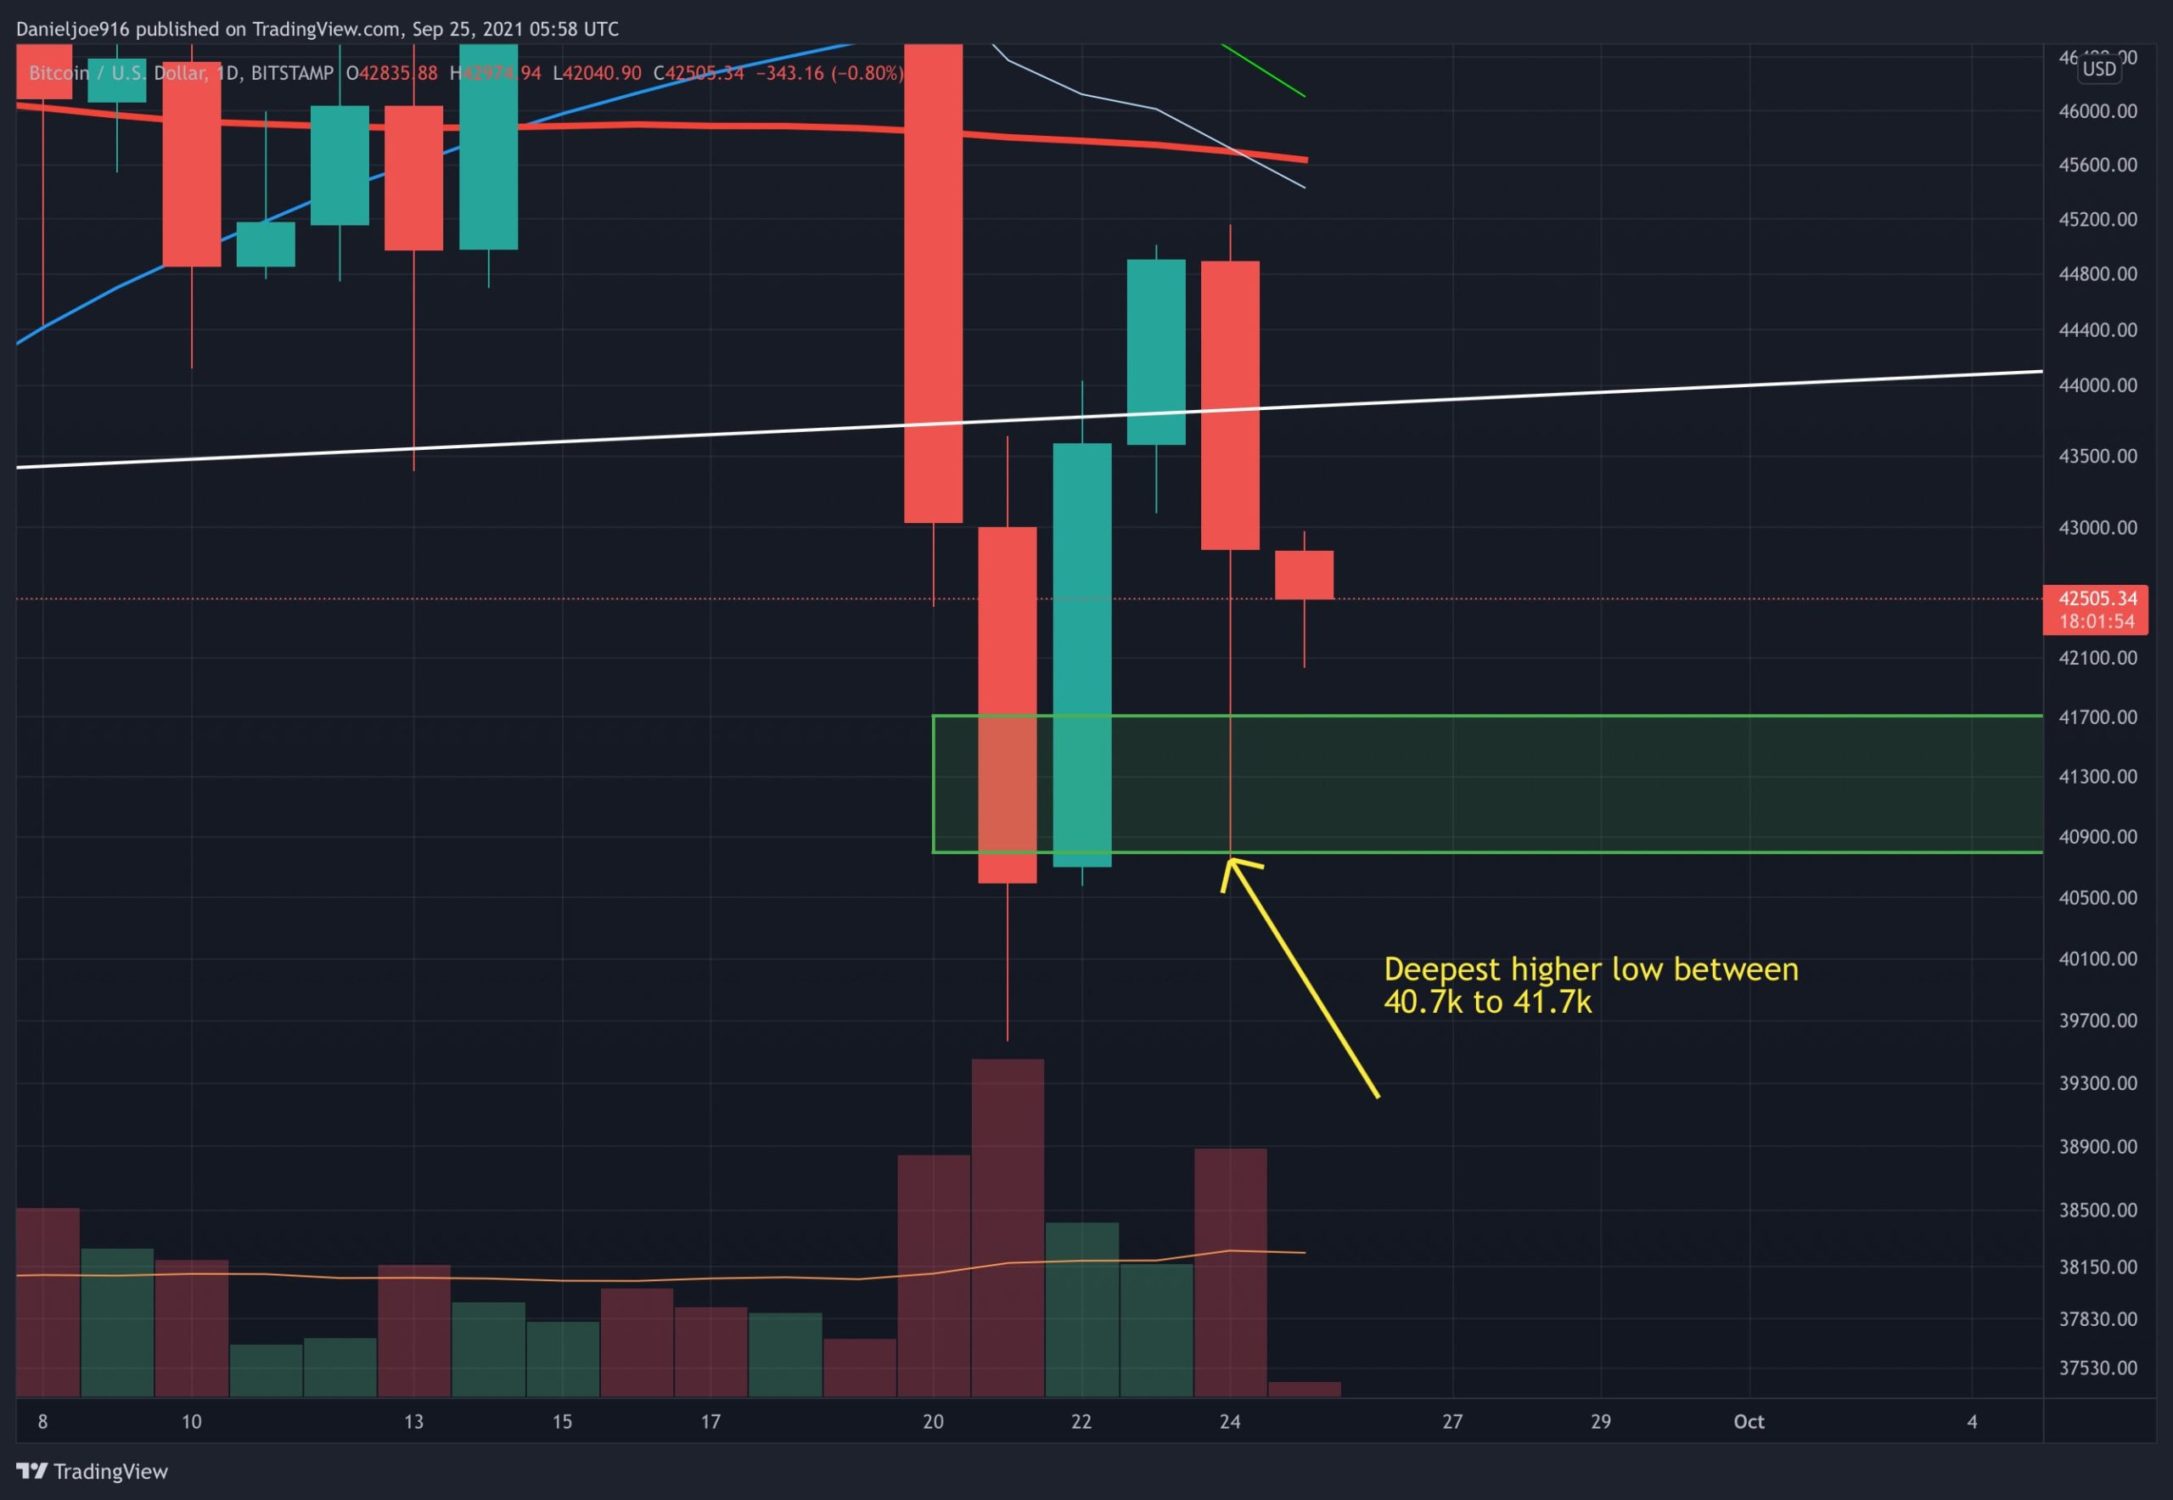
For the next short term, the price of bitcoin needs to hold the low of the C Wave at $39.5k. So far, BTC has pushed back up and is forming a higher low at $40.7k, a confluent level of technical support, which includes the lower Bollinger Band on the daily chart.
If BTC can successfully hold the higher low at $40.7k and start making higher highs above $45.2k, this will further increase the probability of Wave 2 completing.
Looking ahead, the technical structure suggests the completion of Wave 2 will initiate a larger Wave 3, which tends to be the wave that pushes price significantly higher. This strongly depends on BTC being able to protect the higher low at $40.7k and the intra-week lows at $39.5k.
Long Term Technical Structure Holding
Although near-term charts look bearish, the long-term charts remain bullish, especially with larger structure holding: BTC has managed to hold support on the top of the $30k to $40k trading range back in June and is making a higher low since the bottom at $29.2k in July.
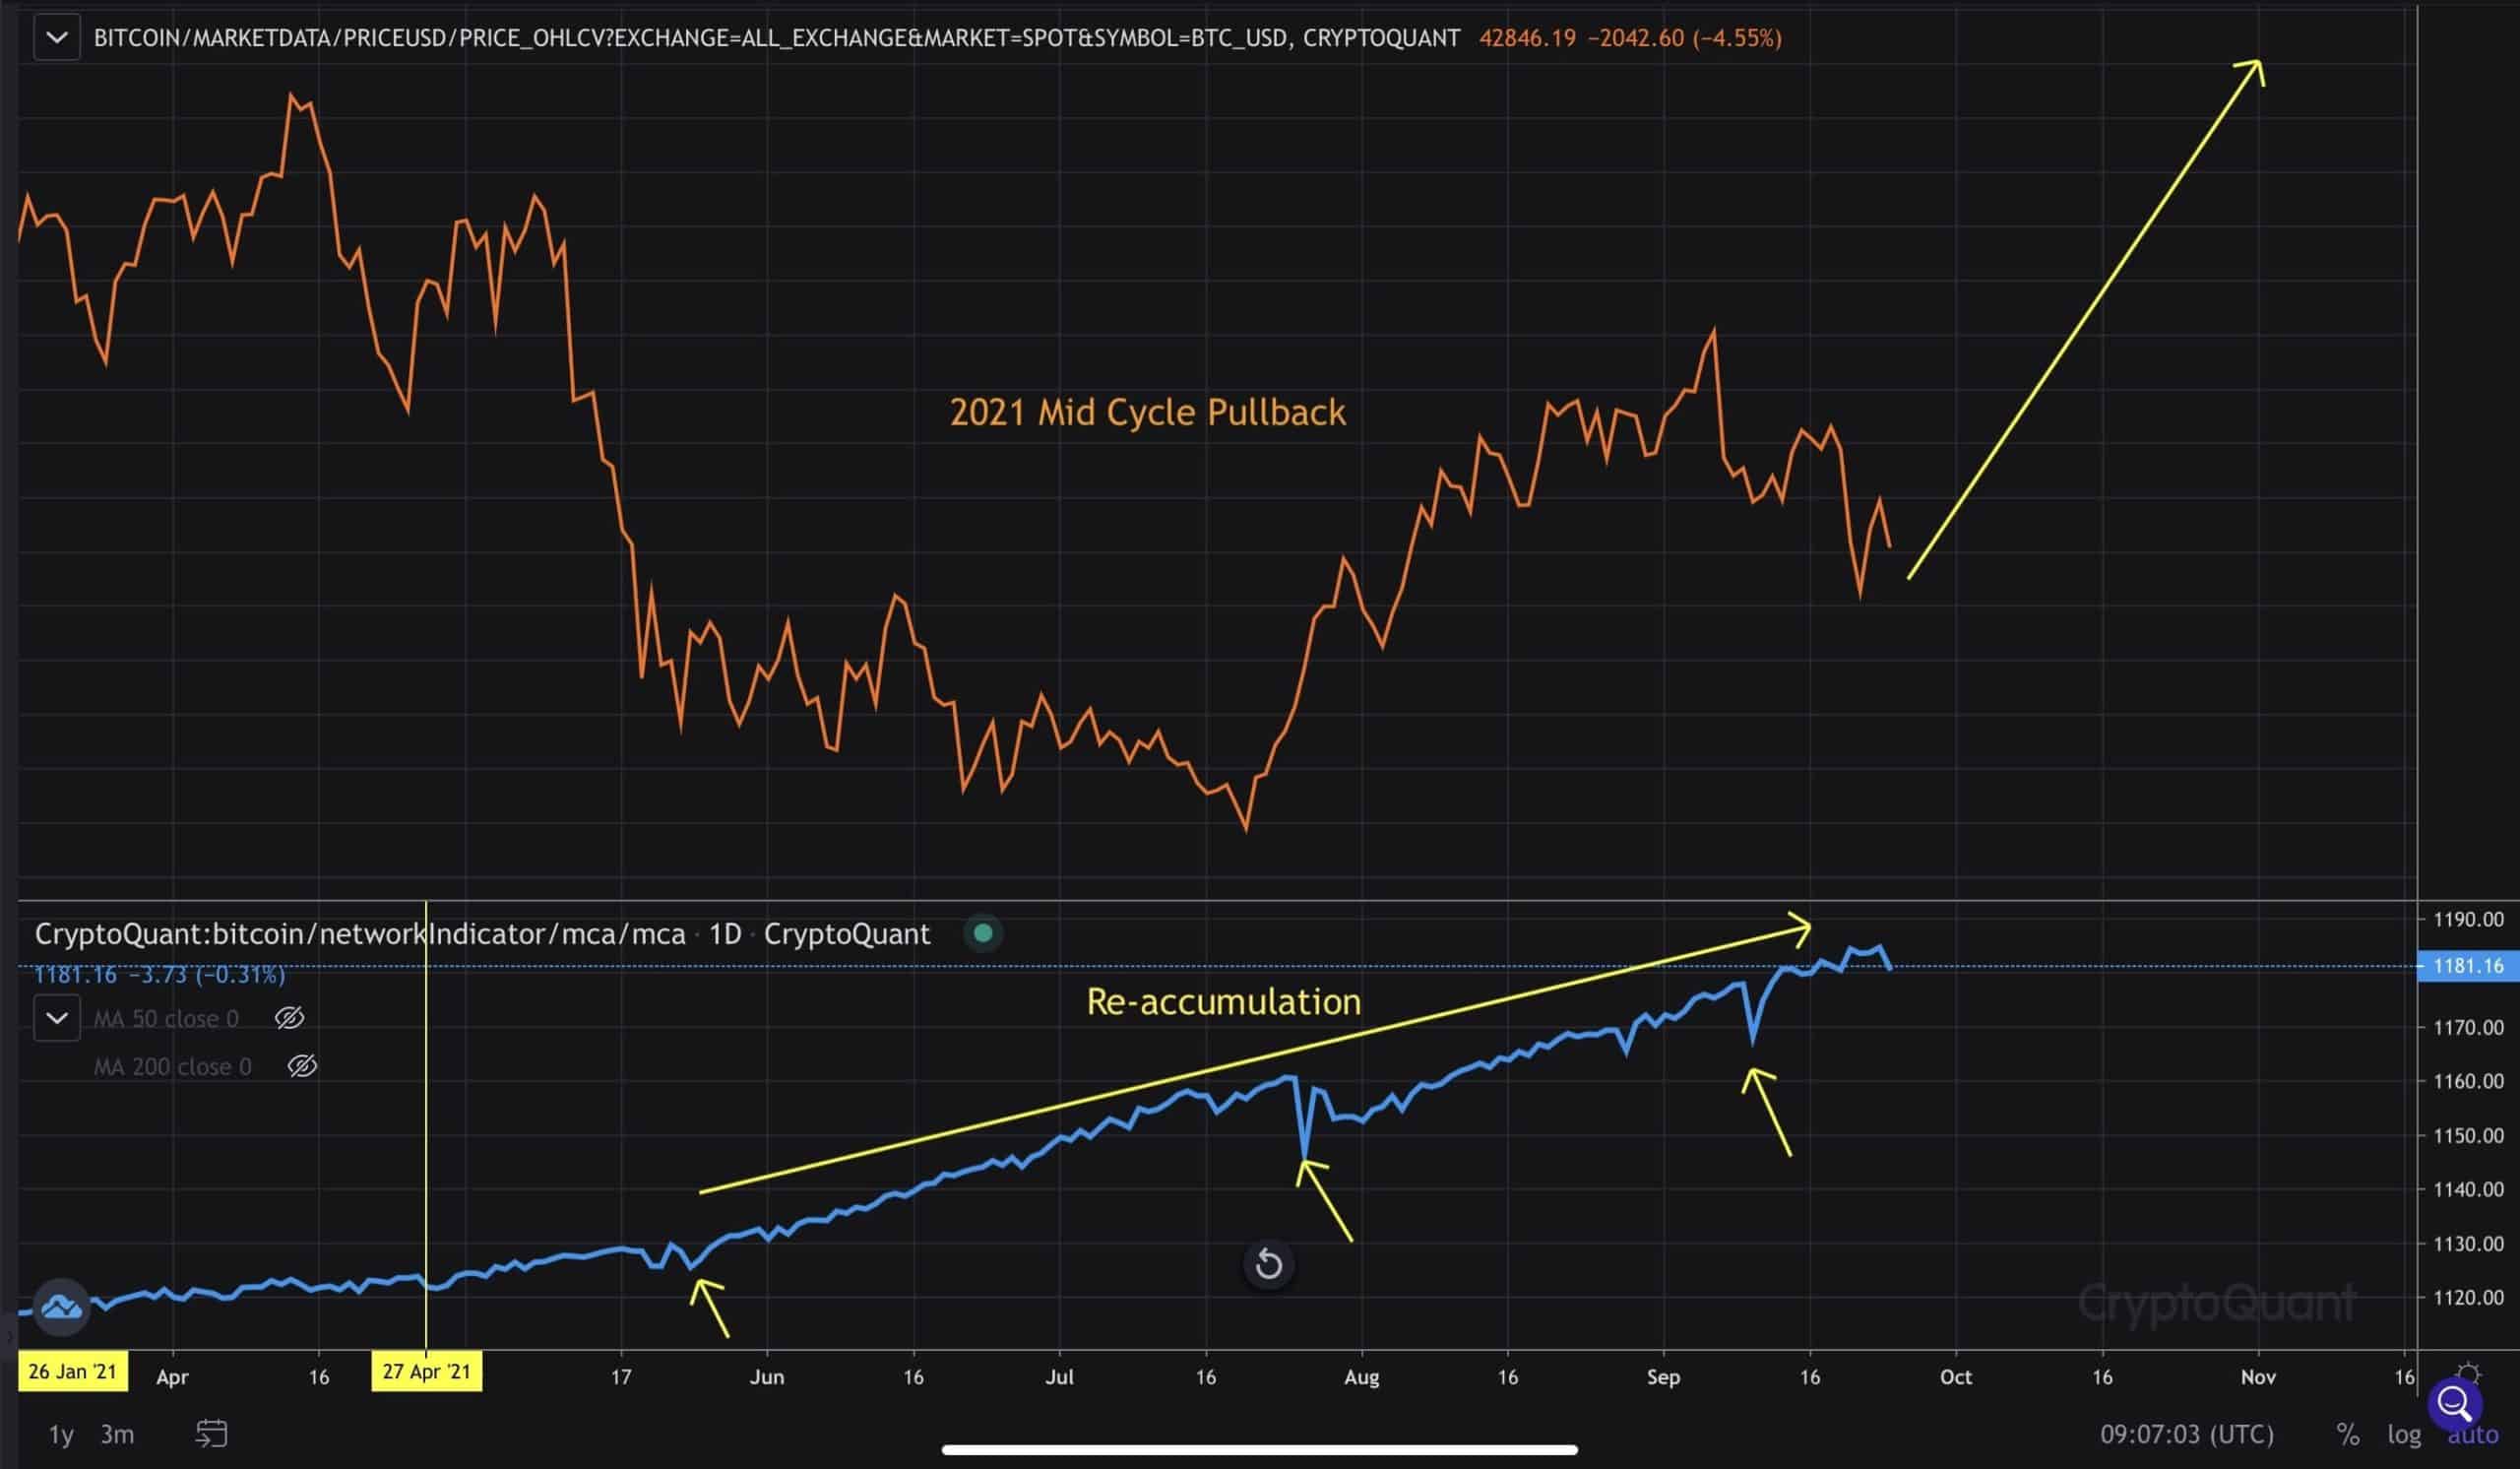
Wyckoff Accumulation Extending Phase D
Wyckoff Accumulation appears to be extending Phase D, which is more of a consolidation phase, before Phase E where the price is significantly pushed higher. The multiple rounds of liquidations and suspiciously timed FUD pushed BTC back below $50k.
Trading volume increased as BTC tested key technical levels of support amid $40k, suggesting larger buyers have been stepping in. Despite a deeper than anticipated pullback, BTC is still making a higher low (on the lower timeframes). To maintain a larger technical structure, BTC needs to hold support between $41.3k to $40k on a weekly closing basis.
On-chain Trend Remains Bullish
The majority of the recent selling has come from leverage liquidations and panic selling from younger coins. 3-month-old coins and younger ones have been the primary sellers. Overall, older coins continue the trend of accumulation, showing no interest in selling the drawdown.
Since BTC topped out at $52.9k, Miner reserves have been slowly trending lower, falling by around 6,600 BTC. This may appear to be a large amount of BTC, but this is just 6,600 BTC out of total miner reserves of 1,850,000 BTC.
Bitcoin’s miner reserves continue to remain above the beginning balance in January 2021, showing BTC miners sell small amounts of BTC periodically, but the overall trend shows no major selling pressure compared to bear markets.
The Mean Coin Age metric by CryptoQuant continues to trend higher despite the drawdown, which strongly confirms that long-term holders continue to accumulate and hold while the weak hands sell.
The volatility throughout 2021, multiple liquidation events, consistent FUD, and deep pullbacks have not significantly impacted the long-term holders. This suggests the HODLers who have been holding BTC for years are becoming comfortable with their position even with the wild swings and liquidations.
The described type of behavior, which can be seen on-chain, strongly suggests that long-term holders and entities holding older coins have a strong conviction in Bitcoin, and refuse to sell on significant drawdowns. As these entities continue to accumulate, less BTC will be available for sale on exchanges, further driving the deep supply exhaustion.
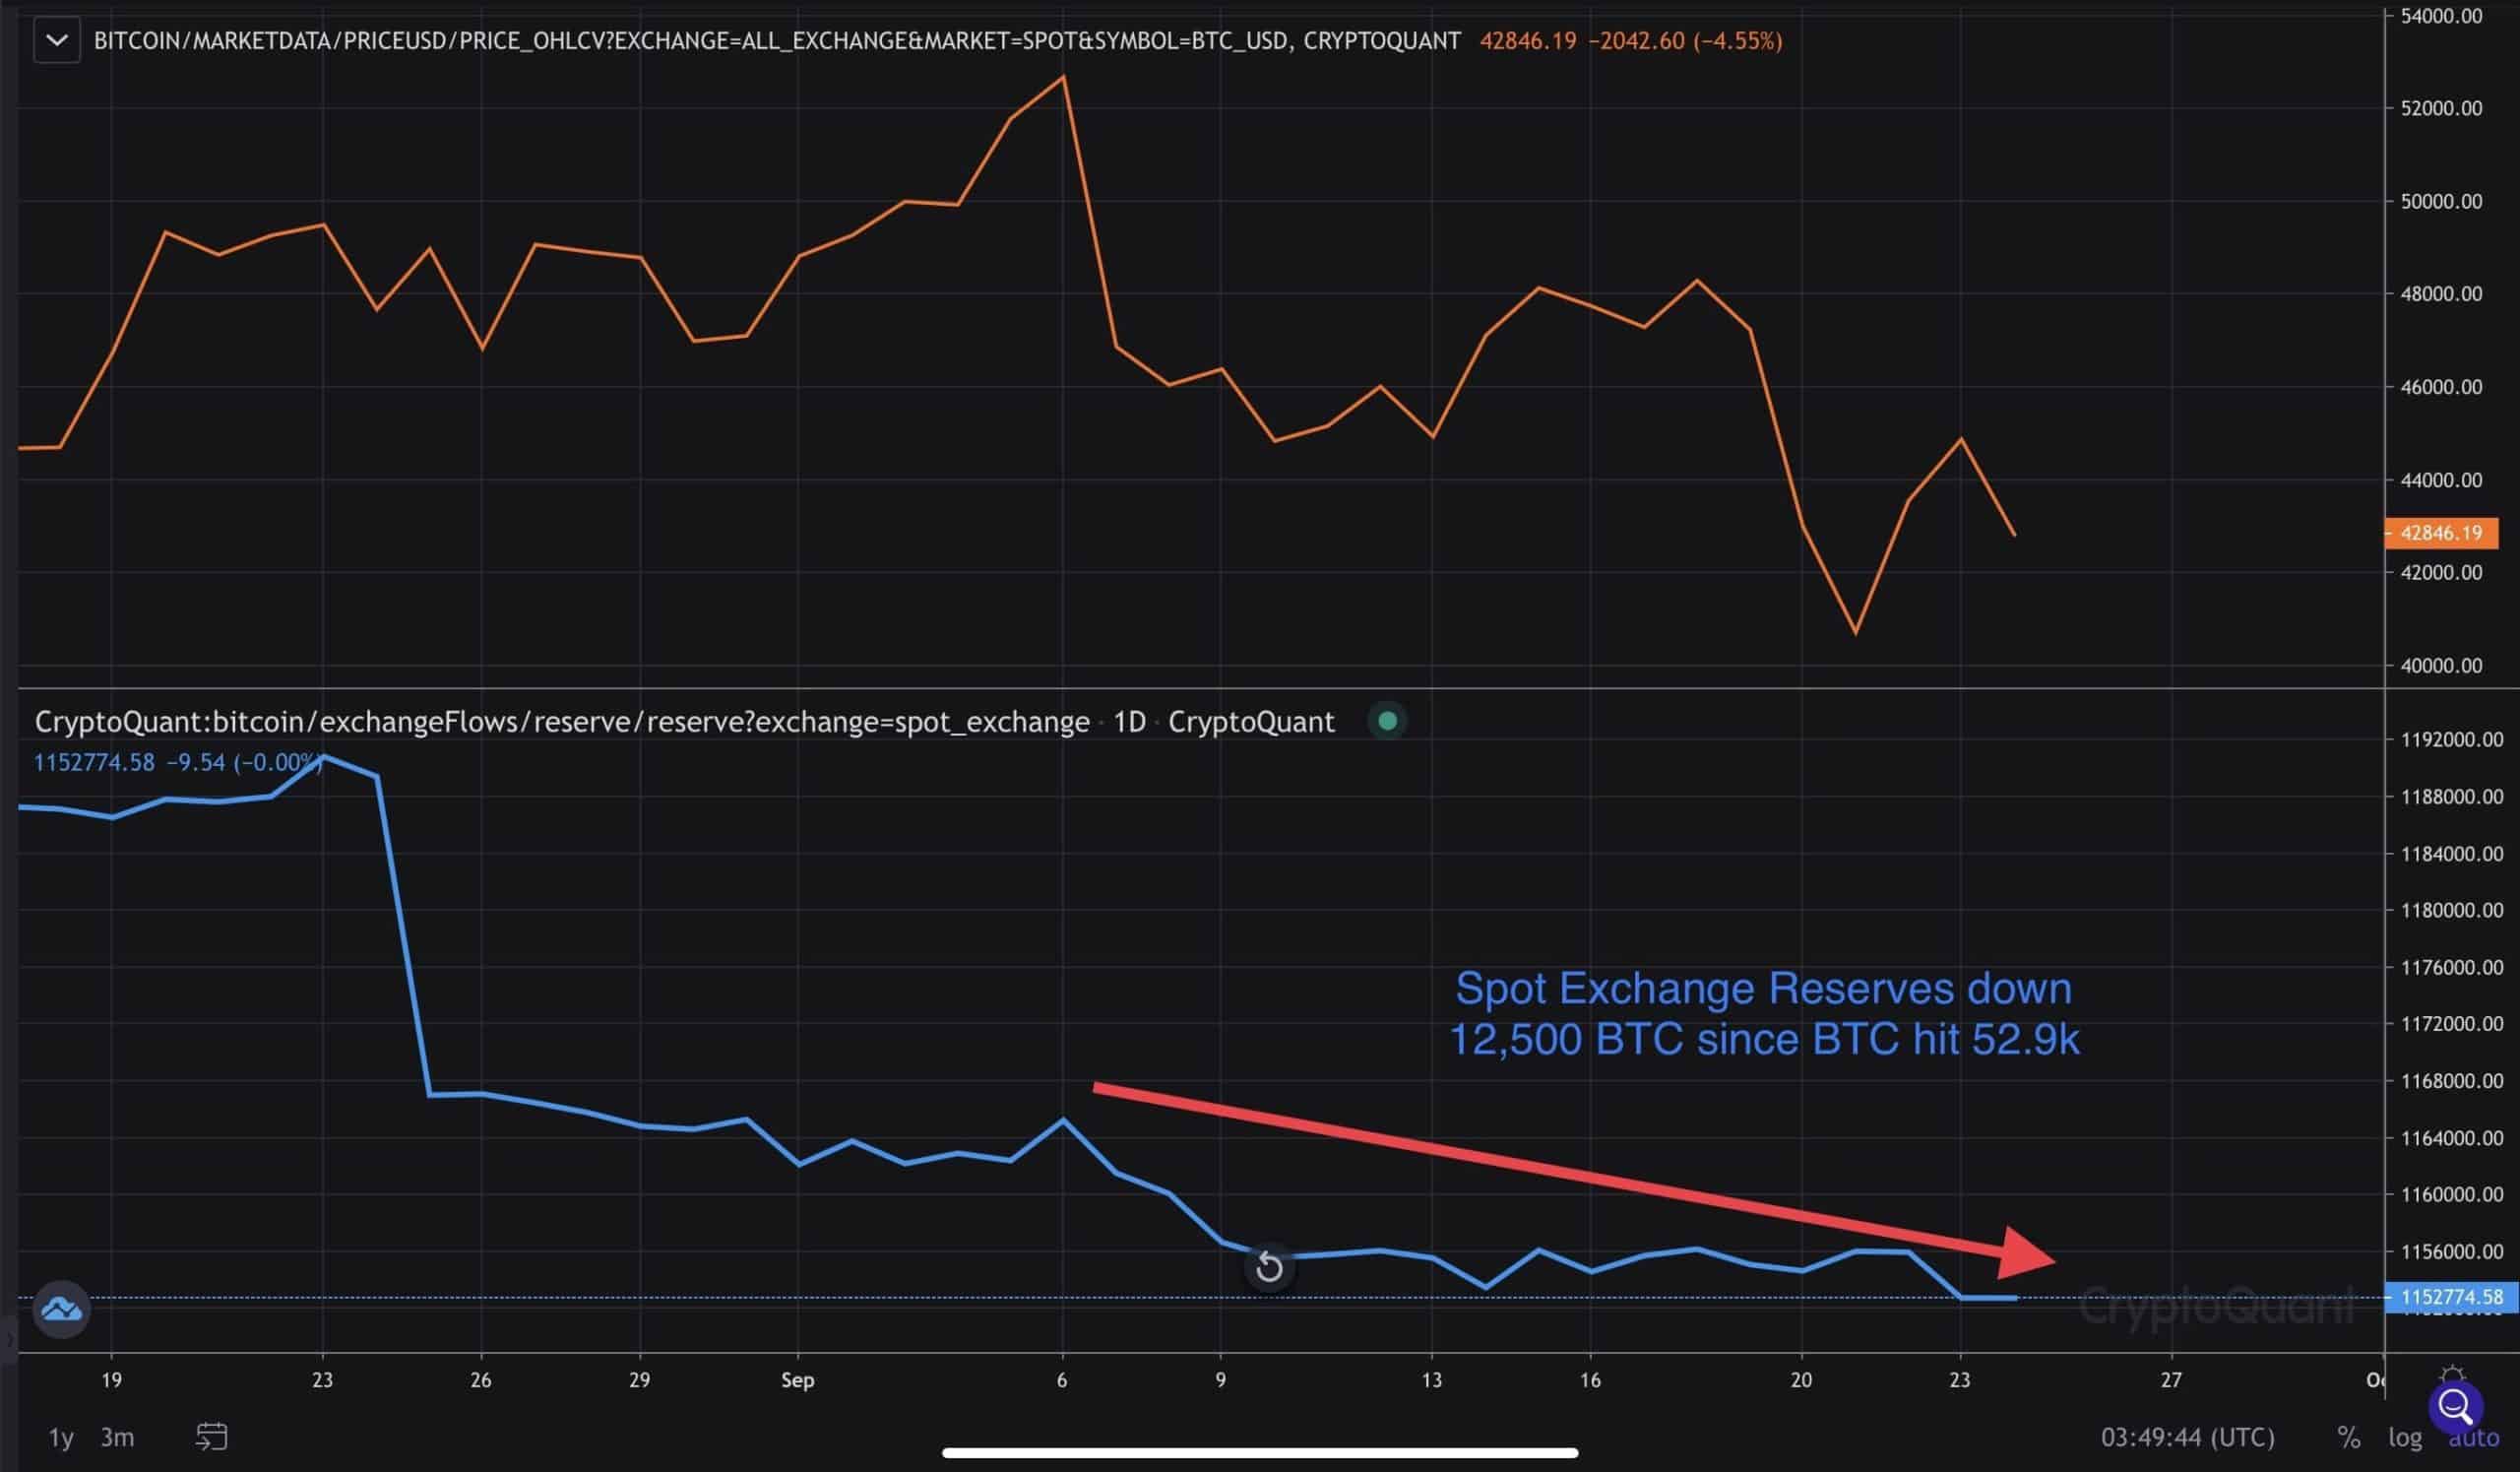
This can be witnessed at spot exchange reserves, which continue to make new multi-year lows, even with the recent volatility. Spot exchange reserves dropped by 12,500 BTC since BTC topped out at $52.9k and started the pullback. Based on this data, it’s clear that investors are buying the dip and withdrawing BTC from exchanges.
Critical Weekly Close Coming Up
It’s important to see BTC remain above $41.3k and $40k for the weekly close. Near term, we need to see $40.7k hold to form a higher low, as the next step for Wave 2 pullback completion.
It’s also possible to see further liquidations, which likely send BTC towards the lows at $39.5k. Breaking below $39.5k might send BTC to the following significant support levels at $38.6k, $38.3k, and $37.3k.
This would be a less ideal scenario for the bulls, especially as BTC is approaching the critical weekly close. If there is a liquidation wick down to the upper $30k’s, it is critical to see a wick back up above $40k to maintain a larger technical structure.
The bottom line: Near-term charts look cautious, but the longer-term charts and overall trend in fundamental and on-chain remain firmly bullish as the long-term holders, miners, and entities holding older coins are not showing any signs of selling. BTC continues to look well-positioned for a strong rally to new all-time highs later this year.
OhNoRipple via https://www.ohnocrypto.com/ @Daniel Joe, @Khareem Sudlow