
Bitcoin Price Analysis: BTC Holds Critical Level at MA-200 for Weekly Close, Is the Sell-Off Finished?
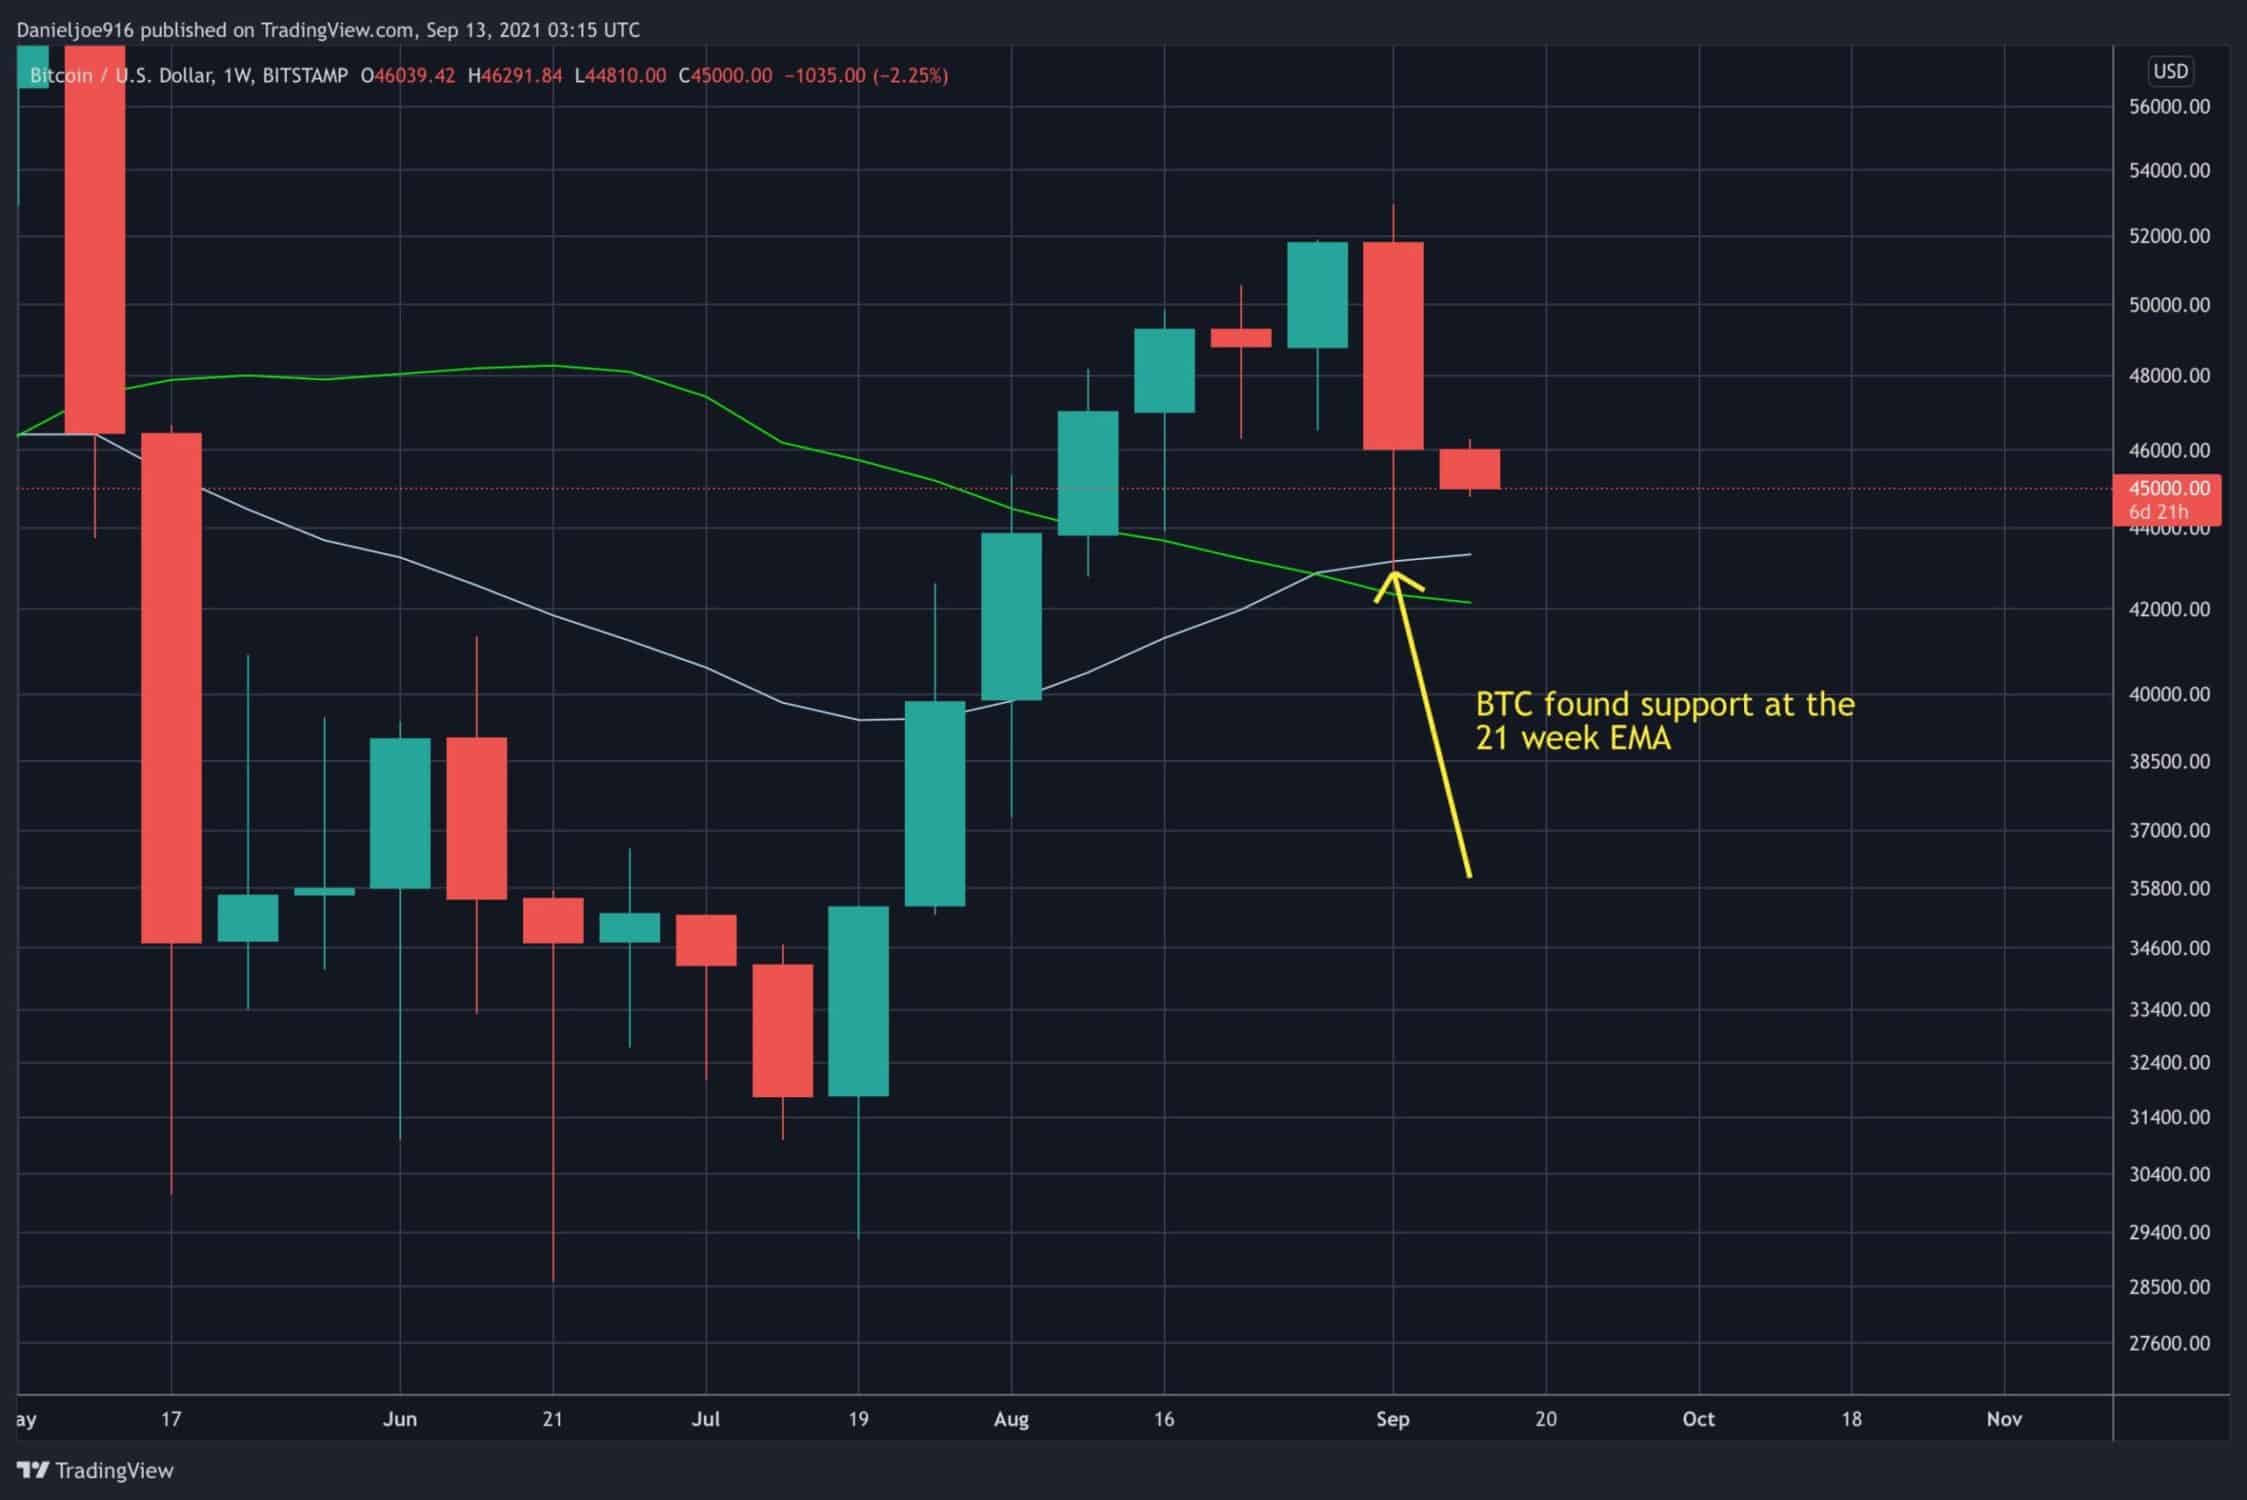
After a week filled with volatility and fear, BTC still managed to hold the critical 200-day and 21-week moving average.
Although the near-term charts look bearish, it is important to recognize that the overall trend in Bitcoin fundamentals and on-chain metrics remain firmly bullish. In fact, the trend in on-chain metrics continued to strengthen throughout the pullback from $52.9k to $42.8k.
The Weak are Selling, the Strong Are Buying
BTC’s violent 20% drop made it look like the strong hands, and large entities holding older coins were selling, but on-chain analysis clearly verified that this was not the case. The majority of selling during the past week came from billions of dollars in leverage liquidations, younger coins panic selling, and macro risk-off.
On-chain data, at the moment, is showing no major signs of whale exit liquidity, which is what occurred during the 2018 bear market where whales sold the rallies in significant quantities. According to CryptoQuant’s UTXO Age Distribution metric, it’s very clear the younger coins, especially the 3 to 6-month-old cohort was the ones panic this past week. Note, the aging of cohorts continues, especially between 12 to 18-month-old coins into 18 months to 2-year-old coins.
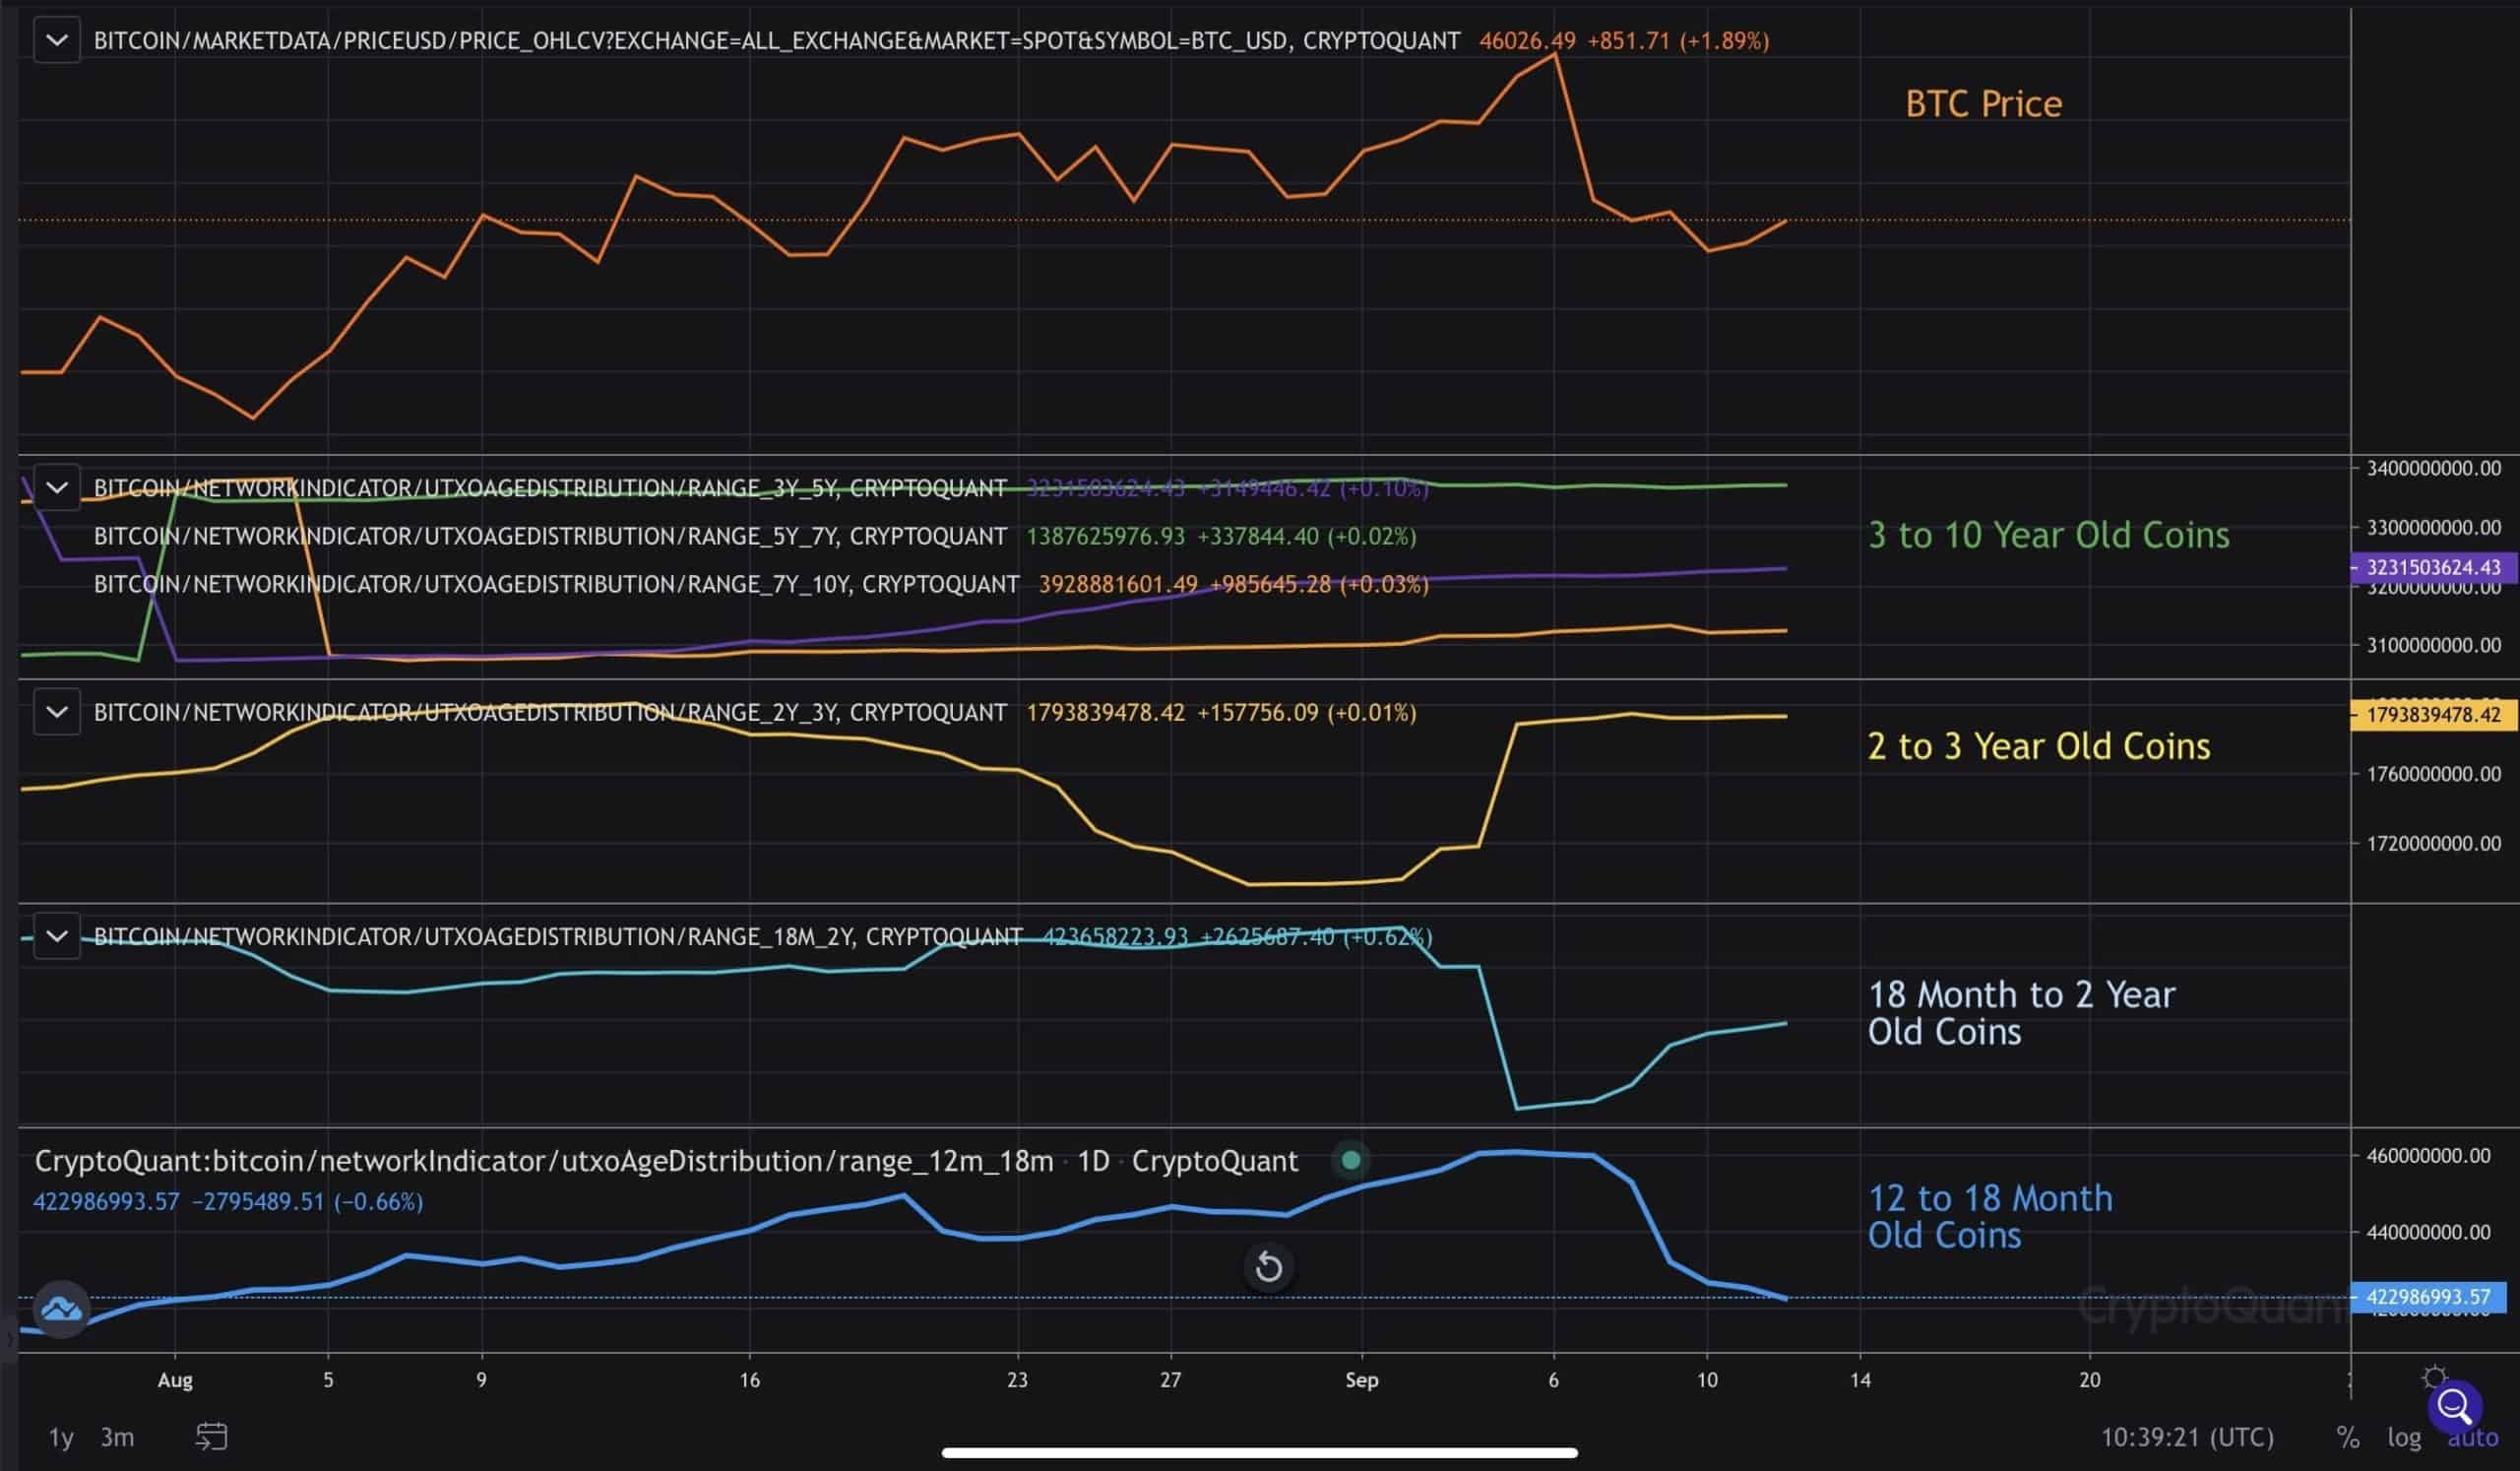
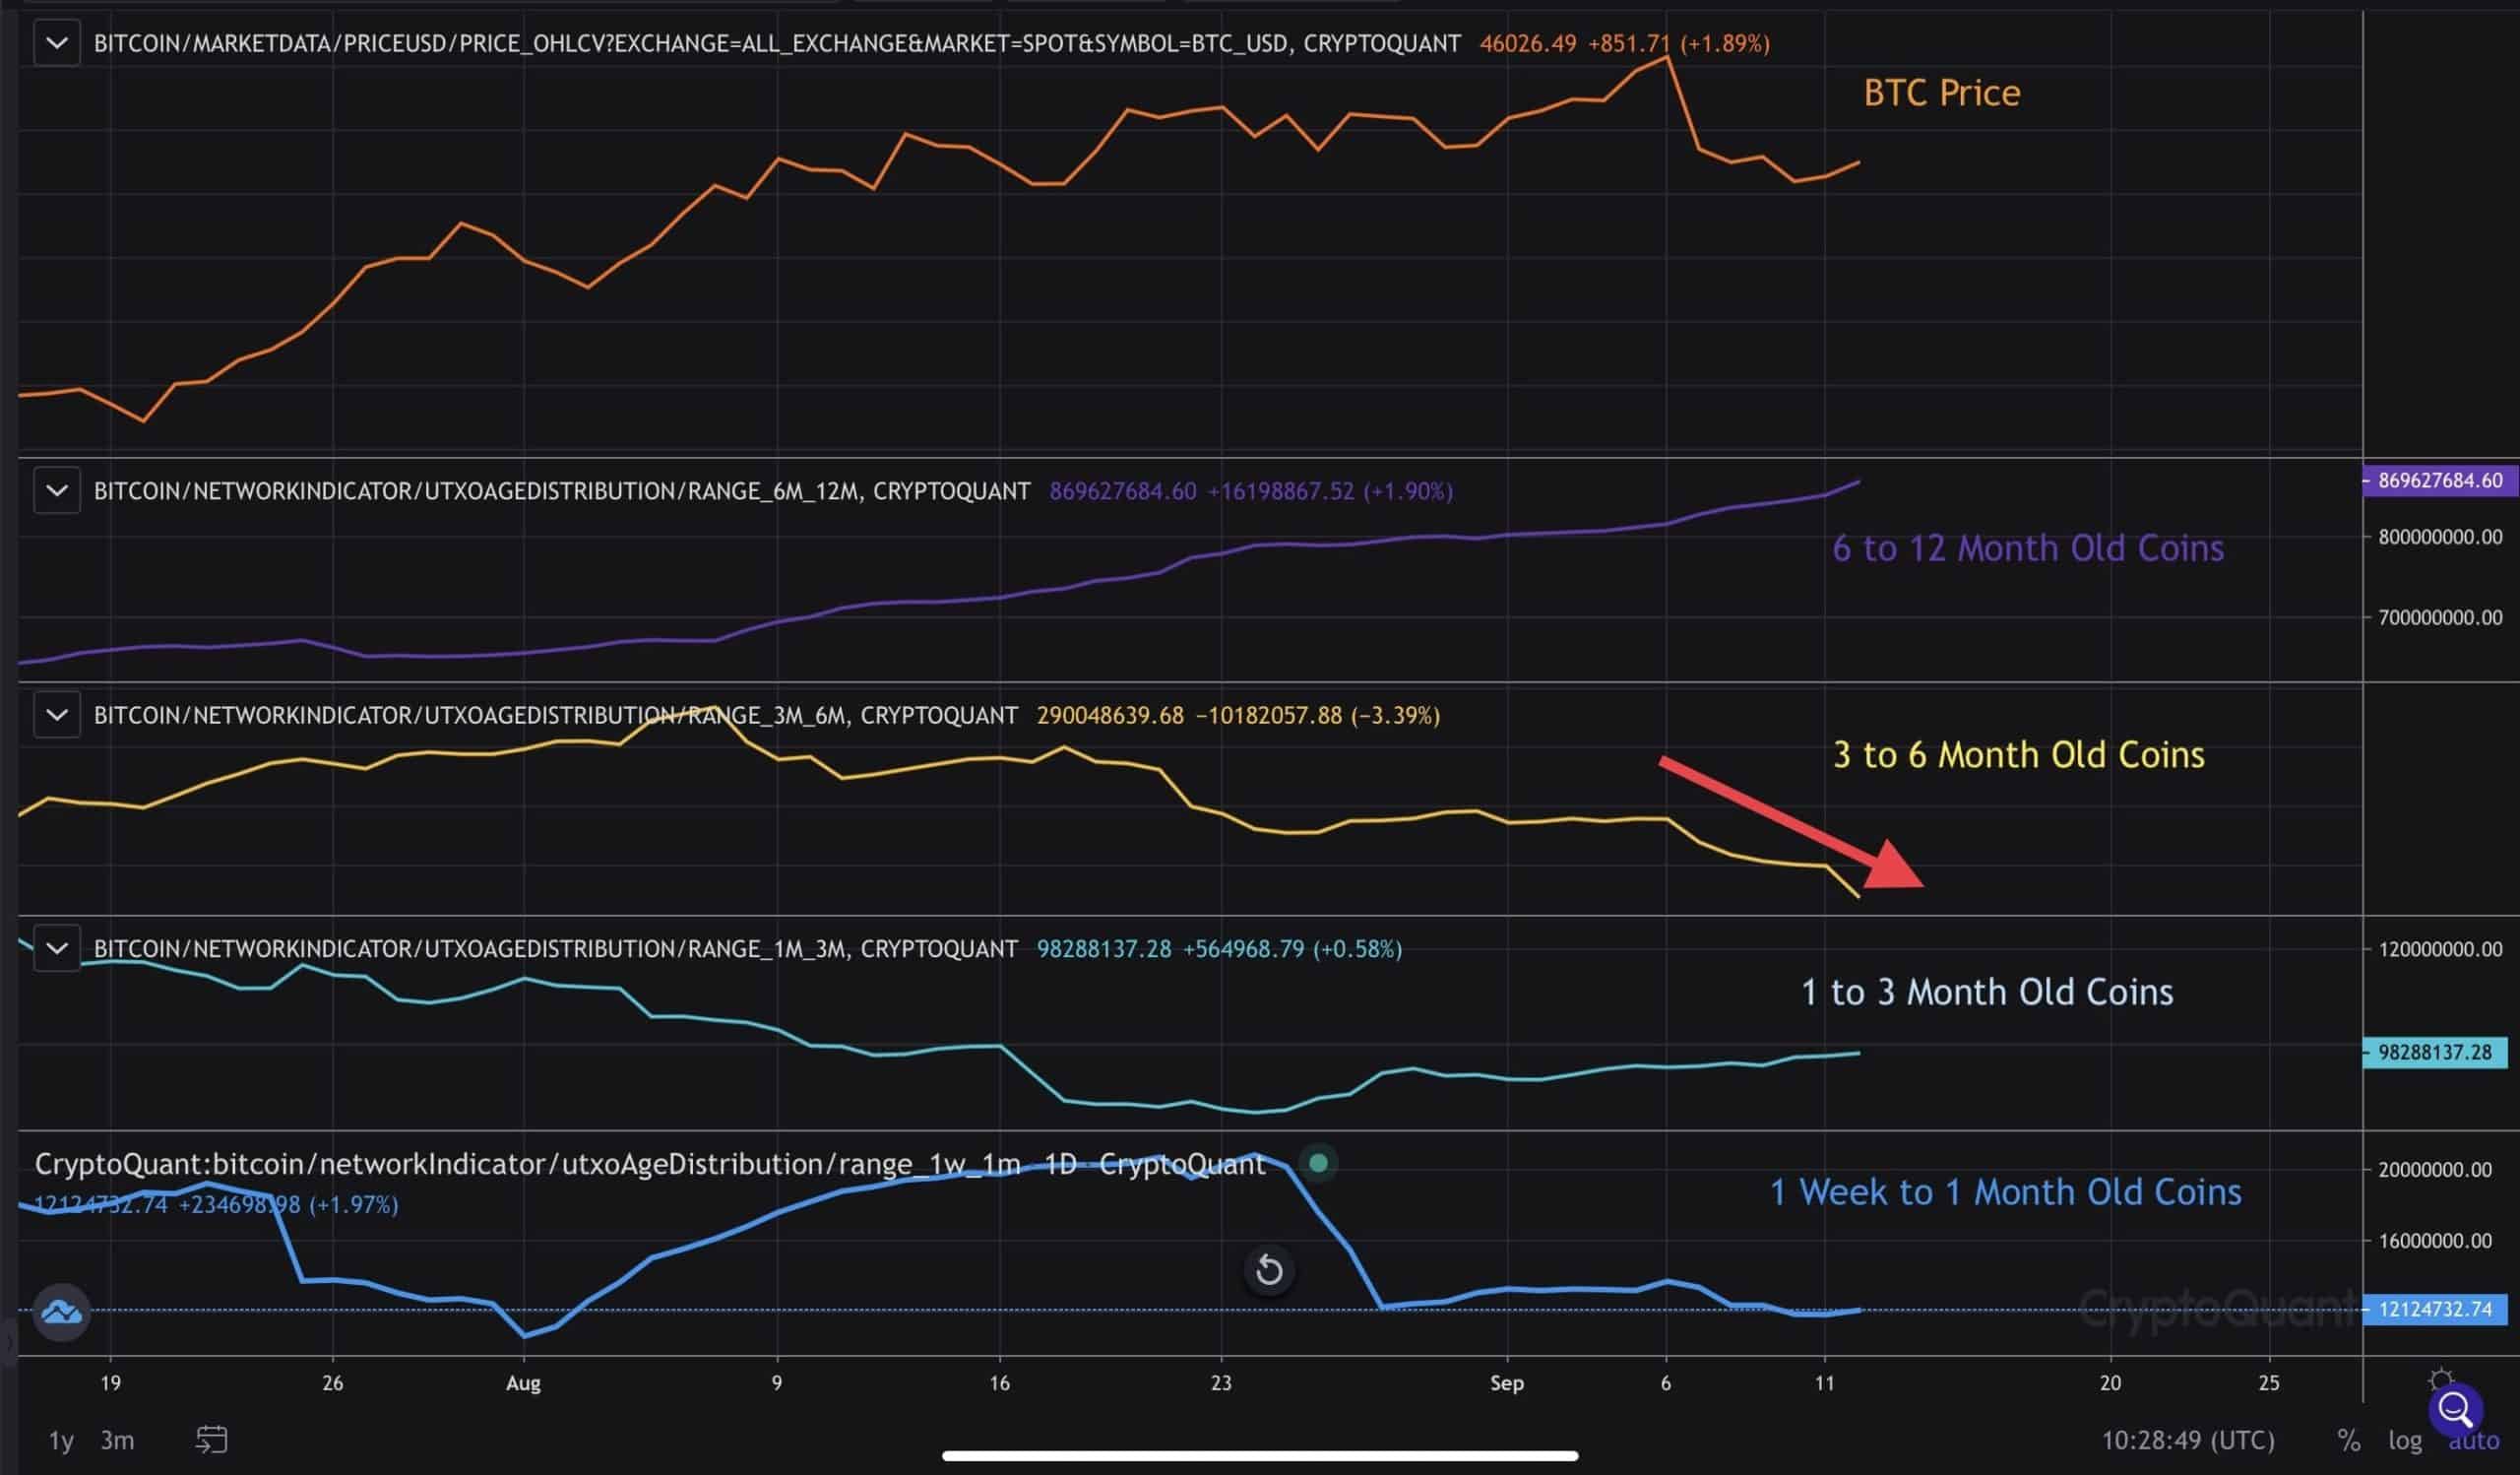
Overall, coins that are 12 months and older have been net accumulation during the correction, the 3 to 6-month-old coins have been selling. This data firmly suggests the pressure is coming from weak hands and that stronger hands continue to hold, refusing to sell at current prices.
Mean Coin Age Showing Strong Accumulation
Another on-chain metric called Mean Coin Age helps identify the distribution or re-accumulation of long-term holders in the market. Historically, during bull markets, long-term holders slowly distribute BTC as price increases. This continues as the price nears the peak of the bull market.
After the price peaks and the long-term holders have distributed large amounts of their holdings, BTC falls dramatically, encouraging the long-term holders to start reaccumulating.
The 2013 bull market had 2 major significant rallies, with a mid-cycle pullback in between. The mean coin age metric (blue line) showed distribution as BTC rallied earlier in 2013. Then, the mid-cycle pullback occurred, and the mean coin age started to increase, which signals the start of long-term holders re-accumulating.
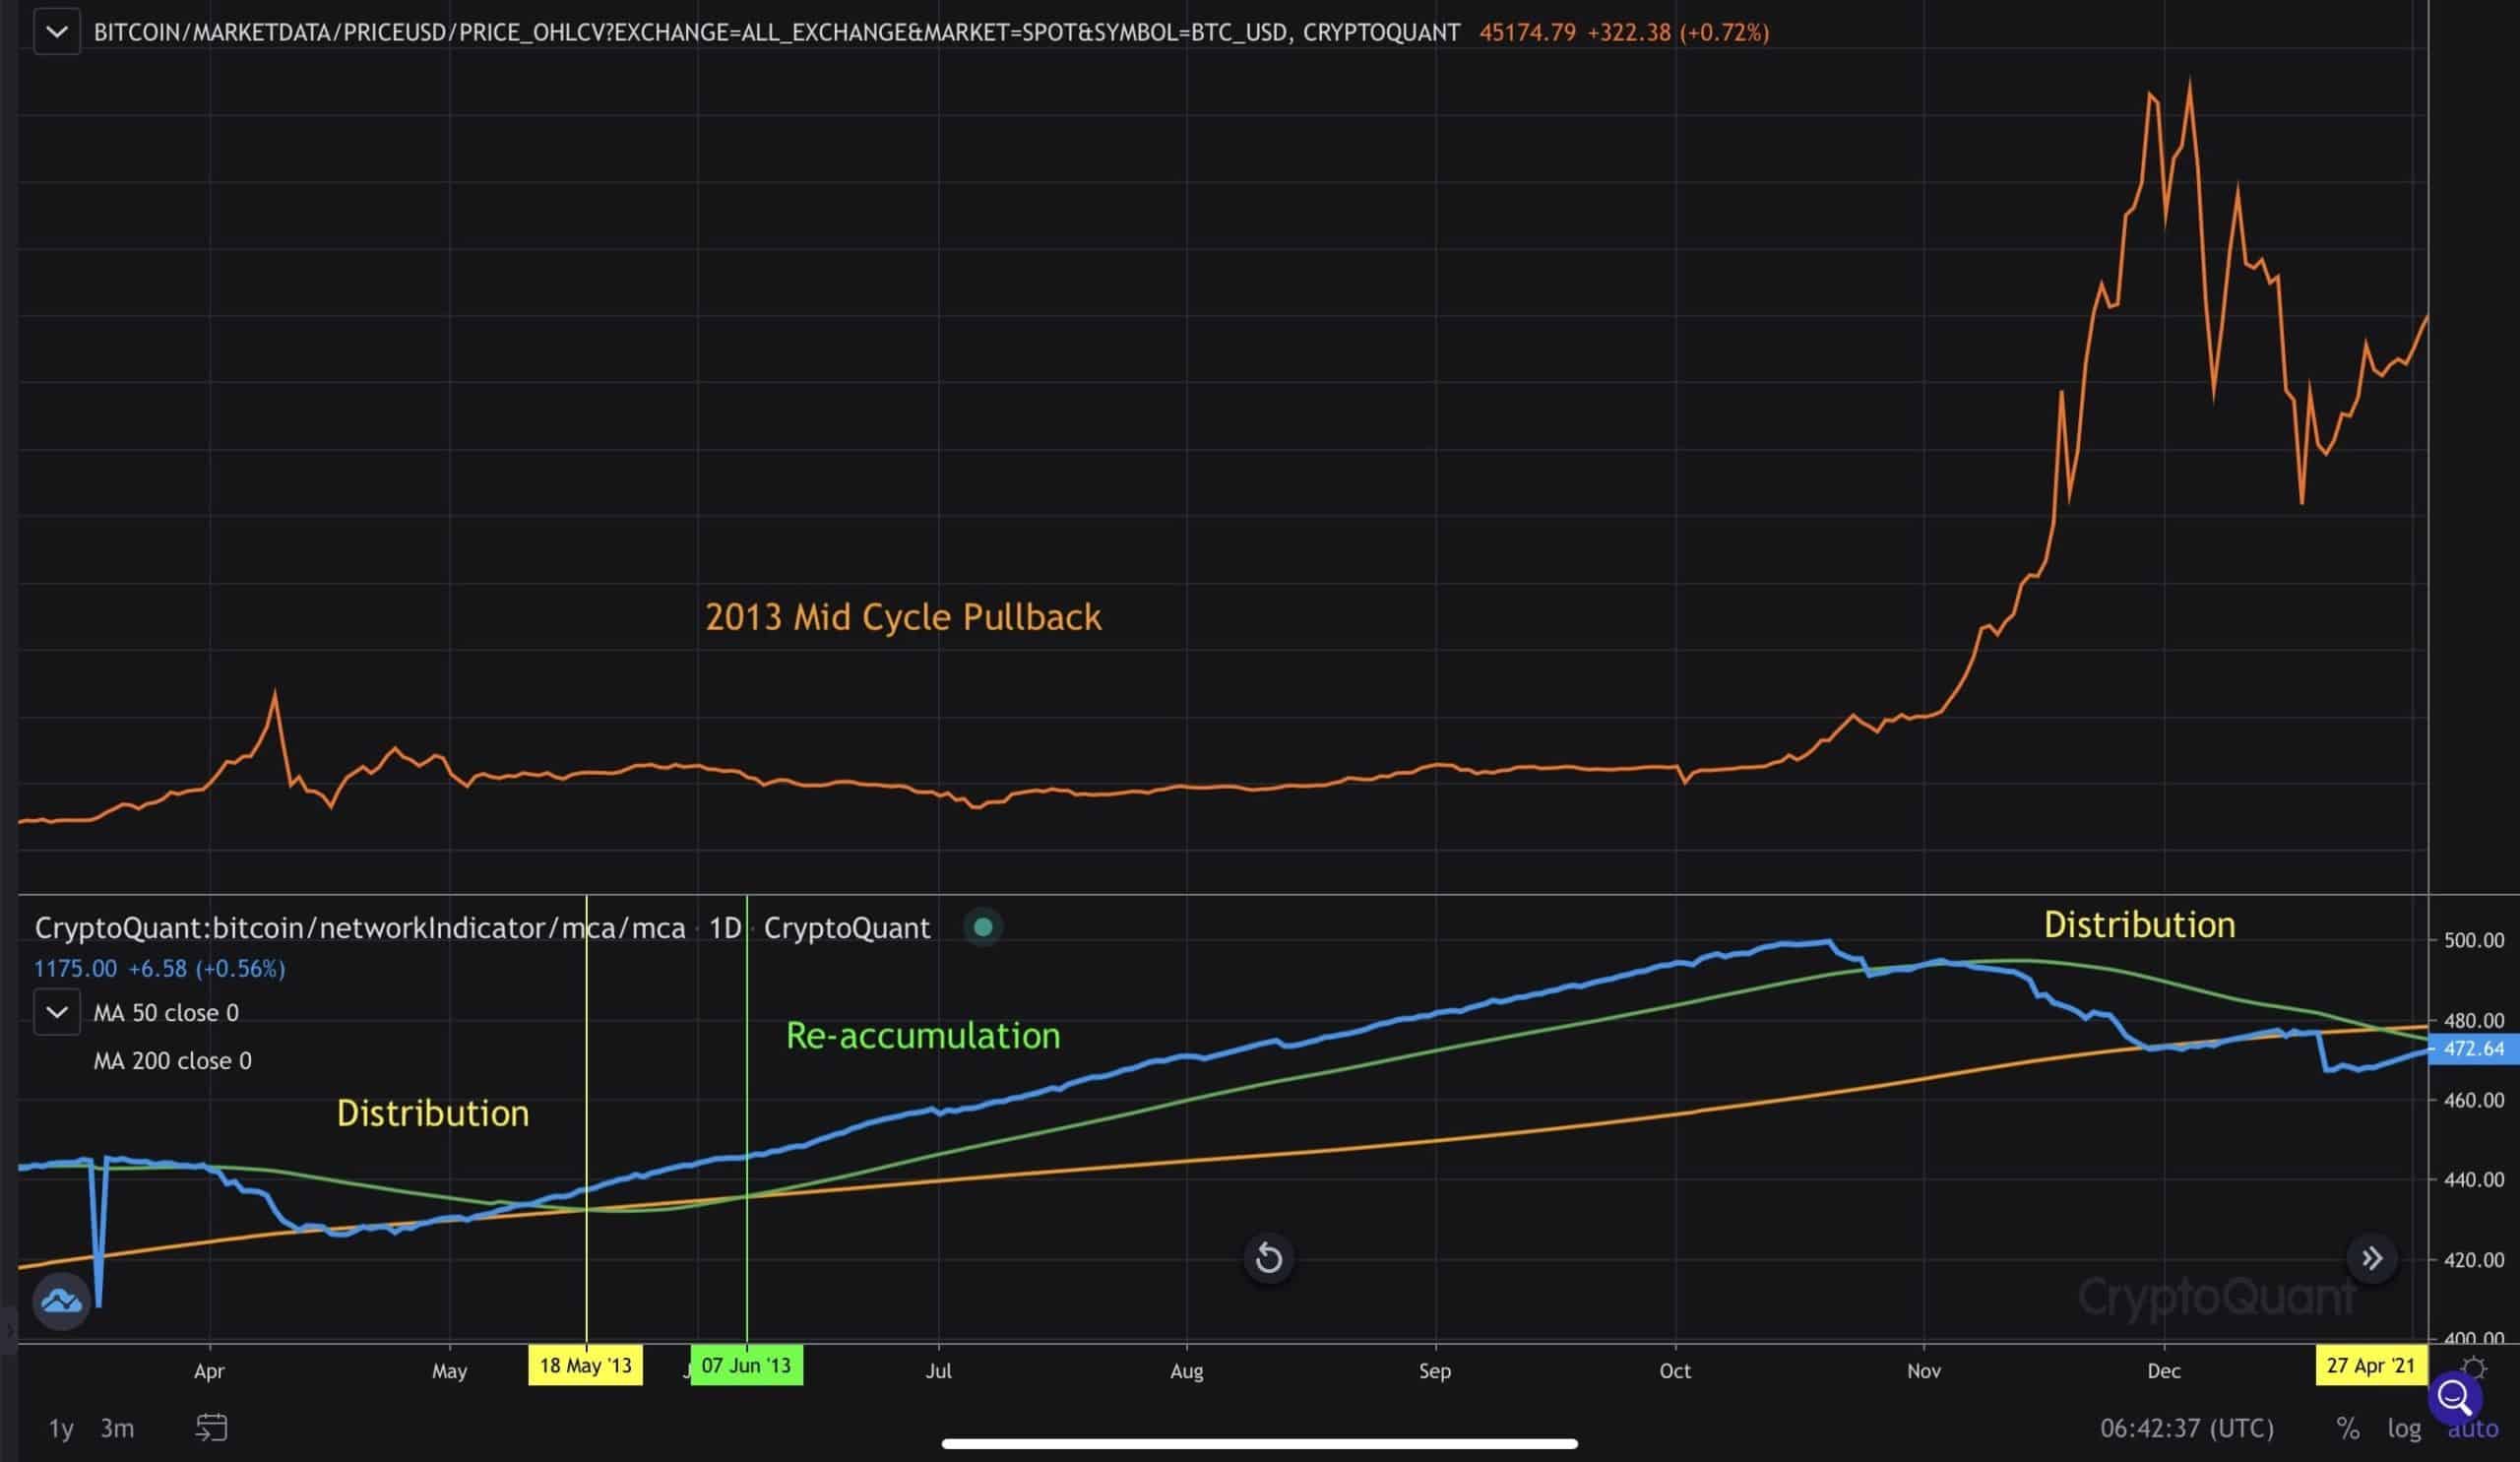
In the later part of 2013, BTC entered the parabolic phase where the price pushed higher significantly, causing the mean coin age to fall, confirming distribution.
The 2013 bull market cycle looks very similar to the current cycle when looking at the mean coin age metric. Earlier in 2021, the metric clearly showed distribution as long-term holders slowly took profit as BTC rallied from $30k to $64.8k. In May, the liquidation wipeout sent BTC down by 55%, causing the mean coin age metric to start increasing, indicating long-term holders were starting to re-accumulate.
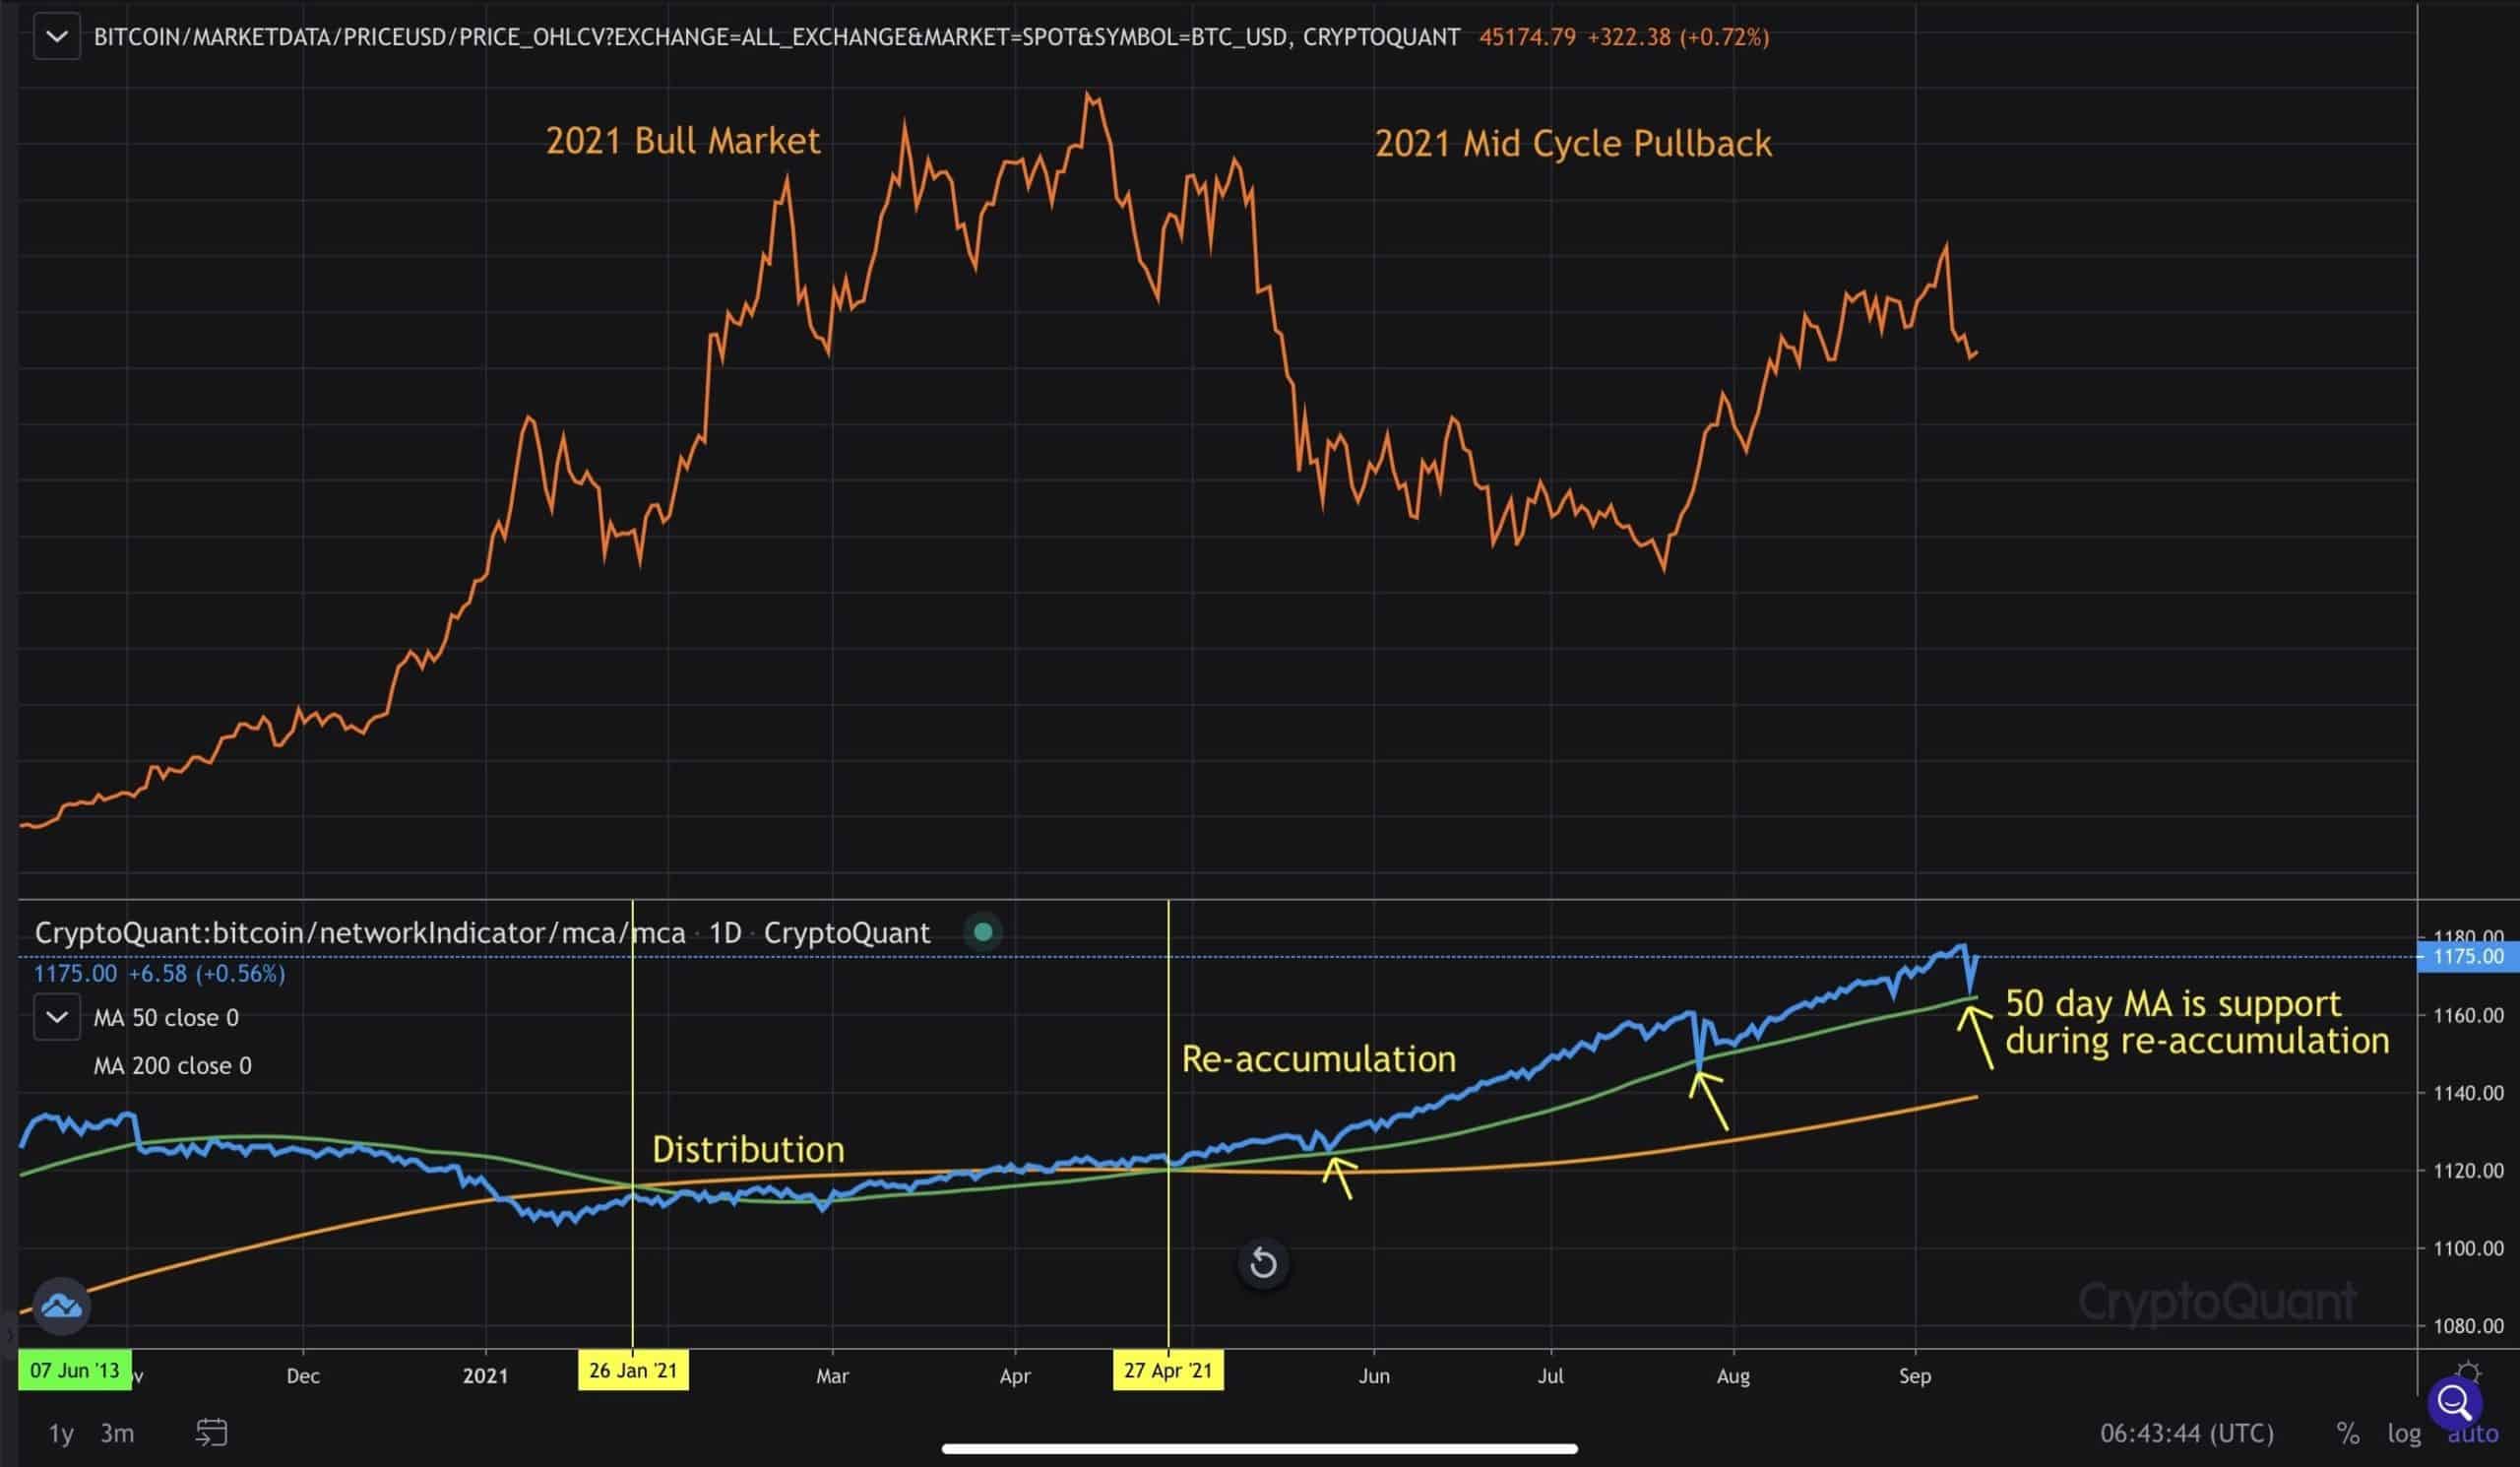
To this day, the mean coin age metric continues to trend higher, strongly suggesting the long-term holders continue to accumulate and are not the ones selling this pullback.
BTC Miners Accumulating
BTC miners also continue to net accumulate as miner reserves actually increased despite the sell-off. Overall outflows from miners to exchanges have been very low relative to earlier this year when they were selling between 10,000 to 40,000 BTC. Current miner outflows to exchanges average well below 2000 BTC per day. Most importantly, miner reserves have been holding and slowly increasing, which strongly indicates miners are not interested in selling at current prices.
Near Term Technicals
The near-term technicals are showing early potential signs of a bottom forming. The 4-hour chart has been showing bullish divergence where price makes a lower low while momentum indicators are trending higher. This will take time to play out, but so far, the 4-hour charts continue to show bullish divergence developing.
Volume has been falling, a signal of weakening selling pressure. The 4-hour Bollinger band has been squeezing over the weekend, indicating a large move could be coming soon. Long liquidations have been cooling off, with open interest holding around $9 billion.
Considering most of the selling is coming from 3 to 6-month-old coins who bought mostly between $50k to $64.8k, we can expect this cohort to eventually capitulate. Once the supply is exhausted, the price will likely start pushing higher and attempt to reclaim $47.2k and $50k.
BTC is currently intraweek below the 200-day, a critical level to hold on a weekly closing basis. Looking at the technical structure, it is very important for BTC to hold $42.8k, $42.6k, and $41.3k if near-term selling pressure continues. If BTC closes below $41.3k, this could damage the technical structure, increase downside risk, and invalidate the $30k to $40k trading range break out.
Outlook Remains Bullish
Despite a 20% pullback from the near-term highs at $52.9k, the overall trend in BTC fundamentals, technicals, and on-chain remain bullish as the data continues to show strong accumulation and weaker hands selling. We will have to see how global stocks perform this week after entering a near-term correction.
The macro environment continues to favor risk assets as the Federal Reserve is finding it more difficult to start tapering bond purchases. Meanwhile, the Federal Reserve balance sheet continues to make new all-time highs, reaching an astounding $8.3 trillion. This strongly suggests further upside for risk assets, including stocks and cryptocurrencies, as trillions in liquidity is searching for a store of value.
The mid to long-term outlook remains bullish as the trend in on-chain data remains firmly bullish and continues to support bull market continuation.
OhNoRipple via https://www.ohnocrypto.com/ @Daniel Joe, @Khareem Sudlow