Long Term Update: Critical Point
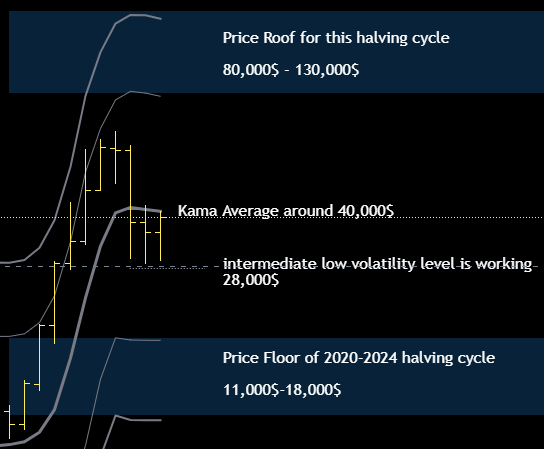
It is always better to look, as I always say, at larger time frames to understand how to build a winning operating strategy. I invite you first to look at this monthly chart of the BTCUSD, before commenting it.

We are clearly compressed in a price range well defined by the monthly average that defines the equilibrium point of this halving cycle (2020-2024) and an intermediate level with reduced volatility (around $28,000).
A Failure to move and to stay above the monthly Kama average would be bearish in my opinion and it would clearly be followed by a decline to the support zone of this halving cycle, between $11 and $18K.
With a confirmed break of the monthly average above $40,000 then the view would change and bitcoin would return to a position of strength that should bring it towards the resistance zone located between $80 and $130,000, in accordance with what I wrote in January in my “2021 outlook with entropic methods” where upper bound level was 121,000$
Bitcoin and the top of the previous cycle rule
Because of this rule i’m very skeptic to see bitcoin at 18,000$ or even lower inside the support price zone. Bitcoin in its history never tested the price level of the top of the previous halving cycle and if 29,000$ bottom is confirmed this rule will not be broken (29,000$ is above 2017 Top at around 20,000$).
What would a bottom in this cycle below 20,000$ imply? Well, it would mean that bitcoin’s long-term trend is slowing down and we would probably have to wait for the next halving cycle, after 2024, to see a Top above the current one at $64,000. Thus, as i wrote in this post title, we are at a critical point in time to understand what scenario bitcoin will go into.
The Big Picture

Here you can see what I said before, the Top of a halving cycle is always lower than the bottom of the next cycle, I interpret this as a strong bullish signal of the fundamental trend of bitcoin.
To conclude many of you are probably asking why the hell i sold below 29,000$ if there was an intermediate support slightly lower, well once i define a strategy with a trailing profit order i prefer to avoid to continously change it to accomodate what the market does, i had already moved the trailing profit order from 35,000$ down to 29,000$ to contain the volatility of bitcoin and it worked for several weeks then some bad luck damaged me, however this is all part of trading and i’m not upset at all.
OhNoCrypto
via https://www.ohnocrypto.com
CryptoAdvisor, @KhareemSudlow
