
IOTA price analysis: MIOTA/USD shows weakness near crucial resistance line

If bears push MIOTA lower, the main support levels could be at $0.50 and $0.40
IOTA’s price is down by 2.4% in the last 24 hours, with the past week’s losses now into double digits at over 18%. While the downtrend has seen IOTA lose over 35% since mid-June, its bearish outlook has largely mirrored that of Bitcoin (BTC) and other large-cap cryptocurrencies.
At current prices of $0.67, the altcoin is struggling for an upside after an extended downturn from highs of $2.68 in April.
In terms of its market cap, IOTA has rapidly shrunk to see it drop from among the top 20 to 50th according to market data site CoinGecko.
MIOTA price analysis
IOTA peaked at $2.68 on 16 April but has been in a downtrend since. The 4-hour chart shows that MIOTA bounced off lows of $0.61 on 22 June, with the upside from the horizontal support pushing prices inside an ascending channel to highs of $0.93 on 7 July.
However, IOTA’s price again moved lower amid widespread bleeding in the crypto market. The rot has kept the altcoin’s price below a descending trendline, with bears succeeding in breaching the horizontal support line at $0.68 to retest $0.64 on 17 July.
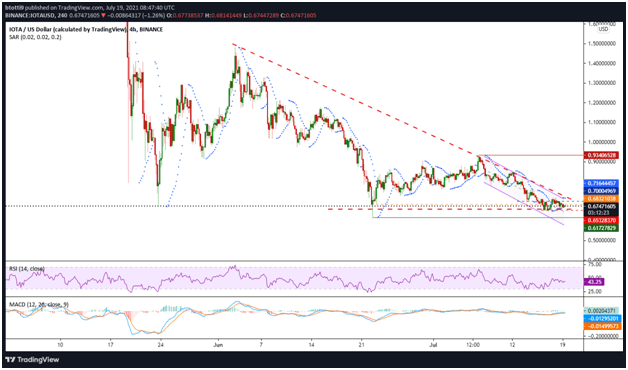
A descending triangle pattern has formed to suggest a downward continuation. The parabolic SAR also suggests further struggles for the bulls with the dotted lines above the current price level. The RSI sitting below the 50-point mark also lends credence to the possibility of a renewed downtrend. This will strengthen if prices flip lower towards the channel’s middle line.
The MACD indicator likewise suggests weakness, although a bullish crossover recently flashed on the 4-hour chart, which means bulls are not out of the game yet. The buy signal is fading, however, as shown by the shrinking MACD histogram.
At the time of writing, the IOTA price faces a stubborn barrier at the crucial resistance line at $0.70, from which a bearish trendline has recently extended the downsloping action. As long as bulls don’t cross the line, bears will retain the upper hand.
If new losses occur, expect bears to eye the $0.60 and $0.54 price levels, with potential anchors in case of another breakdown likely at $0.50 and then $0.40.
The post IOTA price analysis: MIOTA/USD shows weakness near crucial resistance line appeared first on Coin Journal.
OhNoCrypto
via https://www.ohnocrypto.com
Benson Toti, @KhareemSudlow