
Dogecoin price analysis: DOGE dips 8% as BTC struggles amid fresh losses

DOGE price is now nearly 77% down from its all-time high, even after gaining 366% in Q2
A massive rally during Q2 saw DOGE break into the top cryptocurrencies
Dogecoin price has declined by 8% in the past 24 hours, and over 18% over the past week. The downturn leaves the meme coin trading at around $0.164.
DOGE’s value is seeing the reverse as the overall crypto market battles fresh downward pressure. In the last 24 hours, top cryptocurrencies by market cap Bitcoin (BTC) and Ethereum (ETH) have fallen below major support levels. BTC is currently battling to stay above $29,700, while ETH is changing hands around $1,750 and is vulnerable to more losses.
After starting 2021 valued at just $0.004, Dogecoin’s price rose to an all-time high above $0.73 on 8 May, making it one of the best performing altcoins over the previous quarter. According to a recent report by CoinGecko, “Dogecoin flew to the moon as it gained 366% and outperformed the [top five] cryptocurrencies.”
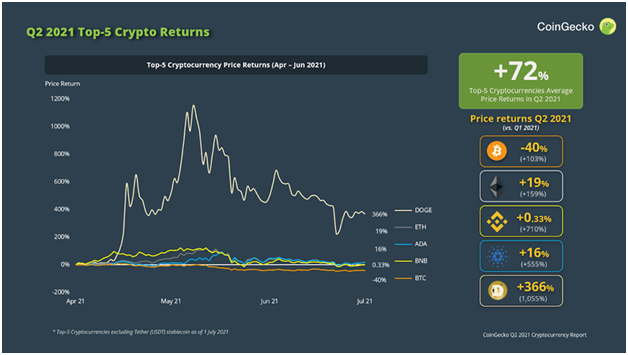
However, DOGE/USD has seen a brutal correction wipe out most of the gains, with current prices nearly 77% down since the all-time high.
Looking at the technical picture for Dogecoin, it appears the bears still hold the upper hand and prices might take yet another dip.
Dogecoin price outlook
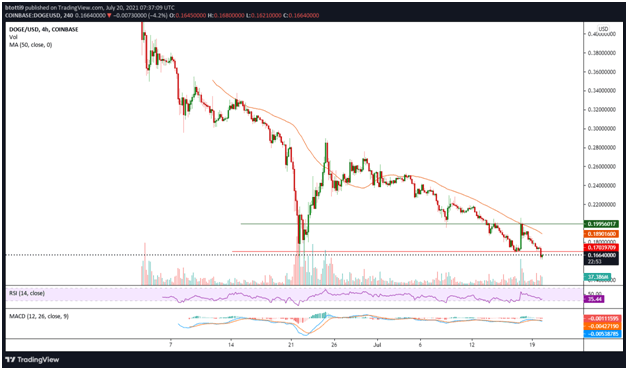
On the 4-hour chart, DOGE has retested and broken below a vital horizontal support area near $0.17. The price is also still below the 50-day moving average, which has a sloping curve.
Meanwhile, the RSI and MACD on the time frame also suggest a bearish hold, with the latter indicator increasing in the negative territory.
On the daily chart, DOGE/USD has bounced lower after bulls failed to break above resistance at $0.21. The downturn includes a dip to support at $0.15, although a slight uptick in buying has pushed it above $0.16.
But the successive red candlesticks suggest that bears are not ready to give up any ground yet.
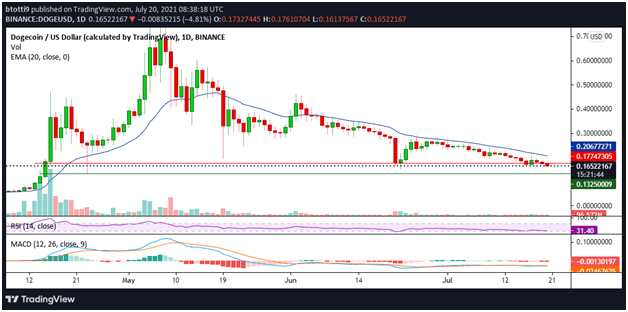
The RSI and MACD are all supporting a bearish outlook, with the 20-day EMA providing the main barrier at $0.206. The $0.15 zone remains the key price area to watch, but if sellers manage to break lower, DOGE/USD could decline to $0.13 and then $0.10.
While the price has struggled for an upside, the 24-hour trading volume is up by about 4.16% over the period, tying in with the 1,250% spike seen over Q2. It suggests bulls are keen to buy the latest dip even as they look to defend the $0.15-$0.13 support zone.
The post Dogecoin price analysis: DOGE dips 8% as BTC struggles amid fresh losses appeared first on Coin Journal.
OhNoCrypto
via https://www.ohnocrypto.com
Benson Toti, @KhareemSudlow