
TA: Ethereum Dips Below $2K, Here’s What Could Trigger A Fresh Increase
Ethereum extended its decline below the $2,000 support against the US Dollar. ETH price is now consolidating losses and it could start a fresh increase if it clears $2,010.
- Ethereum extended its decline below the $2,050 and $2,000 support levels.
- The price is now trading well below $2,050 and the 100 hourly simple moving average.
- There is a major bearish trend line forming with resistance near $2,065 on the hourly chart of ETH/USD (data feed via Kraken).
- The pair could start a decent increase if it clears the $2,010 resistance zone.
Ethereum Price Steadies Above $1,950
After another failure above $2,100, Ethereum started a downside correction. ETH traded below the $2,050 and $2,010 support levels. It even broke the $2,000 level and settled below the 100 hourly simple moving average, similar to bitcoin.
A low was formed near $1,937 before the price started a short-term upside correction. Ether climbed above the $1,960 and $1,975 levels. There was a break above the 23.6% Fib retracement level of the recent drop from the $2,132 high to $1,937 low.
It seems like the price is now forming a breakout pattern with resistance near $2,010. A clear break above the $2,010 resistance could lead the price towards the $2,035 level.
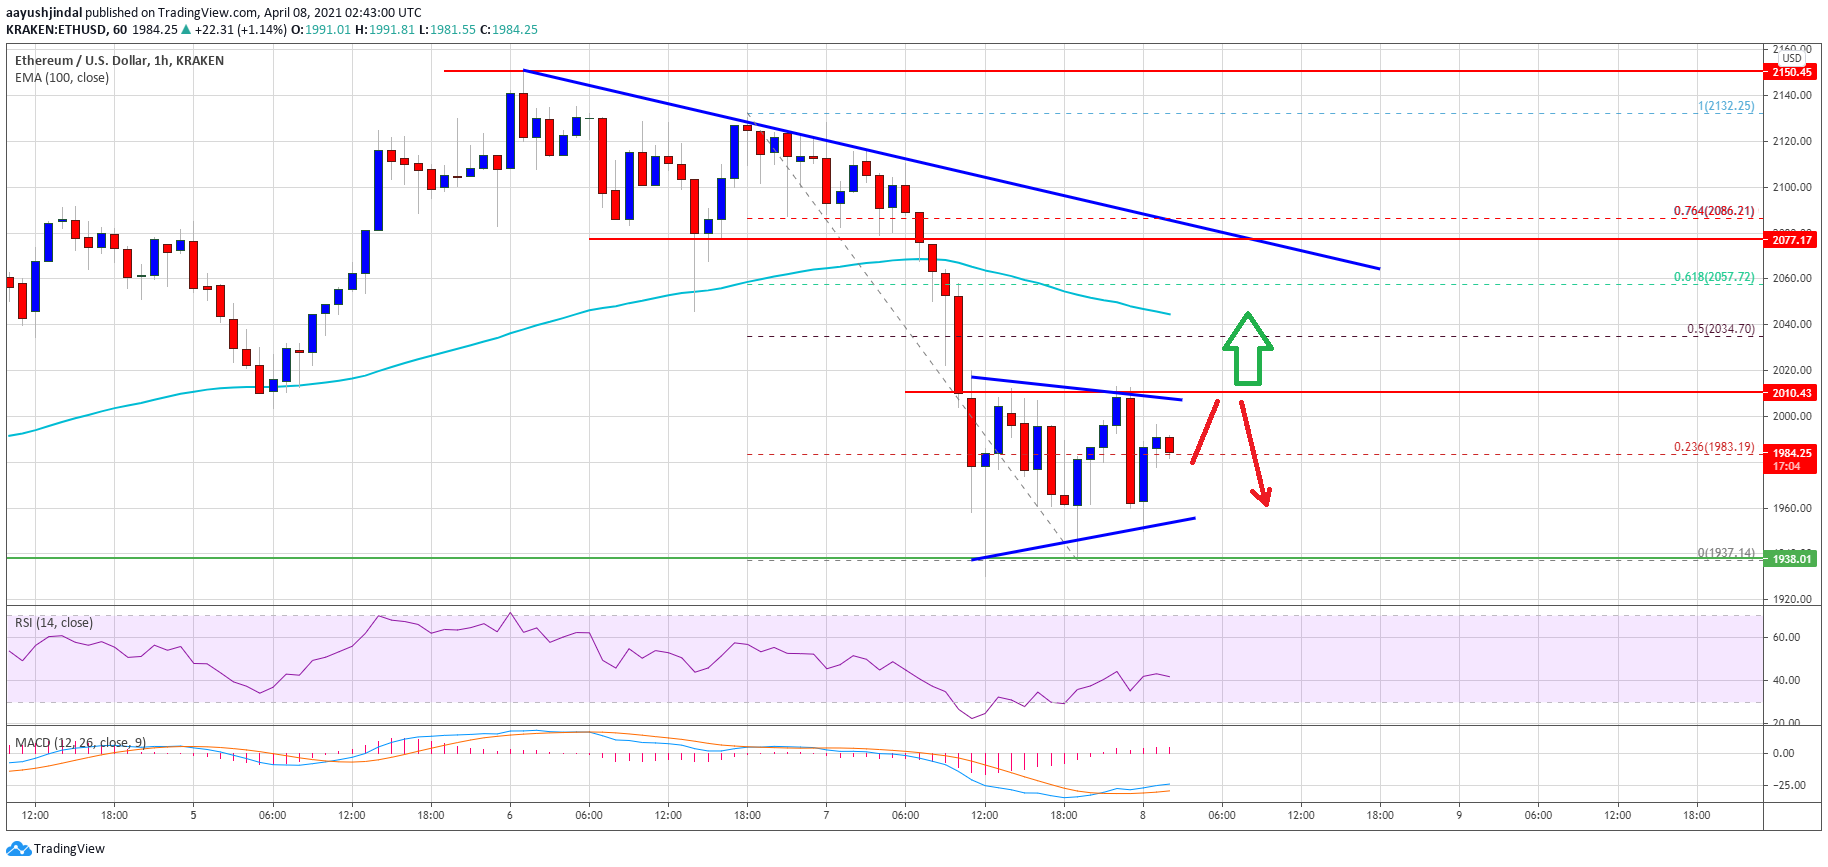
Source: ETHUSD on TradingView.com
The 50% Fib retracement level of the recent drop from the $2,132 high to $1,937 low is near $2,050 to act as a resistance. There is also a major bearish trend line forming with resistance near $2,065 on the hourly chart of ETH/USD.
To move into a bullish zone, ether price must break the $2,010 resistance and then gain strength for a move above the trend line resistance.
More Losses in ETH?
If Ethereum fails to clear the $2,010 resistance, it could correct further lower. The first major support is now forming near the $1,960 level and the triangle lower trend line.
The main support is now near the $1,940 level. A clear downside break below the triangle support and the $1,940 zone could lead the price towards the $1,880 support level in the coming sessions. Any more losses will most likely call for a test of $1,850.
Technical Indicators
Hourly MACD – The MACD for ETH/USD is slowly gaining momentum in the bullish zone.
Hourly RSI – The RSI for ETH/USD is now approaching the 50 level.
Major Support Level – $1,960
Major Resistance Level – $2,060
OhNoCrypto
via https://www.ohnocrypto.com
Aayush Jindal, @KhareemSudlow