
TA: Bitcoin Settles Above 100 SMA, Why BTC Could Retest $60K

Bitcoin price started a fresh increase and it cleared the $58,250 resistance against the US Dollar. BTC is now showing positive signs and it might soon revisit $60,000.
- Bitcoin started a fresh increase above the $58,000 and $58,250 resistance levels.
- The price is now trading nicely above $58,250 and the 100 hourly simple moving average.
- There was a break above a major bearish trend line with resistance near $58,650 on the hourly chart of the BTC/USD pair (data feed from Kraken).
- The pair is now consolidating above the 100 hourly SMA and it might continue higher towards $60,000.
Bitcoin Price Breaks Key Resistance
Bitcoin formed a support base above the $57,000 level and recently started a fresh increase. BTC broke a couple of key hurdles near $57,500 and $58,250 to move into a positive zone.
There was a break above the $58,500 resistance zone and the 100 hourly simple moving average. Moreover, there was a break above a major bearish trend line with resistance near $58,650 on the hourly chart of the BTC/USD pair.
The pair settled nicely above the $58,250 level and the 100 hourly SMA. It traded as high as $59,467 and it is currently consolidating gains. It is trading just below the 23.6% Fib retracement level of the recent wave from the $56,810 low to $59,467 high.
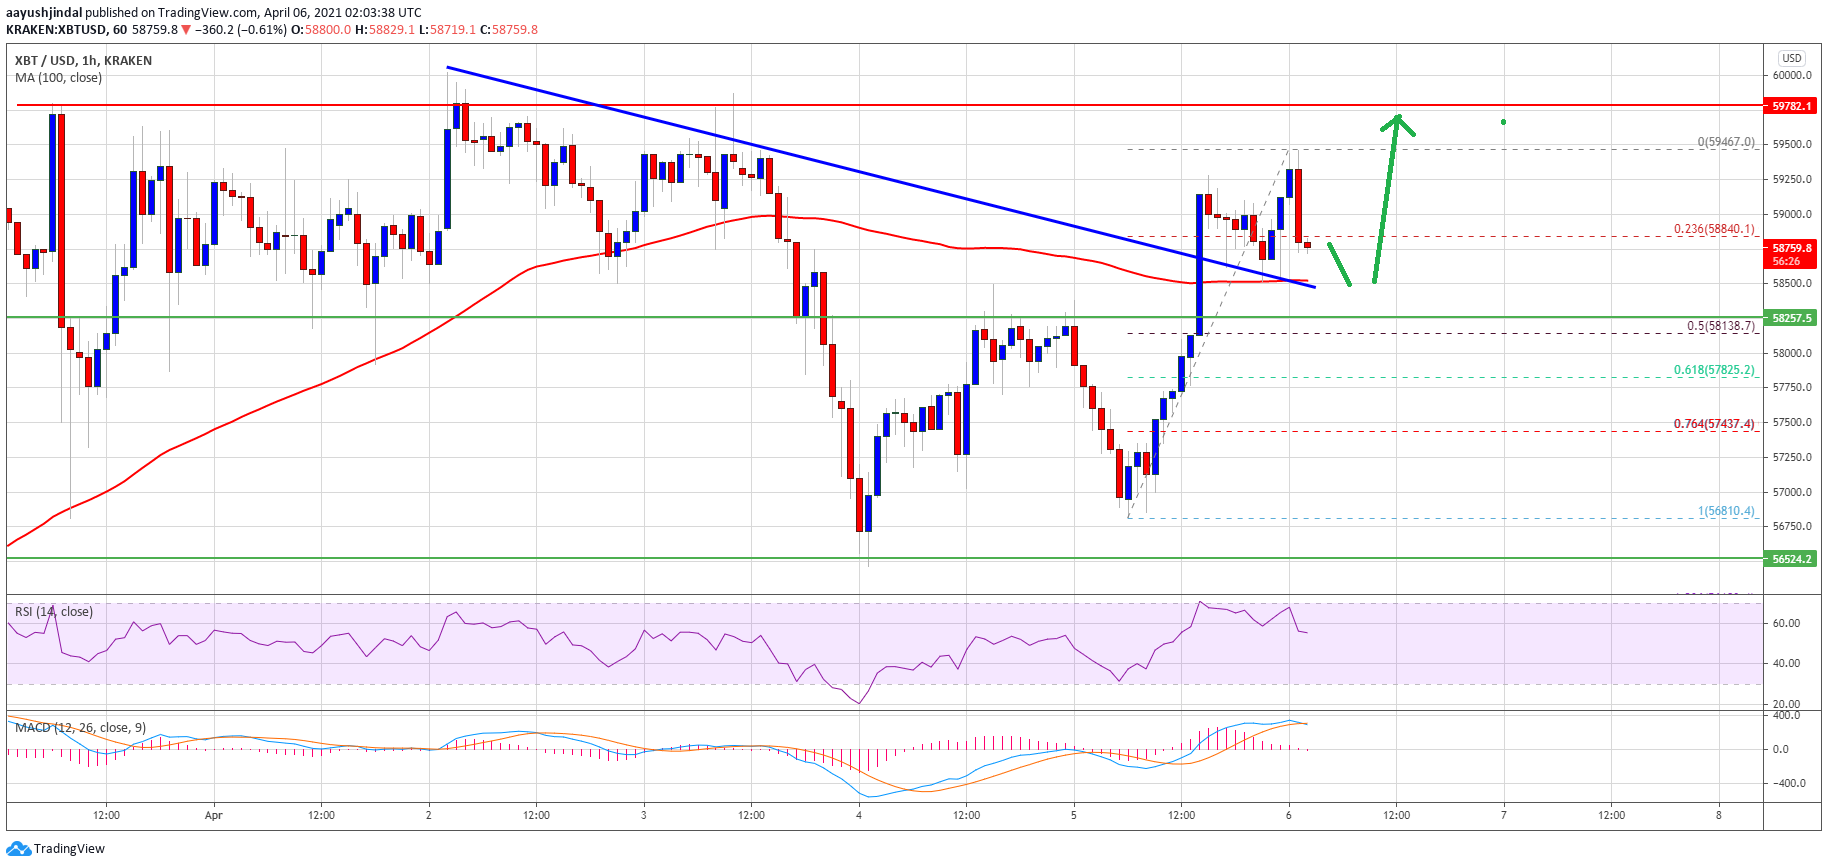
Source: BTCUSD on TradingView.com
An initial support is near the $58,500 level and the 100 hourly simple moving average. An immediate resistance is near the $59,000 level, followed by the $59,467 high.
The main resistance is still near the $60,000 level. If there is an upside break above $60,000, there are chances of a steady increase towards the $62,000 zone in the near term.
Dips Limited in BTC?
If bitcoin fails to climb above $59,000 and $59,500, there could be a downside correction. The first major support on the downside is near the $58,500 level and the 100 hourly SMA.
The next major support is near the $58,250 level (the recent breakout zone). It is close to the 50% Fib retracement level of the recent wave from the $56,810 low to $59,467 high. Any more losses might lead the price towards the $57,500 support zone in the coming sessions.
Technical indicators:
Hourly MACD – The MACD is slowly losing momentum in the bullish zone.
Hourly RSI (Relative Strength Index) – The RSI for BTC/USD is now above the 50 level.
Major Support Levels – $58,500, followed by $58,250.
Major Resistance Levels – $59,000, $59,500 and $60,000.
BTC, bitcoin, btcusd, BTCUSDT, xbtusdRead More
OhNoCrypto
via https://www.ohnocrypto.com
, Khareem Sudlow