
Many Bitcoin Analysts Call For Rally Beyond $70,000; Here’s Why
Bitcoin traders and analysts are sticking to their conviction that the cryptocurrency’s price will hit at least $70,000 in the coming sessions.
At the core of their upside outlook lies a classic technical indicator. Dubbed as Ascending Triangle, the pattern forms when an asset forms two or more rising troughs and almost equal highs in conjugation. The trendlines connecting these dots converge as the price rises, making it appear like a rising triangle.
Bitcoin Bullish Structure? Check.
Bitcoin ticks almost all boxes when it comes to confirming that it is forming an Ascending Triangle. The cryptocurrency’s two-month-old structure prompted it to test levels around $60,000 repeatedly as resistance. Meanwhile, the price kept rising while treating a rising trendline as support. The only link missing is a breakout to the upside.
“When this breaks above $60,000 with conviction, don’t stand in the way,” one analyst proclaimed on Twitter.

Bitcoin bullish triangle structure, as shared by CryptoHornHairs. Source: BTCUSD on TradingView.com
The bullish triangle breakouts tend to shift the asset’s upside target at a level above the widest distance between the upper and lower trendline. Applying these theoretical definitions on the Bitcoin charts ensure that it would break above $75,000 in the coming sessions. $70,000 remains a psychological resistance target.
Bitcoin analyst Josh Olszewicz confirmed that a breakout move would push the bitcoin price towards $75,000. Thereon, the cryptocurrency would start consolidating in the $70,000-75,000 area. Meanwhile, another analyst — albeit a pseudonymous one — provides fundamental catalysts that could make the explosive bullish move happen.
Coinbase IPO FOMO
Pentoshi, a widely-followed Twitter account, noted that the upcoming direct listing of Coinbase, a US-based cryptocurrency exchange, on Nasdaq, would serve as a tailwind to technically bullish structures. In his opinion, Bitcoin is consolidating inside a Symmetrical Triangle — another technical indicator professing an asset’s bullish continuation bias.
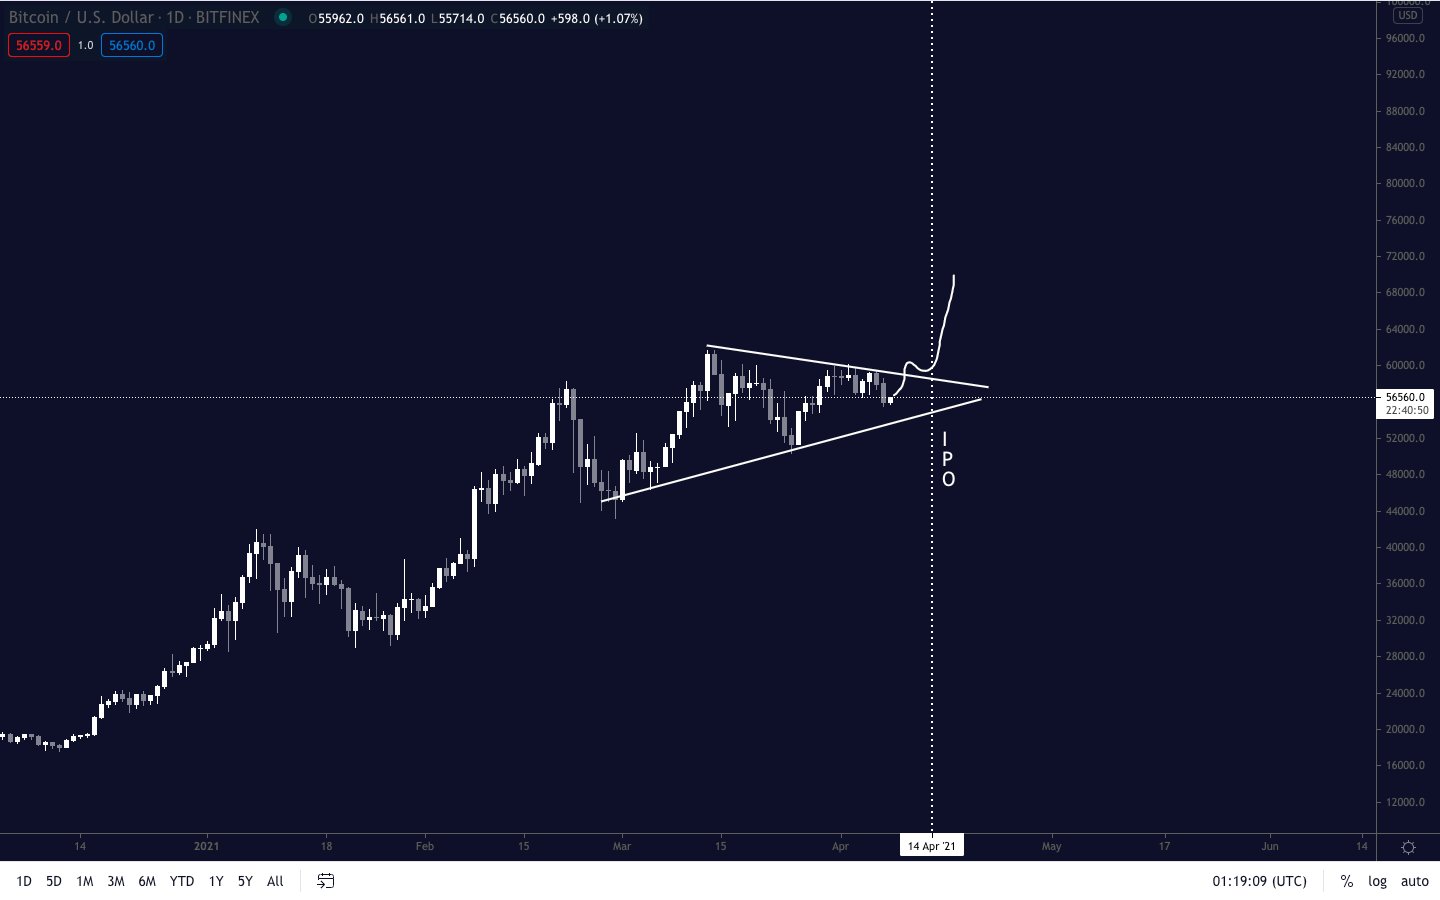
Bitcoin symmetrical triangle structure. Source: BTCUSD on TradingView.com
“CB IPO is now 6 days out. BTC supply is at new all-time lows. Yet, no announcements of new holdings,” the independent analyst wrote.
“I feel a lot of companies could/will announce around that time to capitalize off the momentum. Combined with hype at Influx of new money that CB [custody], moon,” he added.
But technical indicators are not always accurate. A study conducted by Samurai Trading Academy shows that Ascending Triangles have a success rate of 72.77 percent. Meanwhile, the possibility that bitcoin breaks above its symmetrical triangle structure stand further lower at 54.87 percent (considering it also appears like a bullish pennant).
Photo by Mark Boss on Unsplash
OhNoCryptocurrency via https://www.ohnocrypto.com/ @Yashu Gola, @Khareem Sudlow