
Charted: Ripple (XRP) Skyrockets, Why Break Above $1 Seems Likely
Ripple extended its rally above the $0.8000 resistance zone against the US Dollar. XRP price even tested $0.9500 and it is now consolidating gains.
- Ripple started a strong surge above the $0.8000 and $0.9000 levels against the US dollar.
- The price is now trading nicely above $0.8000 and the 100 simple moving average (4-hours).
- There was a break above a couple of bullish continuation patterns at $0.6000 and $0.7180 on the 4-hours chart of the XRP/USD pair (data source from Kraken).
- The pair is now consolidating gains and it might continue to rise towards $1.00 in the near term.
Ripple’s XRP Price Extends Rally
In the past three sessions, ripple’s XRP gained strength above $0.6000, unlike bitcoin and ethereum. XRP broke many hurdles near $0.6500 to move further into a positive zone.
During the increase, there was a break above a couple of bullish continuation patterns at $0.6000 and $0.7180 on the 4-hours chart of the XRP/USD pair. The pair even cleared the $0.8000 and $0.9000 resistance levels. A new multiweek high is formed near $0.9443.
The price is now trading nicely above $0.8000 and the 100 simple moving average (4-hours). XRP is now consolidating gains above the $0.8500 level.
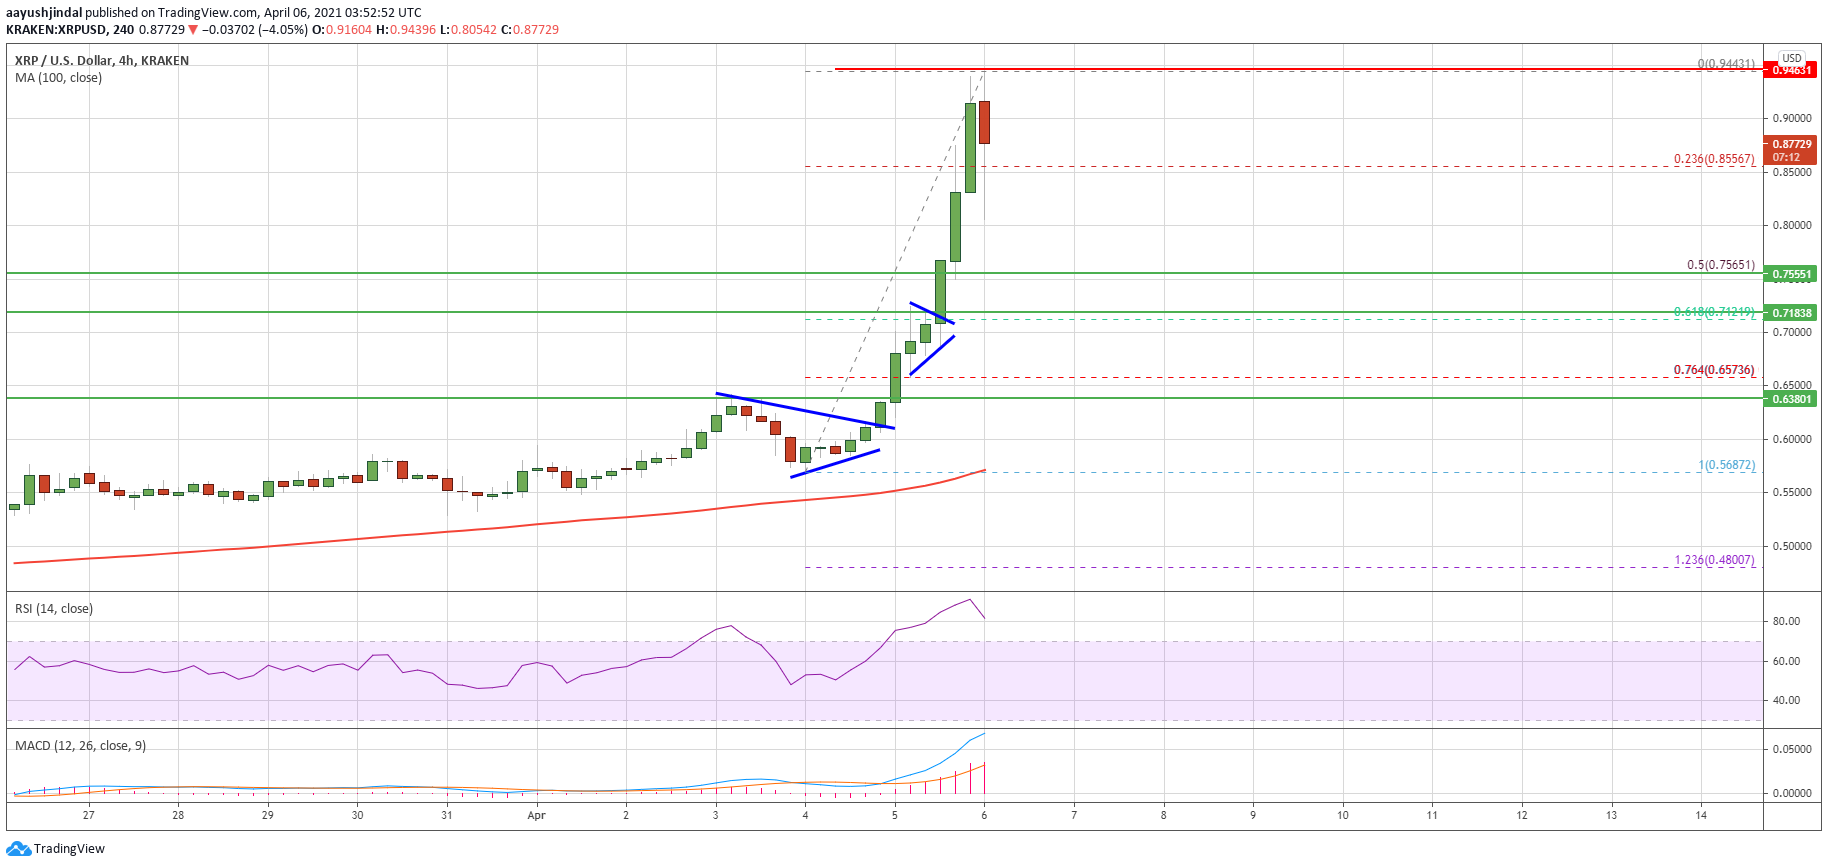
Source: XRPUSD on TradingView.com
An initial support is near the $0.8550 level. It is near the 23.6% Fib retracement level of the recent surge from the $0.5688 swing low to $0.9443 high. On the upside, the $0.9000 level is an immediate resistance. The next major resistance is near the $0.9500 level. A successful close above the $0.9500 level is likely to set the pace for more gains above the main $1.00 barrier in the coming sessions.
Dips Supported in XRP?
If ripple fails to clear the $0.9000 resistance or $0.79500, it could start a fresh downside. An initial support on the downside is near the $0.8550 level.
The first major support is near the $0.7550 level. It is near the 50% Fib retracement level of the recent surge from the $0.5688 swing low to $0.9443 high. Any more losses might call for a drop towards the $0.5500 support zone. Moreover, the 100 simple moving average (4-hours) is also near $0.5500.
Technical Indicators
4-Hours MACD – The MACD for XRP/USD is slowly losing pace in the bullish zone.
4-Hours RSI (Relative Strength Index) – The RSI for XRP/USD is now in the overbought zone.
Major Support Levels – $0.8550, $0.8000 and $0.7500.
Major Resistance Levels – $0.7250, $0.7500 and $0.8000.
OhNoCrypto
via https://www.ohnocrypto.com
Aayush Jindal, @KhareemSudlow