
Charted: Cardano (ADA) Holding Crucial Support, Why It Could Surge Again
Cardano’s price traded to a new multi-month high at $1.48 before correcting lower. ADA declined sharply below $1.20, but the bulls were active above $1.18.
- ADA surged above the $1.20 and $1.40 resistance levels against the US dollar.
- The price is still trading well above $1.20 and the 100 simple moving average (4-hours).
- There is a key bullish trend line forming with support near $1.17 on the 4-hours chart of the ADA/USD pair (data source from Bitfinex).
- The pair could dip again towards $1.17 before it starts a fresh increase in the near term.
Cardano (ADA) Remains Strong Uptrend
In the past few days, cardano’s price started a strong increase above the $1.00 resistance. ADA price even cleared the $1.20 resistance and settled well above the 100 simple moving average (4-hours).
There was also a break above the $1.40 level and the price traded to a new multi-month high $1.487. Recently, there was a downside correction below the $1.350 and $1.300 levels. There was also a break below the $1.25 support level.
The price also declined below the 50% Fib retracement level of the upward move from the $0.9882 low to $1.487 high. However, the price remained well bid above the $1.750 zone.
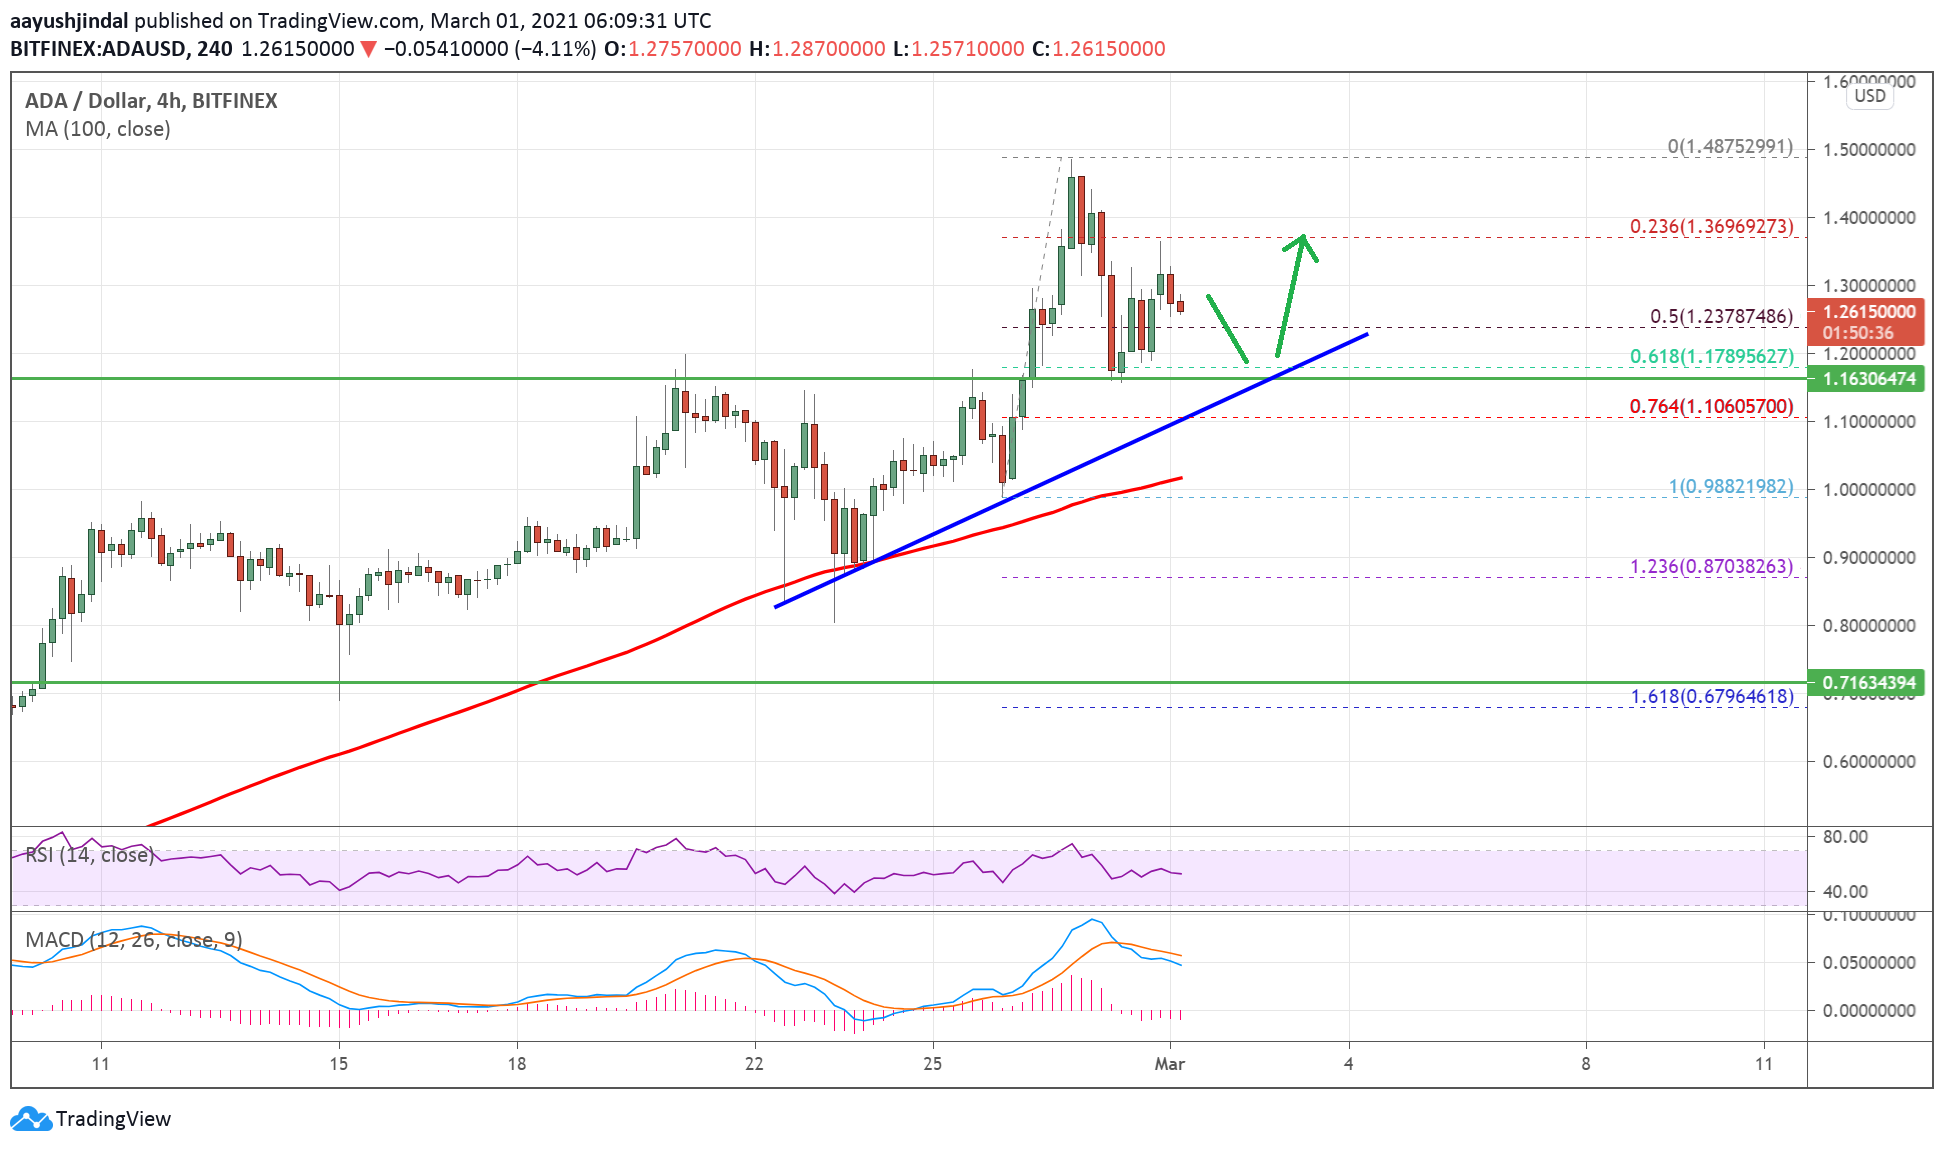
Source: ADAUSD on TradingView.com
There is also a key bullish trend line forming with support near $1.17 on the 4-hours chart of the ADA/USD pair. The trend line is close to the 61.8% Fib retracement level of the upward move from the $0.9882 low to $1.487 high.
On the upside, the price is facing resistance near the $1.30 and $1.35 levels. A clear break above the $1.35 zone could open the doors for a move towards the $1.40 and $1.45 levels. Any more gains could lead the price towards the $1.50 levels.
Dips Supported?
If cardano’s price fails to clear the $1.35 and $1.40 resistance levels, it could again correct lower. An initial support is near the $1.200 level.
The main support is now forming near the $1.750 level and the 100 simple moving average (4-hours). Any more losses below $1.7500 might risk of a break below $1.00.
Technical Indicators
4-hours MACD – The MACD for ADA/USD is struggling to gain momentum in the bullish zone.
4-hours RSI (Relative Strength Index) – The RSI for ADA/USD is currently stable above the 50 level.
Major Support Levels – $1.20, $1.75 and $1.10.
Major Resistance Levels – $1.35, $1.40 and $1.50.
OhNoCrypto
via https://www.ohnocrypto.com
Aayush Jindal, @KhareemSudlow