
TA: Bitcoin Claims $50K, Why BTC Could Continue Higher To $52K
Bitcoin price gained bullish momentum and broke the $50,000 resistance against the US Dollar. BTC is holding gains and it seems like it could rise further towards the $52,000 level.
- Bitcoin broke the $50,000 resistance and traded to a new all-time high near $50,600.
- The price is trading nicely near $50,000 and it is well above the 100 hourly simple moving average.
- There was a break above a key contracting triangle with resistance near $49,500 on the hourly chart of the BTC/USD pair (data feed from Kraken).
- The pair is likely to continue higher towards $52,000 as long as it is above the $48,000 support.
Bitcoin Price is Extending Gains
Finally, bitcoin price was able to clear the $50,000 resistance zone. BTC climbed above the $50,200 and $50,500 levels. It traded to a new all-time high at $50,600 before correcting lower.
There was a sharp correction below the $50,000 level. The price even spiked below the $49,000 support level. However, the bulls were active near the $48,000 zone and the 100 hourly simple moving average. A low is formed near $47,819 and the price is currently rising.
Bitcoin is trading above the 50% Fib retracement level of the downward correction from the $50,600 swing high to $47,819 low. There was also a break above a key contracting triangle with resistance near $49,500 on the hourly chart of the BTC/USD pair.
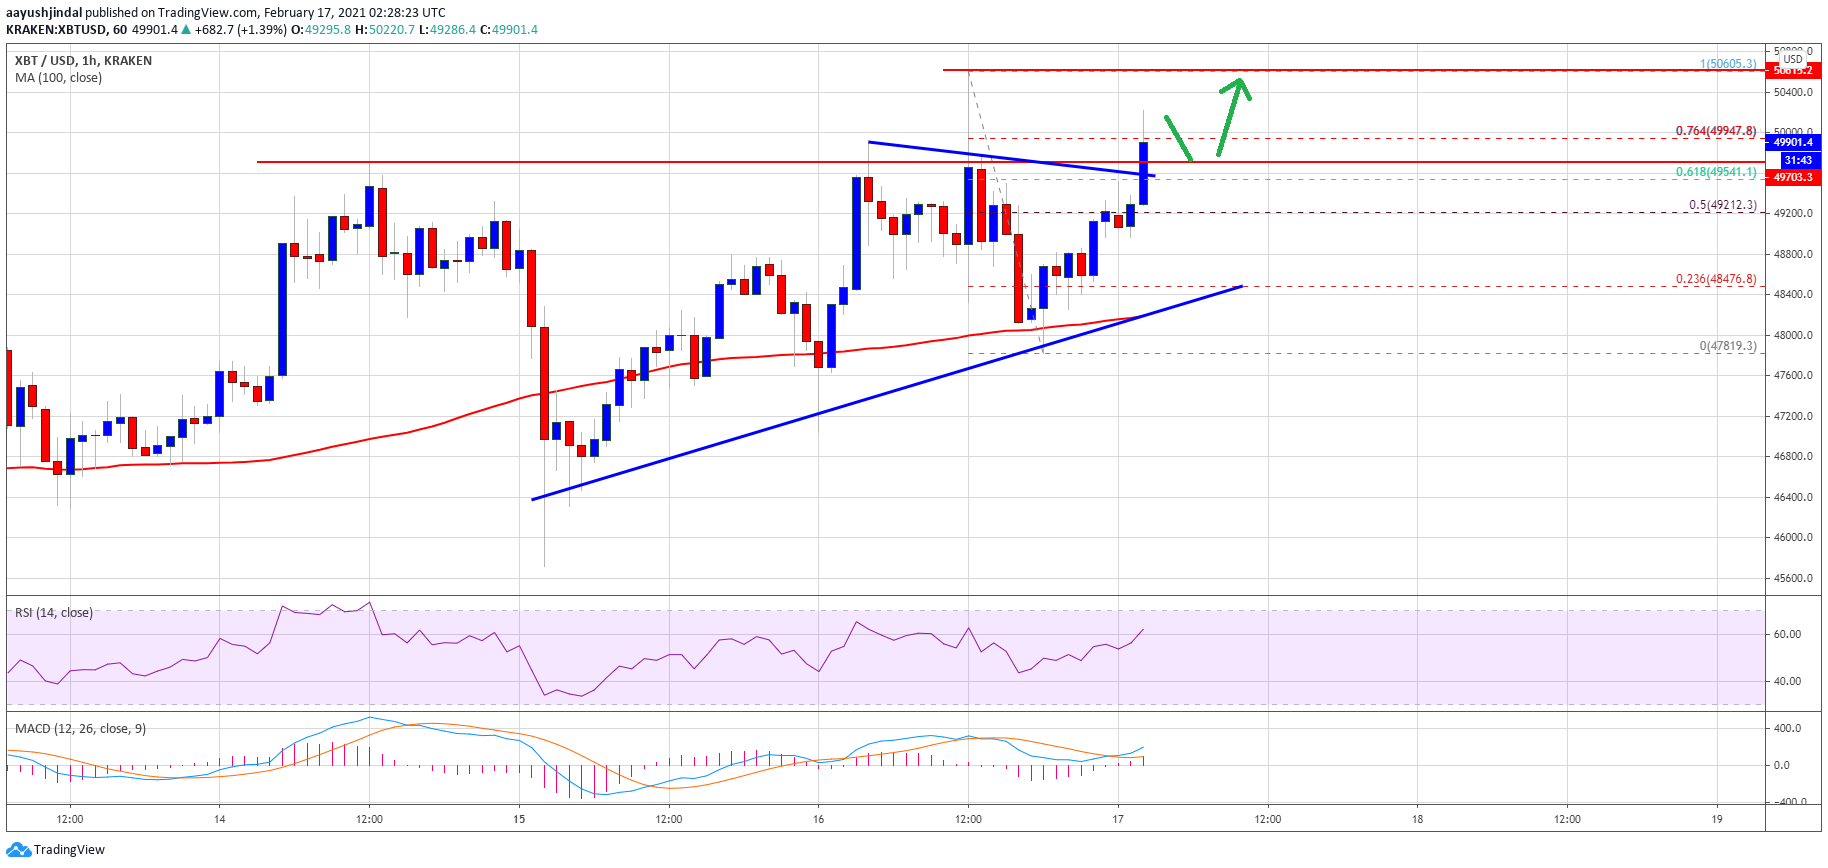
Source: BTCUSD on TradingView.com
The price is trading nicely near $50,000 and it is well above the 100 hourly simple moving average. It is testing the 76.4% Fib retracement level of the downward correction from the $50,600 swing high to $47,819 low.
It seems like the price is likely to continue higher towards the $50,600 high. Any more gains might easily push the price above the $51,000 level. The next key resistance sits at $52,000.
Fresh Dip in BTC?
If bitcoin fails to settle above the $50,000 and $50,200 levels, there could be a downside correction. An initial support is near the $49,500 level and the broken triangle trend line.
A downside break below the $49,500 level could lead the price towards the $48,000 support. The 100 hourly simple moving average is also sitting near $48,000 to provide support.
Technical indicators:
Hourly MACD – The MACD is gaining momentum in the bullish zone.
Hourly RSI (Relative Strength Index) – The RSI for BTC/USD is now well above the 50 level.
Major Support Levels – $49,500, followed by $49,000.
Major Resistance Levels – $50,500, $51,000 and $52,000.
OhNoCrypto
via https://www.ohnocrypto.com
Aayush Jindal, @KhareemSudlow