
Ripple (XRP) Breaks Key Support: Indicators Suggest Fresh Test of $0.22
Ripple failed to clear the $0.2450 resistance and declined sharply against the US Dollar. XRP price is now trading below the $0.2380 support and remains at a risk of a drop to $0.2200.
- Ripple is down more than 4% and it failed to clear the main $0.2450 resistance against the US dollar.
- The price is now trading well below $0.2380 and the 100 simple moving average (4-hours).
- Yesterday’s followed important bearish trend line is active with resistance near $0.2445 on the 4-hours chart of the XRP/USD pair (data source from Kraken).
- The pair is likely to accelerate lower towards $0.2200 if it breaks the $0.2280 support.
Ripple Price Resumes Decline
In the past two sessions, there was an increase in selling in bitcoin, Ethereum, and ripple. XRP price failed to clear the main $0.2450 resistance area (as discussed yesterday), and started a fresh decline.
There was a sharp decline below the $0.2400 level and the 100 simple moving average (4-hours). There was also a break below the 50% Fib retracement level of the key upward move from the $0.2195 swing low to $0.2550 swing high.
The decline was such that the bears pushed the price below the key $0.2380 support. More importantly, yesterday’s followed important bearish trend line is active with resistance near $0.2445 on the 4-hours chart of the XRP/USD pair.
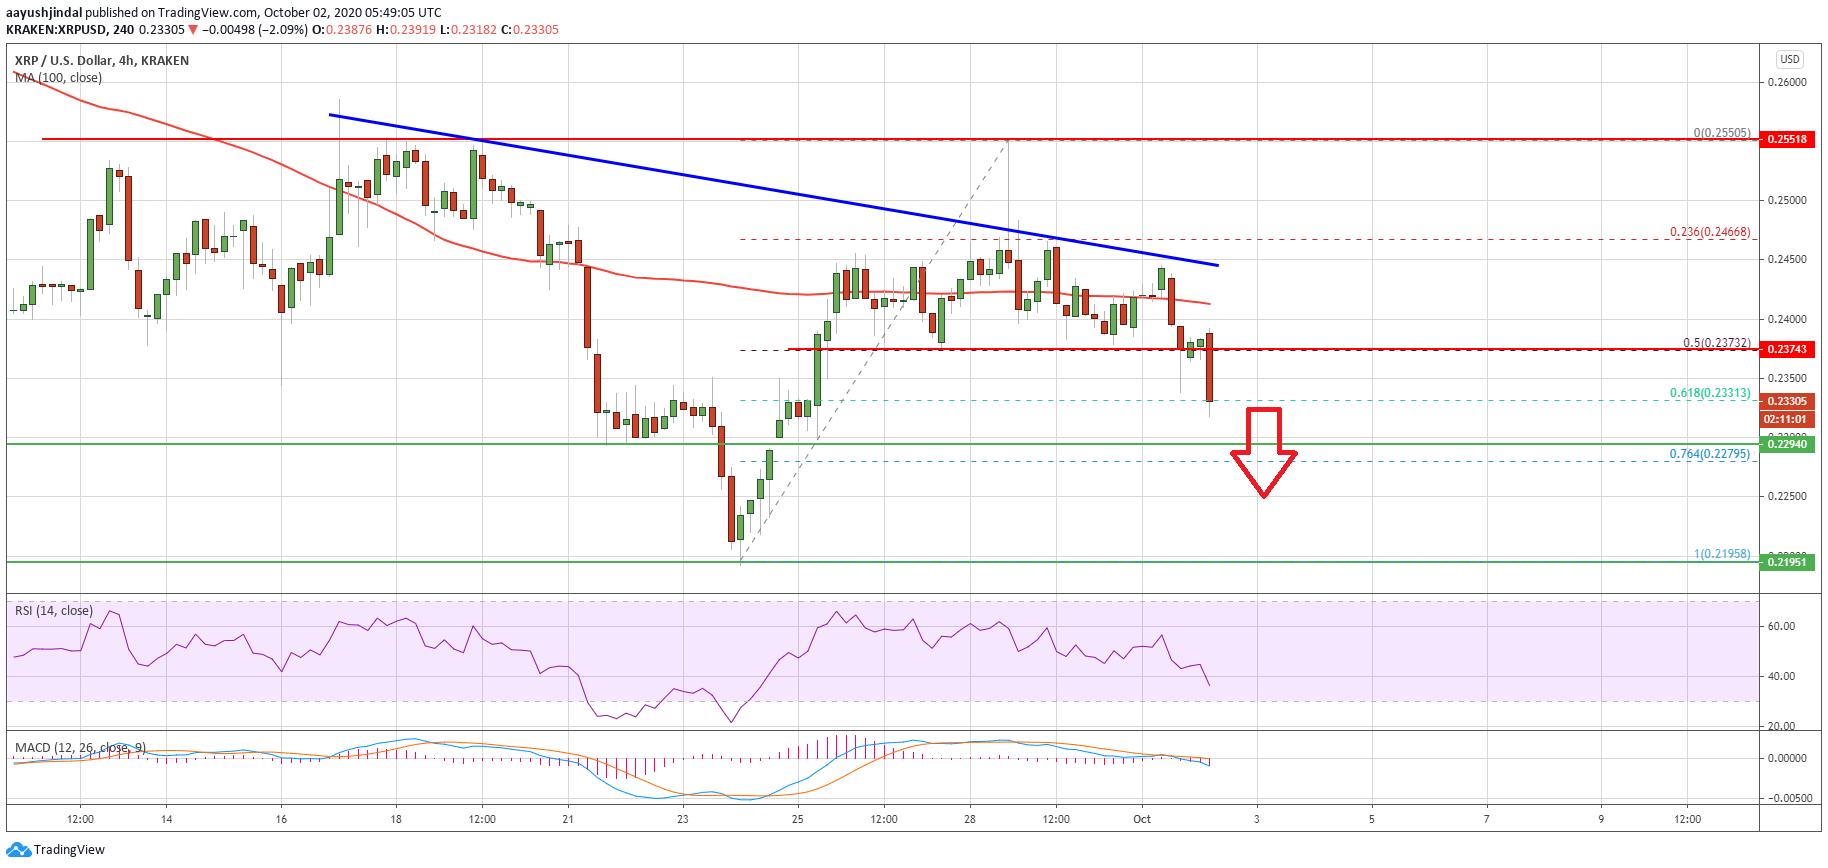
Ripple (XRP) price dives below $0.2380. Source: TradingView.com
The pair is now testing the $0.2300 zone, plus the 61.8% Fib retracement level of the key upward move from the $0.2195 swing low to $0.2550 swing high. If there is a downside break below the $0.2300 and $0.2280 support levels, it could open the doors for a sharp dip towards the next major support near the $0.2200 level. Any further losses could lead ripple towards the $0.2150 level.
Upsides Capped in XRP?
If ripple finds support near $0.2300 or $0.2280, there are chances of a short-term upside correction. On the upside, the price is likely to face a strong resistance near $0.2400 and the 100 simple moving average (4-hours).
The main resistance is still near the trend line and $0.2450, above which the bulls are likely to gain strength in the coming days.
Technical Indicators
4-Hours MACD – The MACD for XRP/USD is now gaining pace in the bearish zone.
4-Hours RSI (Relative Strength Index) – The RSI for XRP/USD is now well below the 50 level, with bearish signs.
Major Support Levels – $0.2300, $0.2280 and $0.2200.
Major Resistance Levels – $0.2380, $0.2400 and $0.2450.
OhNoCrypto
via https://www.ohnocrypto.com
Aayush Jindal, @KhareemSudlow