
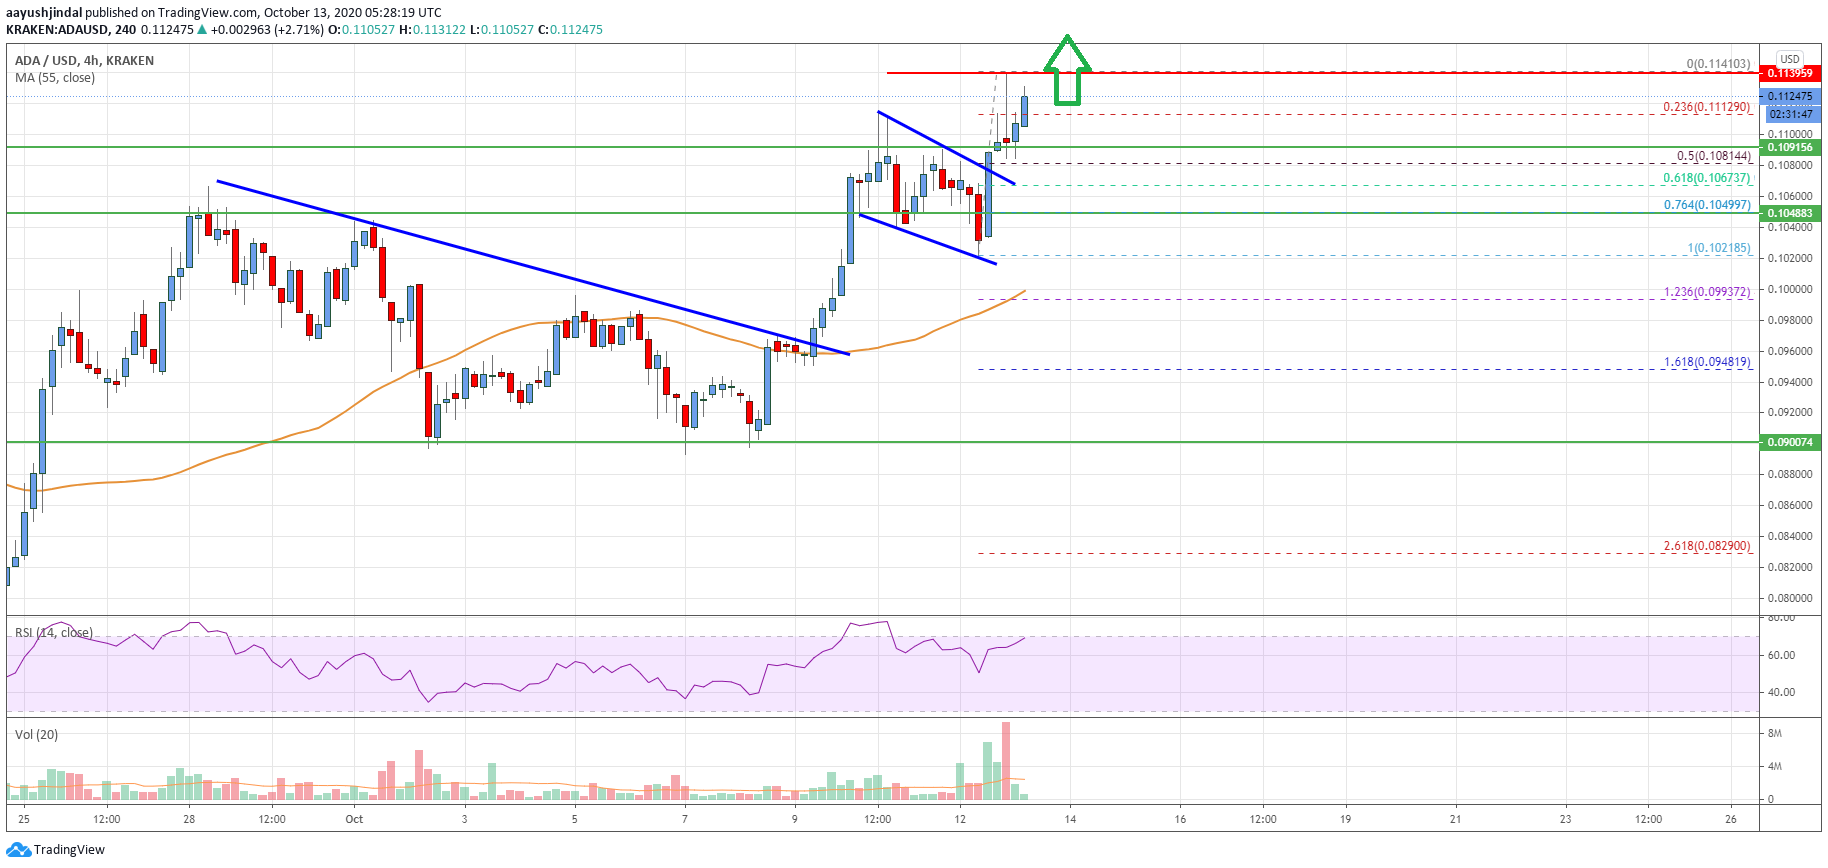
Charted: Cardano (ADA) Daily Chart Indicates A Significant Bullish Wave
Cardano’s price surged above the main $0.1000 resistance level and started a strong increase. ADA is likely to continue higher towards $0.1250 in the coming days.
- ADA is showing positive signs and it is now trading well above $0.1000 against the US dollar.
- The price cleared the $0.1120 resistance and trading above the 100-day simple moving average.
- There was a break above a significant bearish trend line with resistance near $0.0965 on the daily chart of the ADA/USD pair (data source from Bitfinex).
- The pair is likely to continue higher towards the $0.1250 and $0.1280 resistance levels.
Cardano (ADA) is Gaining Bullish Momentum
This past month, cardano’s price started a fresh increase from the $0.0755 low. ADA cleared the $0.0880 and $0.0950 resistance levels to move into a positive zone.
The upward move gained pace after there was a break above a significant bearish trend line with resistance near $0.0965 on the daily chart of the ADA/USD pair. There was also a break above the 50% Fib retracement level of the key decline from the $0.1280 high to $0.0755 low.
Cardano cleared the $0.1120 resistance and trading above the 100-day simple moving average. An immediate resistance is near the $0.1155 level. It is close to the 76.4% Fib retracement level of the key decline from the $0.1280 high to $0.0755 low.
Cardano (ADA) price surging above $0.1100. Source: TradingView.com
A successful close above the $0.1155 level might clear the path for more upsides towards the $0.1250 resistance. The next key resistance is near $0.1280, above which the price may even test $0.1320.
Dips Supported?
If cardano’s price starts a downside correction, it is likely to find support near $0.1100. An initial support on the downside is near the $0.1080 level.
The main support is now forming near the $0.1020 level (a major breakout zone). If there is a downside break below $0.1020 and $0.1000, the price might start a strong decline.
Technical Indicators
Daily MACD – The MACD for ADA/USD is currently gaining pace in the bullish zone.
Daily RSI (Relative Strength Index) – The RSI for ADA/USD is currently well above the 50 level.
Major Support Levels – $0.1120, $0.1080 and $0.1020.
Major Resistance Levels – $0.1155, $0.1250 and $0.1280.
OhNoCrypto
via https://www.ohnocrypto.com
Aayush Jindal, @KhareemSudlow