
Tron (TRX) Outperforms Bitcoin, But Here’s Why It Could Correct Lower
Tron price is up over 5%, while bitcoin is down over 5% against the US Dollar. TRX is currently testing a crucial resistance near $0.0385 and it could correct lower in the short-term.
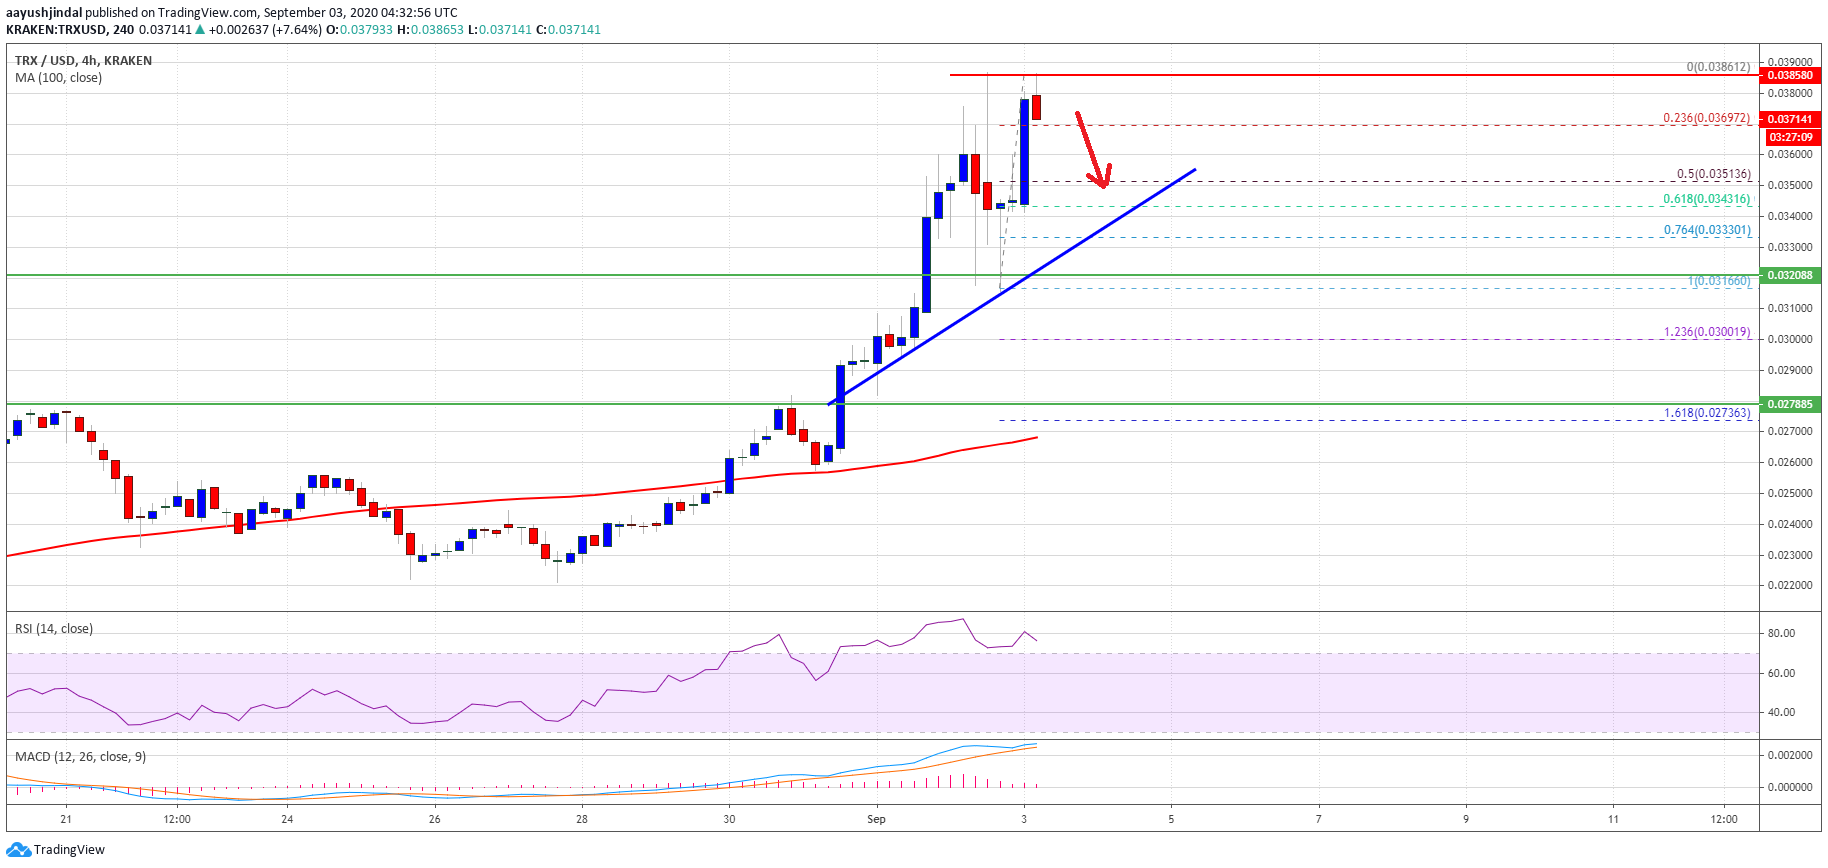
- Tron price is trading in a positive zone well above the $0.0320 pivot level against the US dollar.
- The price traded to a new weekly high at $0.0386 and it is currently consolidating gains.
- There is a key connecting bullish trend line forming with support near $0.0350 on the 4-hours chart of the TRX/USD pair (data source from Kraken).
- The pair is likely to correct lower, but the bulls are likely to defend $0.0350 or $0.0320.
Tron Price Jumps 5%
In the past few sessions, tron price followed a bullish path above the $0.0300 level against the US Dollar, and it outperformed bitcoin and ethereum. TRX even broke the $0.0350 resistance zone and settled well above the 100 simple moving average (4-hours).
The price traded to a new weekly high at $0.0386 and it is currently consolidating gains. An initial support is near the $0.0370 level. It is close to the 23.6% Fib retracement level of the recent rally from the $0.0316 low to $0.0386 high.
The first major support on the downside is near the $0.0350 level (the breakout zone). There is also a key connecting bullish trend line forming with support near $0.0350 on the 4-hours chart of the TRX/USD pair.
Tron (TRX) price breaks $0.0350. Source: TradingView.com
The trend line coincides with the 50% Fib retracement level of the recent rally from the $0.0316 low to $0.0386 high. On the upside, tron is facing a major hurdle near the $0.0385 zone. If the bulls successfully clears the $0.0385 resistance, the price could rally again.
The next major resistance is near the $0.0400 level, above which the bulls are likely to aim a larger increase towards the key $0.0500 zone in the coming days.
Dips Likely to be Limited in TRX
If TRX price fails to clear the $0.0385 barrier, it could correct lower. An initial support is near the $0.0350 zone, where the bulls are likely to appear.
It seems like dips are likely to remain supported, but any losses below $0.0350 could lead the price towards the $0.0320 support zone in the near term.
Technical Indicators
4-hours MACD – The MACD for TRX/USD is gaining momentum in the bullish zone.
4-hours RSI (Relative Strength Index) – The RSI for TRX/USD is currently well in the overbought zone.
Major Support Levels – $0.0370, $0.0350 and $0.0320.
Major Resistance Levels – $0.0385, $0.0400 and $0.0420.
OhNoCrypto
via https://www.ohnocrypto.com
Aayush Jindal, Khareem Sudlow