
This Historical Analysis Suggests Bitcoin Price Will Undergo a “Quick Reversal”
- Even after a healthy $500 bounce, Bitcoin is still down over 15% in the span of four days.
- The price of the leading cryptocurrency is currently $10,250, around $500 above the recent lows.
- BTC remains in an uncertain spot, with strong support to the downside but also strong resistance on the upside.
- Bitcoin may be ready to move even higher, though, according to a new RSI analysis by a chartist.
- The analysis suggests that Bitcoin is at a point in its market cycle where it has historically bounced.
- This is in line with a series of other macro analyses that predict an imminent bullish reversal.
Bitcoin Is Primed To Bounce: Here’s Why
A new relative strength index (RSI) analysis suggests that Bitcoin may soon snap back to the local highs as opposed to falling even further.
The relative strength index is a commonly-used technical indicator that shows the severity of an asset’s moves. The RSI prints certain values when an asset is technically overbought or oversold and also when it is neutral.
According to this analysis, Bitcoin’s one-week RSI is reaching a point where it has historically undergone “bounces or quick reversals.”
In the current context, this means that should history rhyme, Bitcoin will rapidly move higher in the coming weeks as a relief bounce ensues.
Similar bounces have been seen earlier this year, along with multiple times during 2017’s bull market and at least once in 2012’s bull market. The fact that so many of these technical bounces took place during the last bull market indicates there’s a good likelihood they will be seen again.
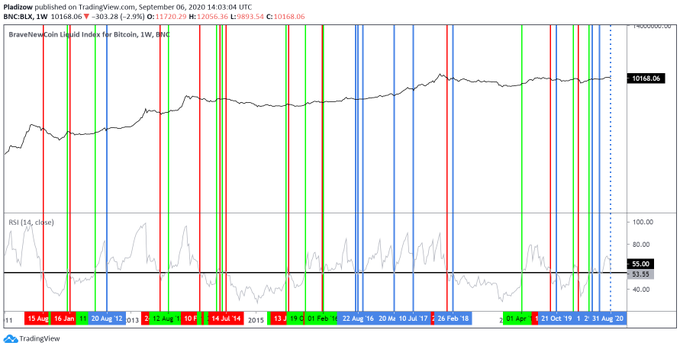
Chart of BTC's macro price action with a relative strength index analysis by crypto trader "Nunya Bizniz" (@Pladizow on Twitter). Chart from TradingView.com
In Line With Macro Analyses
The chart shared by the analyst above is in line with many macro analyses that suggest that Bitcoin remains bullish on a macro time frame.
For one, the same trader that shared the chart above posted this one earlier this week. It suggests that Bitcoin is at a similar point in its market cycle to where BTC was in the middle of 2015, which was when the rally from the hundreds to $20,000 began.
“BTC weekly: 2015 -vs- 2020. Retest of descending trend line. After the successful 2015 retest, BTC ran 8,000% into the Dec 2017 ATH. Silly hopium?”
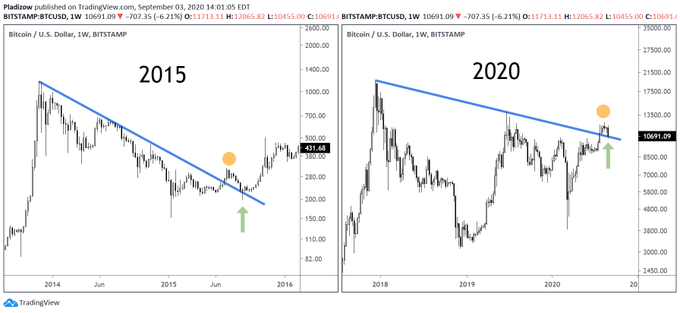
Chart of Bitcoin's macro price action with a fractal analysis by crypto trader and chartist "Nunya Bizniz" (@Pladizow on Twitter). Chart from TradingView.com
Also corroborating this expectation are simple fundamental trends, like ongoing monetary stimulus and institutional investment primed to drive BTC higher.
Featured Image from Shutterstock
Price tags: xbtusd, btcusd, btcusdt
Charts from TradingView.com
This Historical Analysis Suggests Bitcoin Price Will Undergo a "Quick Reversal"
OhNoCryptocurrency via https://www.ohnocrypto.com/ @Nick Chong, @Khareem Sudlow