
Ethereum Key Indicators Suggest A Strengthening Case For Correction Below $300
Ethereum is down 5% and it broke $330 and $320 support levels against the US Dollar. ETH price remains at a risk of more losses below $300 as long as it is below $340.
- Ethereum extended its decline below the $330 and $320 support levels.
- The price traded as low as $313 and it settled well below the 100 hourly simple moving average.
- There is a key bearish trend line forming with resistance near $330 on the hourly chart of ETH/USD (data feed via Kraken).
- The pair could decline further below $300 unless the bulls gain pace above the $340 resistance.
Ethereum Price Remains at a Risk
After multiple failed attempts near $355 and $350, Ethereum reacted to the downside. ETH price broke the key $330 support level and settled below the 100 hourly simple moving average to move further into a bearish zone.
Ether price even spiked below the $320 support and traded to a new weekly low at $313. The price is down nearly 5% and it is currently correcting losses. There was a break above the $320 level, plus the 23.6% Fib retracement level of the recent decline from the $343 high to $313 low.
On the upside, there are many important hurdles for the bulls, starting with $330. It is close to the 50% Fib retracement level of the recent decline from the $343 high to $313 low.
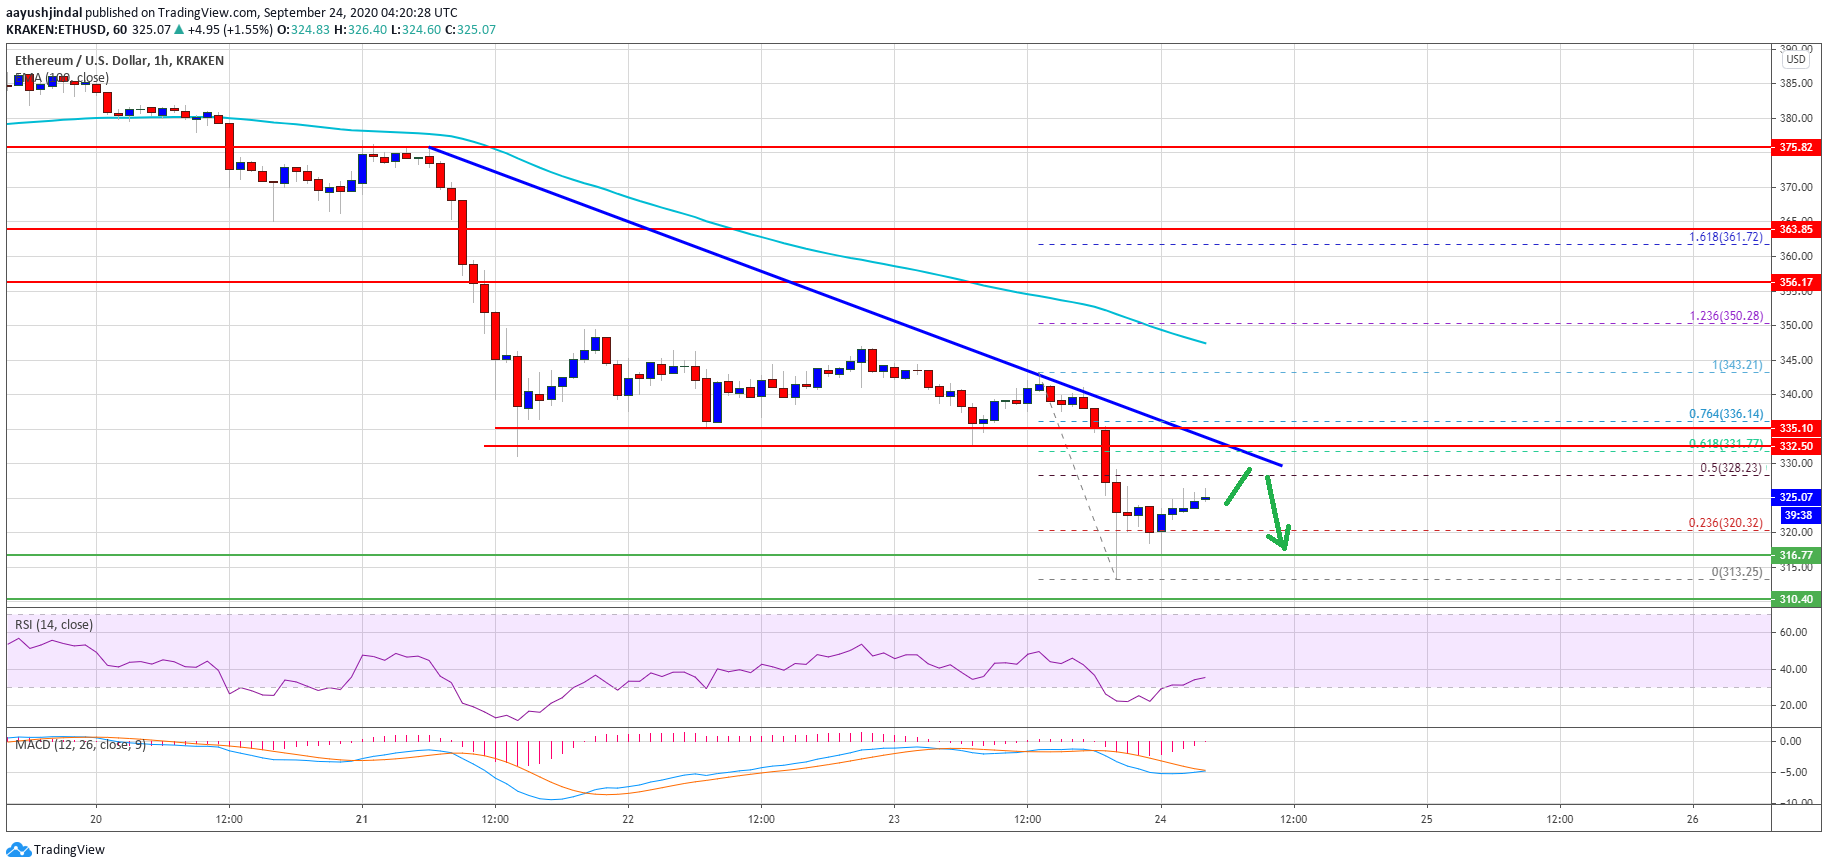
Ethereum price dives below $330. Source: TradingView.com
There is also a key bearish trend line forming with resistance near $330 on the hourly chart of ETH/USD. The trend line coincides with the previous breakdown support near $332 and $335. A successful close above the trend line, and then follow up move above $335 is needed to start a decent recovery wave. The next key resistance is still near the $350 and $355 levels.
More Losses in ETH?
If Ethereum fails to recover above the $330 and $335 resistance levels, there is a risk of more losses in the near term. An initial support is near the $320 level.
The first major support is near the $310 level (the previous swing low). A break below the $310 support could open the doors for a larger decline below the main $300 support level in the coming sessions.
Technical Indicators
Hourly MACD – The MACD for ETH/USD is slowly moving in the bullish zone.
Hourly RSI – The RSI for ETH/USD is still well below the 40 level.
Major Support Level – $310
Major Resistance Level – $335
OhNoCrypto
via https://www.ohnocrypto.com
Aayush Jindal, @KhareemSudlow