
Bitcoin Looks Almost Exactly Like It Did Prior to the 2016-2017 Explosion
- Bitcoin has seen a strong reversal over the past few days after it was once again rejected at $12,000.
- The leading cryptocurrency now trades for $10,500, trading around pivotal technical levels.
- BTC has yet to post a notable close above or below these pivotal levels, but traders are keeping a close eye on the charts.
- One analyst argues that Bitcoin’s recent weakness is actually just par for the course.
- He notes that from a macro perspective, BTC actually looks similar to where it was when it began the 2016-2017 exponential rally.
- This is in line with a series of analysts who say that Bitcoin remains in a good spot on a macro time frame despite recent weakness.
Bitcoin Could Soon Surge if History Repeats Itself
Bitcoin is primed to begin a macro rally from here if history repeats itself, a recent analysis by a crypto chartist indicates.
The chartist shared the chart below on September 3rd. It shows that BTC’s about to bounce off a pivotal downtrend from the $20,000 all-time high.
While not identical per se, BTC completed a similar retest at the start of the previous bull run, where it retested the resistance of the $1,300 all-time high as support before rallying higher.
Should history repeat, BTC will not begin its bull run after it prints a clean bounce off current price levels:
“BTC weekly: 2015 -vs- 2020. Retest of descending trend line. After the successful 2015 retest, BTC ran 8,000% into the Dec 2017 ATH. Silly hopium?”
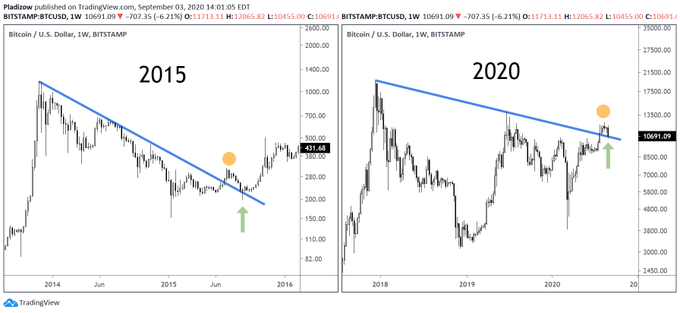
Chart of Bitcoin's macro price action with a fractal analysis by crypto trader and chartist "Nunya Bizniz" (@Pladizow on Twitter). Chart from TradingView.com
Not Entirely Unlikely: BTC’s Macro Chart Structure Remains Bullish
Corroborating this sentiment that BTC is on the verge of a macro upswing is other analyses of the cryptocurrency’s macro price action.
One trader recently shared this chart below. It shows that Bitcoin’s recent price action is actually a clear retest of a macro support level, not a bearish breakdown as many have noted:
“$BTC funding and premium index reached the lowest it had been since March 19th yesterday… Except this time we’re retesting a multi-year S/R level with a confirmed bullish break in MS all the way up to the monthly chart…”
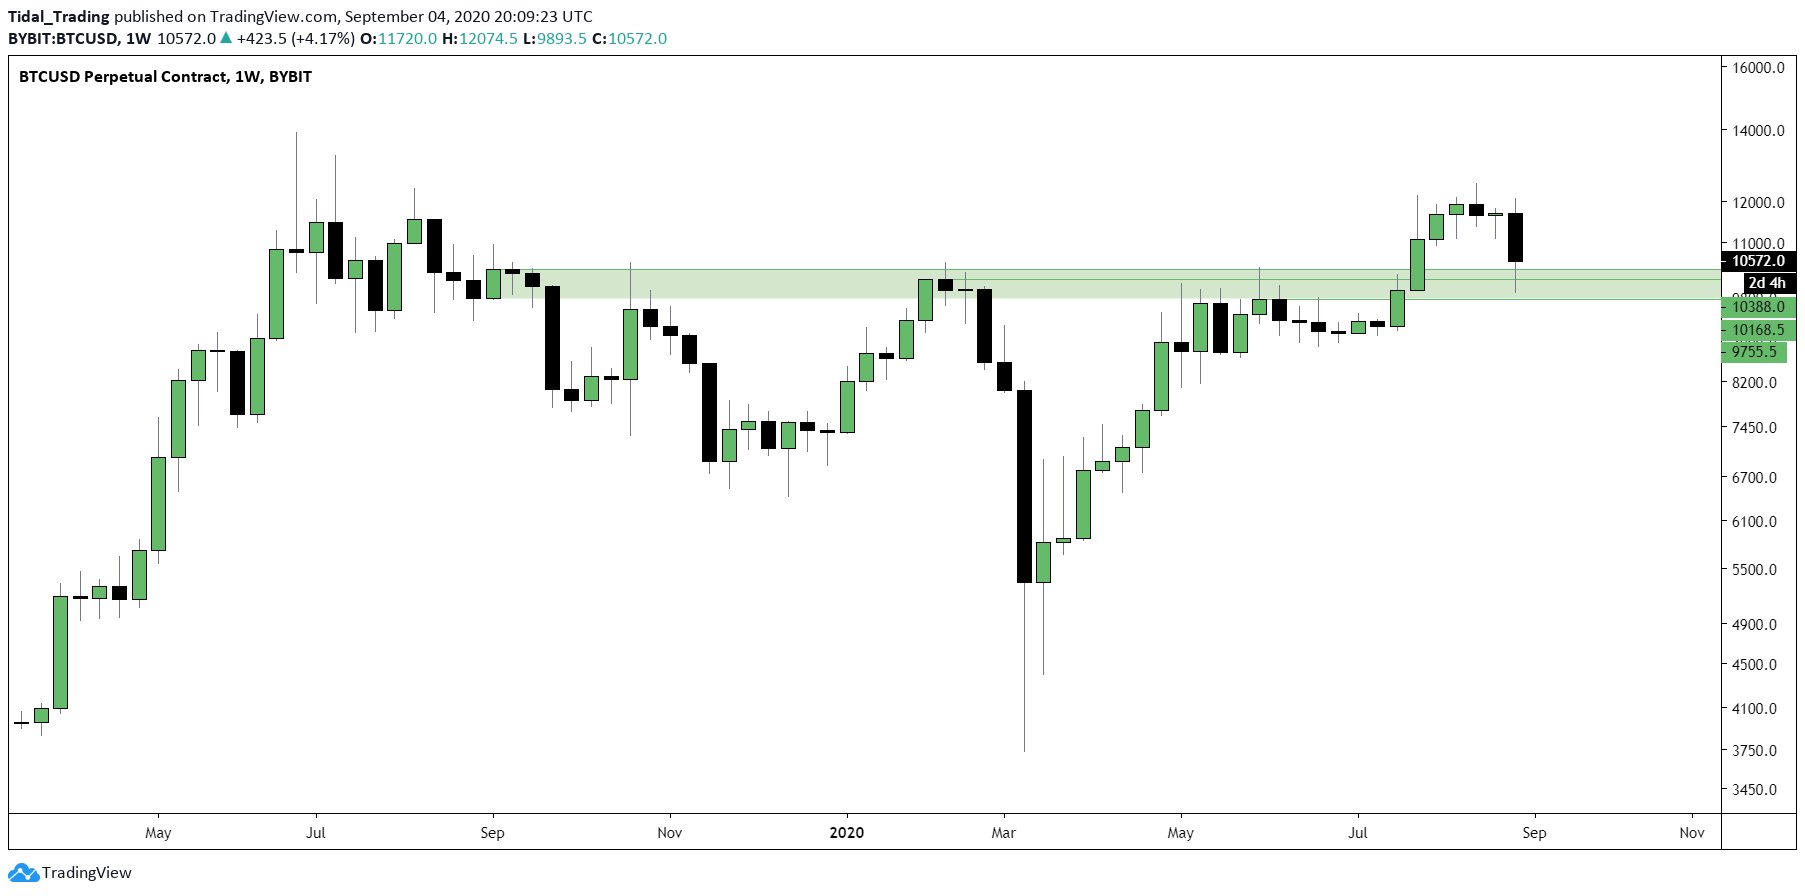
Chart of Bitcoin's macro price action with analysis by crypto trader HornHairs (@CryptoHornHairs on Twitter). Chart from TradingView.com
The fundamentals of the industry remain positive. For one, Fidelity Investments was recently revealed to have begun work on a Bitcoin fund focused on offering BTC exposure to institutional clients.
Featured Image from Shutterstock
Price tags: xbtusd, btcusd, btcusdt
Charts from TradingView.com
Bitcoin Looks Exactly Like It Did Prior to the 2016-2017 Explosion
OhNoCryptocurrency via https://www.ohnocrypto.com/ @Nick Chong, @Khareem Sudlow