
Bitcoin Just Saw Key Technical Correction But 100 SMA Can Trigger New Rally
Bitcoin price traded above the $12,000 resistance before starting a downside correction against the US Dollar. BTC is likely to remain supported above $11,650 and it could rise again.
- Bitcoin gained bullish momentum and it broke the $11,800 and $12,000 resistance levels.
- The price traded to a new weekly high at $12,066 and it is well above the 100 hourly simple moving average.
- There is a key bullish trend line forming with support near $11,650 on the hourly chart of the BTC/USD pair (data feed from Kraken).
- The pair is currently correcting lower, but dips might find support near $11,800 or $11,650.
Bitcoin Price Surpasses $12K
In the last technical analysis, we discussed the chances of a break above $12,000 in bitcoin price against the US Dollar. BTC did gain bullish momentum above the $11,800 resistance and settled well above the 100 hourly simple moving average.
It even spiked above the $12,000 resistance and traded to a new weekly high at $12,066. It is currently correcting lower and trading below $12,000. There was a break below the 23.6% Fib retracement level of the recent upward move from the $11,528 low to $12,066 high.
However, the price is now reaching a strong support near the $11,800 level. The previous resistance and a broke channel resistance near $11,840 are likely to prevent more losses. There is also a key bullish trend line forming with support near $11,650 on the hourly chart of the BTC/USD pair.
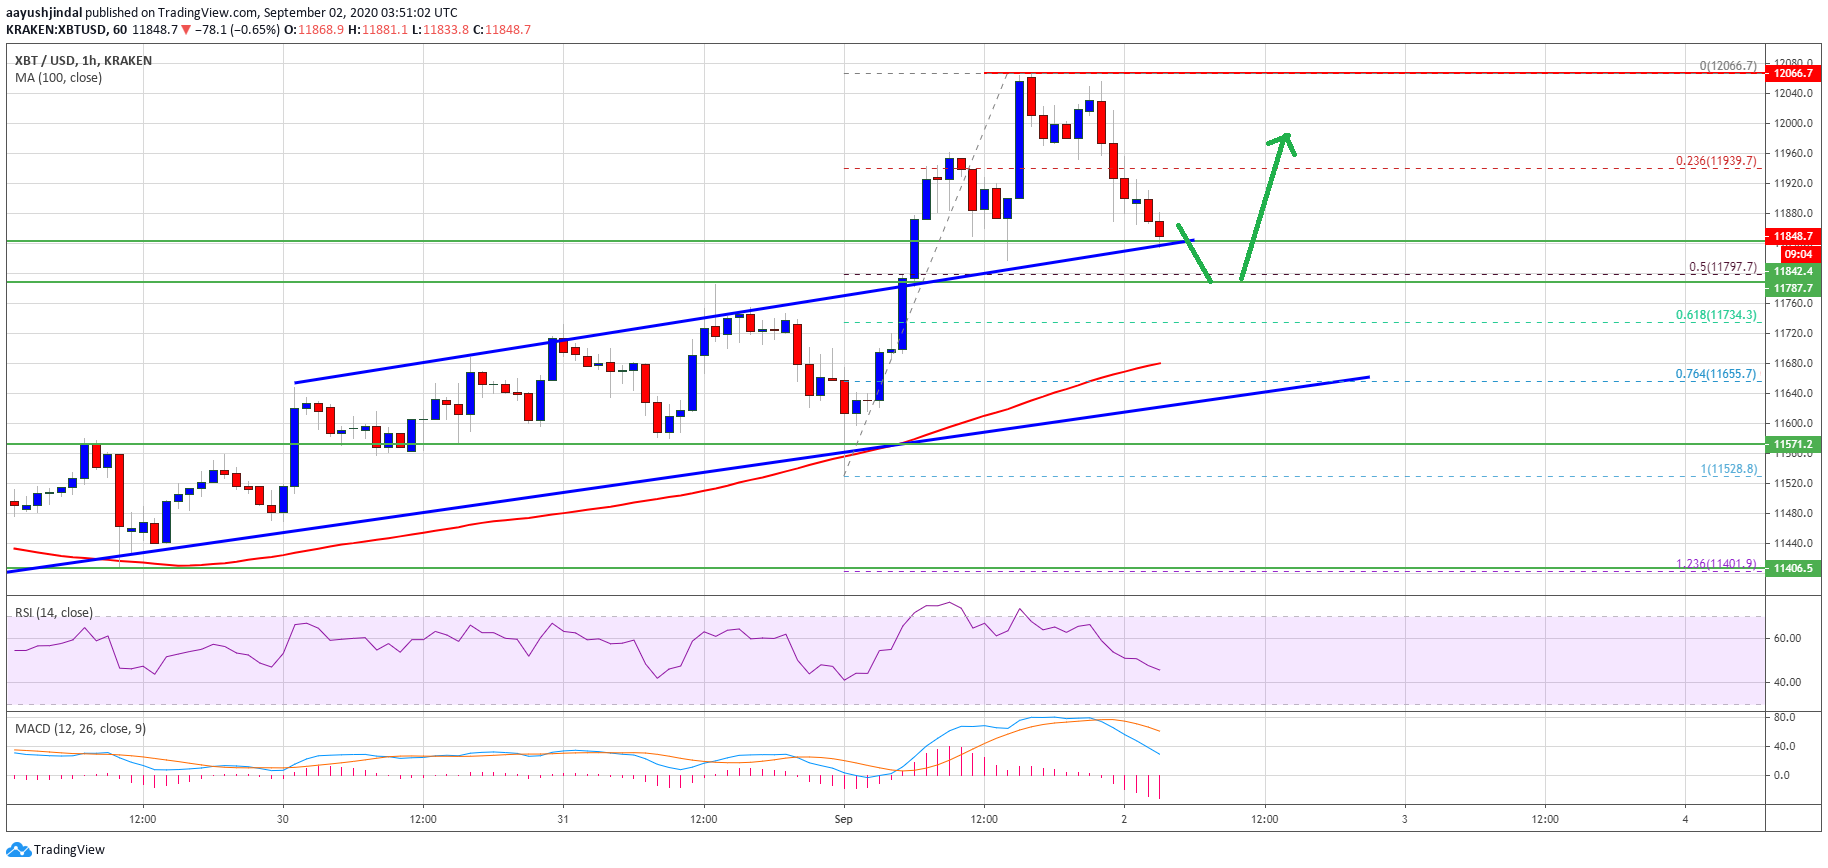
Bitcoin price trades above $11,800. Source: TradingView.com
The $11,800 support is also close to the 50% Fib retracement level of the recent upward move from the $11,528 low to $12,066 high. On the upside, the $12,000 level is still a hurdle for the bulls.
If bitcoin climbs above the $12,000 resistance and the recent high at $12,066, it is likely to accelerate higher. The next resistance is near $12,200, above which the bulls might aim a test of $12,500.
Dips Supported in BTC?
If bitcoin price struggles to clear the $12,000 resistance, it might correct lower further. The main supports are near the $11,800 and $11,650 levels.
A bearish break below the trend line support could push the price towards the uptrend support at $11,550, below which the bulls are likely to struggle.
Technical indicators:
Hourly MACD – The MACD is now gaining momentum in the bearish zone.
Hourly RSI (Relative Strength Index) – The RSI for BTC/USD is declining and it is below the 50 level.
Major Support Levels – $11,800, followed by $11,650.
Major Resistance Levels – $12,000, $12,050 and $12,200.
OhNoCrypto
via https://www.ohnocrypto.com
Aayush Jindal, Khareem Sudlow