
Technicals Indicate Ripple (XRP) is About To See Lift-off To $0.30
Ripple started a steady recovery above the $0.2800 level against the US Dollar. XRP price is likely to continue higher towards the $0.2950 and $0.3000 resistance levels.
- Ripple remained stable above $0.2720 and recovered above $0.2800 against the US dollar.
- The price is currently trading above the $0.2840 level and the 100 hourly SMA.
- There is a rising channel forming with support near $0.2820 on the hourly chart of the XRP/USD pair (data source from Kraken).
- The pair could continue to recover towards $0.3000 as long as it is above $0.2780.
Ripple Price is Recovering Higher
After trading as low as $0.2732, ripple started a steady recovery. XRP price climbed above $0.2780 and $0.2800 to move into a positive zone and start a decent recovery wave.
There was also a break above a connecting bearish trend line with resistance near $0.2840 on the hourly chart of the XRP/USD pair. The pair is now trading above the $0.2850 level, the 100 hourly simple moving average, and the 50% Fib retracement level of the downward move from the $0.2958 high to $0.2732 low.
An immediate resistance on the upside is near the $0.2870 level. It is close to the 61.8% Fib retracement level of the downward move from the $0.2958 high to $0.2732 low.
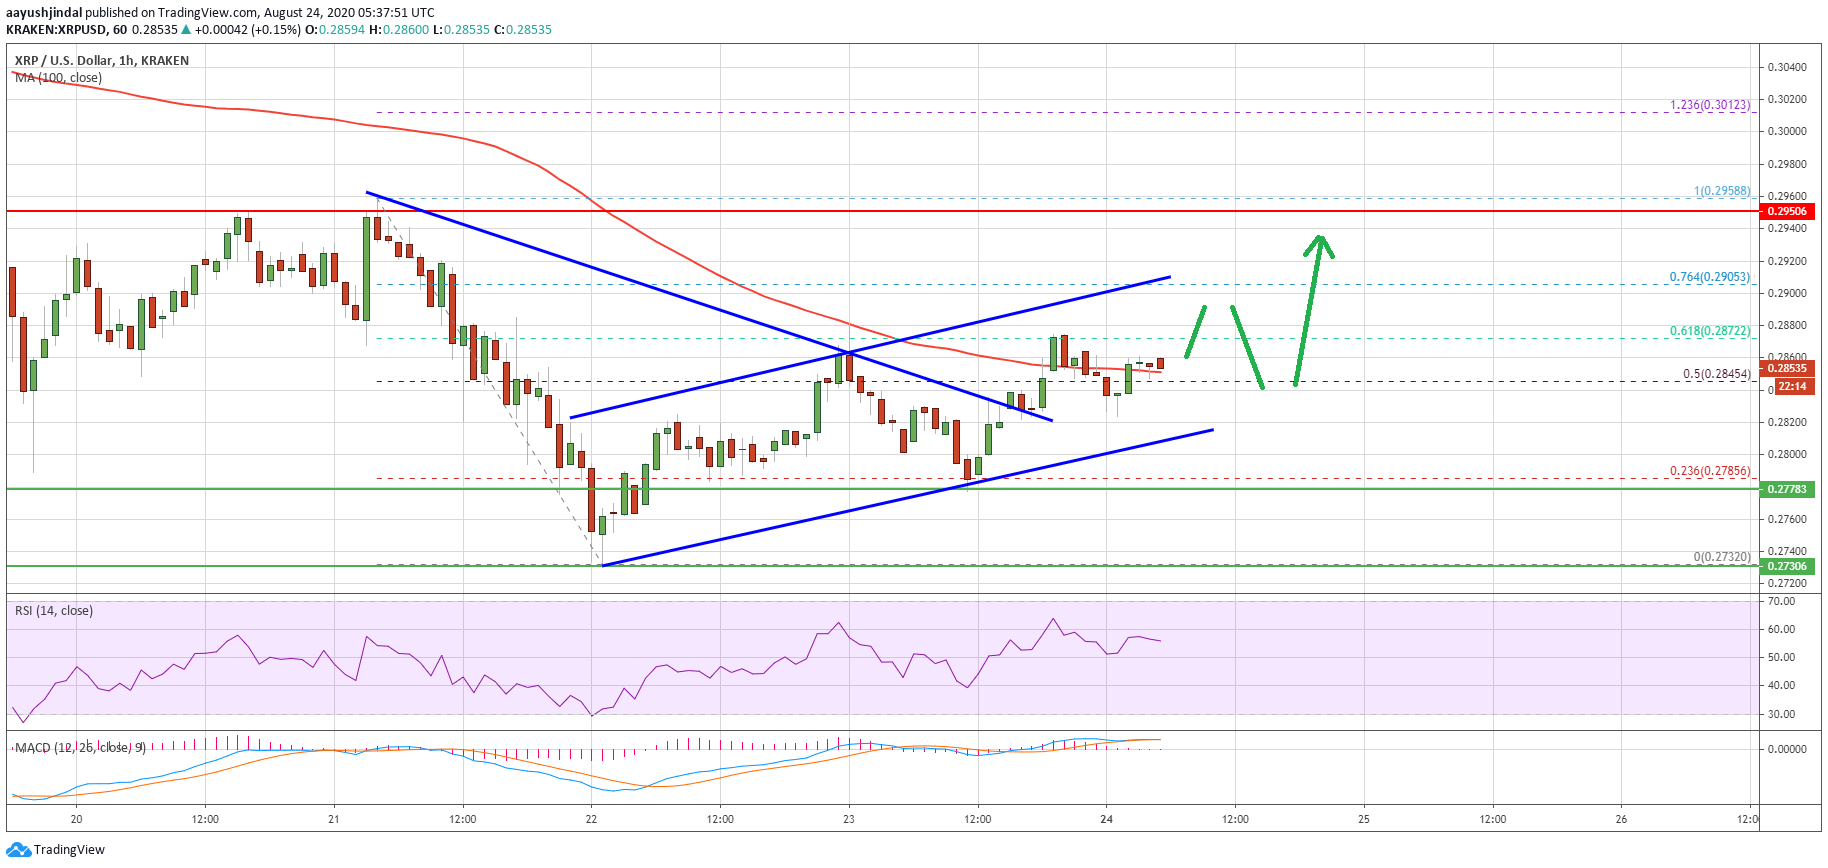
Ripple price trades above $0.2850. Source: TradingView.com
More importantly, the price seems to be following a rising channel with support near $0.2820 on the same chart. The channel resistance is near the $0.2905 level, above which the price might test the $0.2950 resistance zone in the near term.
Any further gains will most likely initiate a push towards the $0.3000 and $0.3020 resistance levels. The next stop for the bulls could be near the $0.3055 pivot level.
Downside Break in XRP?
If ripple struggles to climb above the $0.2905 and $0.2950 resistance levels, there could be a bearish reaction. An initial support is near the $0.2820 level and the channel lower trend line.
If there is a downside break below the channel support, the price could retest $0.2780. Any further losses might start another bearish wave and the price could even decline below the $0.2720 support level.
Technical Indicators
Hourly MACD – The MACD for XRP/USD is slowly gaining strength in the bullish zone.
Hourly RSI (Relative Strength Index) – The RSI for XRP/USD is rising and it is now well above the 50 level.
Major Support Levels – $0.2820, $0.2780 and $0.2720.
Major Resistance Levels – $0.2905, $0.2950 and $0.3000.
OhNoCrypto
via https://www.ohnocrypto.com
Aayush Jindal, Khareem Sudlow