
Daily Chart Suggests Bitcoin At Risk of Extended Correction To $10,500
Bitcoin struggled to clear the $12,000 resistance zone and corrected lower against the US Dollar. BTC’s daily chart suggests the price could extend its decline towards the $10,500 support.
- Bitcoin topped near the $12,080 level and it is currently correcting gains.
- The price is trading below the $11,500 support and approaching the next major support.
- There is a key bullish trend line forming with support near $11,240 on the daily chart of the BTC/USD pair (data feed from Kraken).
- The pair could start an extended decline towards the $10,500 level if it breaks the trend line support.
Bitcoin Price Correcting Gains
Earlier this month, bitcoin price gained bullish momentum above the $11,00 level against the US Dollar. BTC even broke the $11,500 resistance and settled well above the 100-day simple moving average.
There was a break above the $12,000 level and the price climbed to a new monthly high near $12,100. However, it failed to stay above the $12,000 level and recently started a downside correction. The bears were able to push the price below the $11,800 level.
Bitcoin price traded below the 23.6% Fib retracement level of the upward move from the $9,000 swing low to $12,100 swing high. It is now trading near the $11,300 level. There is also a key bullish trend line forming with support near $11,240 on the daily chart of the BTC/USD pair.
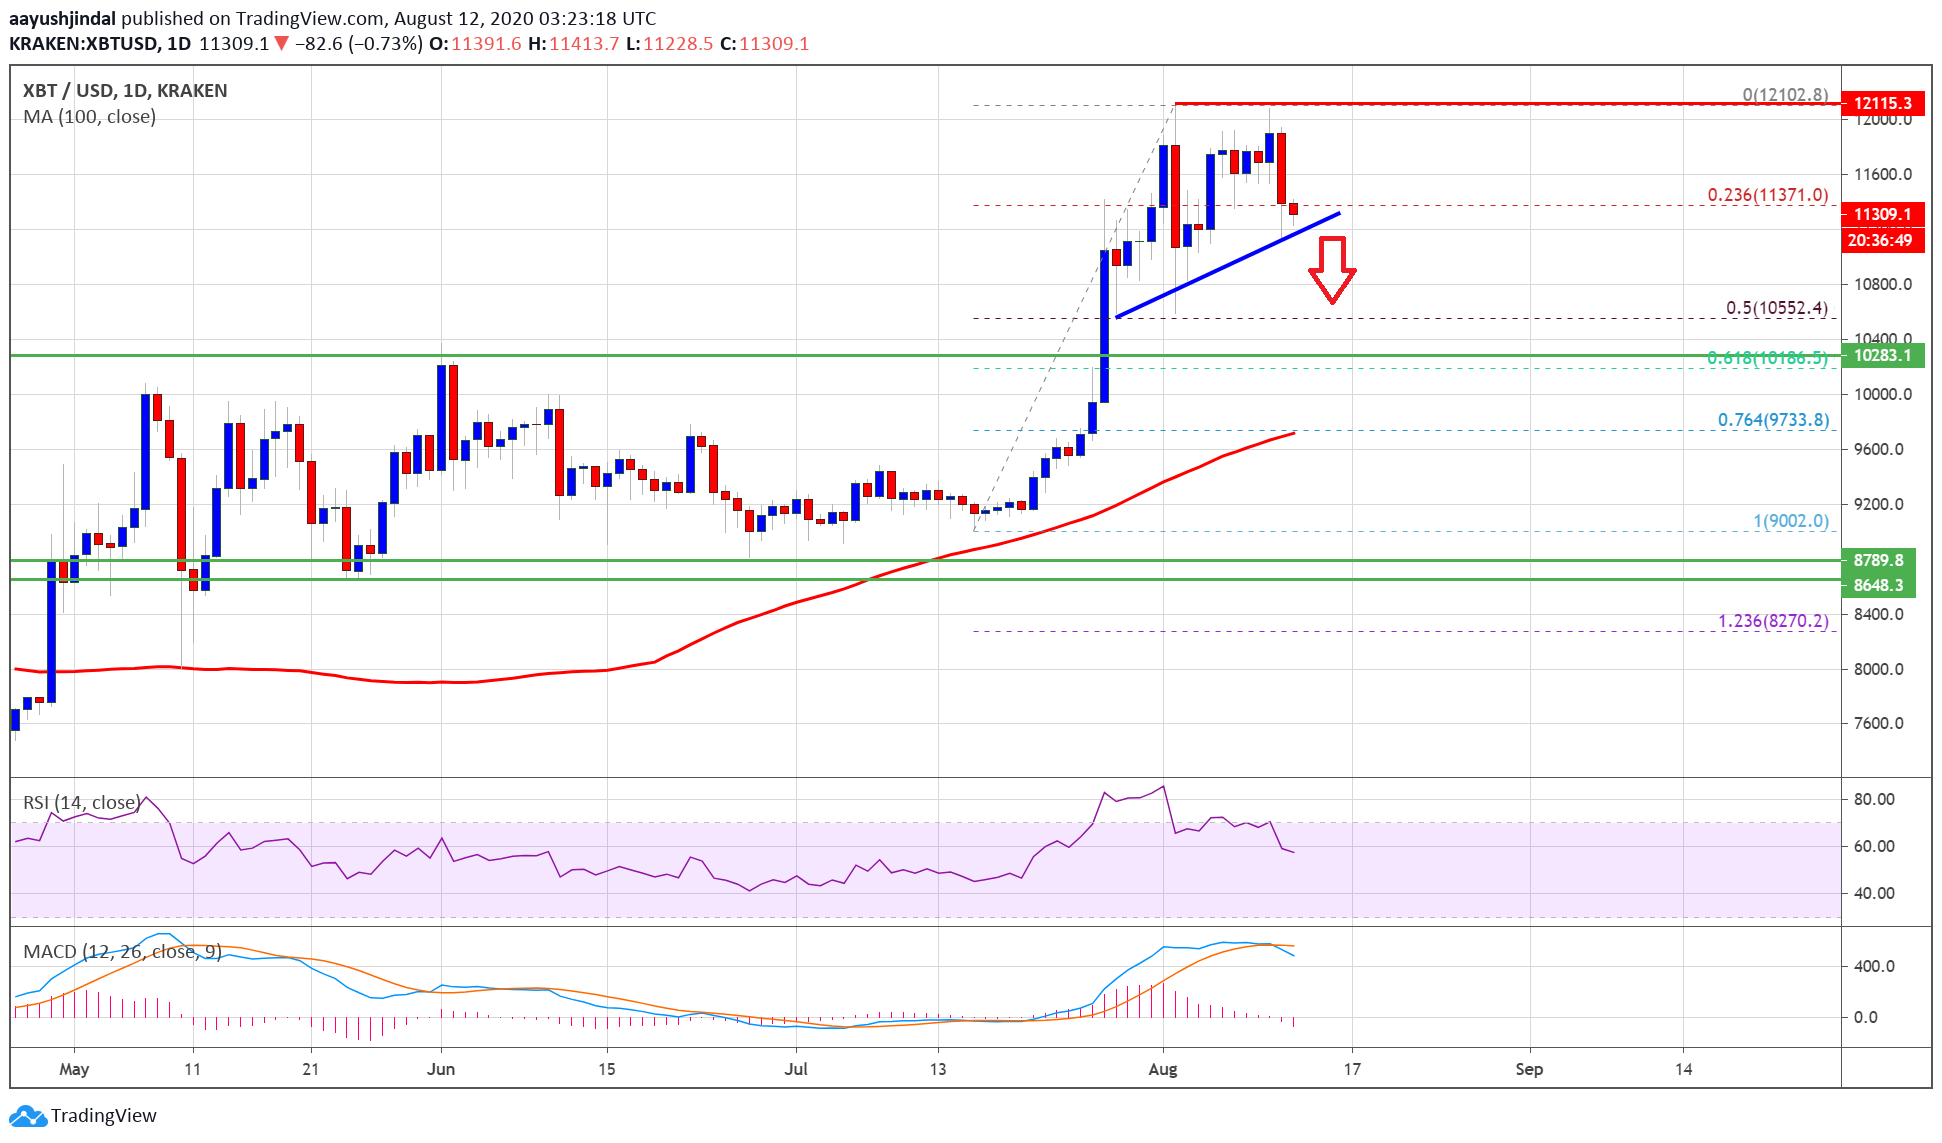
Bitcoin price trades below $11,500: Source: TradingView.com
If the pair breaks the trend line support, there is a risk of an extended decline. The next major support is near the $11,000. The main support is near the $10,500 level or the 50% Fib retracement level of the upward move from the $9,000 swing low to $12,100 swing high.
Fresh Increase?
If bitcoin price stays above the trend line support or $11,200, it could bounce back. An initial resistance is near the $11,500 level, above which the bulls could gain strength.
The main hurdle is still near the $12,000 barrier, above which the price is likely to start another strong rally in the coming days. In the mentioned case, it could rise towards the $12,400 and $12,500 levels.
Technical indicators:
Daily MACD – The MACD is slowly moving into the bearish zone.
Daily RSI (Relative Strength Index) – The RSI for BTC/USD is now correcting lower towards the 50 level.
Major Support Levels – $11,200 followed by $11,000.
Major Resistance Levels – $11,500, $11,800 and $12,000.
OhNoCrypto
via https://www.ohnocrypto.com
Aayush Jindal, Khareem Sudlow