
Analyst: Bitcoin’s Recent Surge Looks Like the Start of 2019’s 250% Rally
- Bitcoin’s flash crash on the weekend has thrown a wrench into the bullish outlook of some analysts.
- Because BTC was rejected at such a crucial level ($12,000), some have suggested that the asset could see a pullback to pre-rally levels in the $9,000s.
- Some analysts are not convinced of this sentiment.
- One trader who predicted Bitcoin’s breakout at the start of 2019 says that the recent price action looks like the bottom of 2018.
- That’s to say, should history rhyme, the leading cryptocurrency is on the verge of a multi-month rally that may bring it to a new all-time high.
Analyst: Bitcoin Looks Now As It Did At the Start of 2019’s Rally
According to the trader that predicted Bitcoin’s breakout at the start of 2019, BTC looks structurally similar to the 2018-2019 bear market bottom:
“Can’t believe I didn’t see it before. On the Weekly, classic pattern I call the “Smooth Transfer of Power” A. Bears get weaker as price descends B. Bulls silently buying all along take control C. Re-test of power D. Lift off Compare to the Monthly one, Crypto Winter ’18-’19.”
The trader is saying that should history rhyme, BTC is on the verge of an extended bull run.

Chart of BTC's price action over the past few months from trader b.biddles (@Thalamu_ on Twitter). Chart from TradingView.com
Related Reading: Eerie Fractal Predicts Bitcoin Will Cross Above $12k Again Very Soon
Not the Only Signal Predicting Long-Term Bull Run
The formation of Bitcoin’s candles isn’t the only trend that analysts see as a signal of an impending long-term bull run.
As reported by Bitcoinist previously, Bitcoin’s “Super Trend” on the weekly chart just printed a bullish candle for the first time since the start of 2019’s rally. The trader who made this observation first wrote in regards to the chart below:
“The supertrend went green on the weekly. Probably no big deal. It’s not like this indicator has marked major macro bull & bear cycles in the past.”

Chart of BTC's macro price action with the so-called Super Trend indicator by trader Byznatine General (@Byzgeneral on Twitter). Chart from TradingView.com
Also corroborating the expectation of the start of a longer-term bull trend, one analyst noted that three of Bitcoin’s long-term moving averages are moving higher in tandem. According to his analysis, the last time this happened was in 2016, prior to the 2,000% rally that took BTC to $20,000:
“BTC Monthly: One measure of a bull market: Price > 26 Hume MA > 9 Simple MA > 21 Exponential MA Twice prior this has signaled a prolonged bull run. Monthly MA’s are like aircraft carriers, i.e., slow to turn. A reversal at this point is unlikely.”
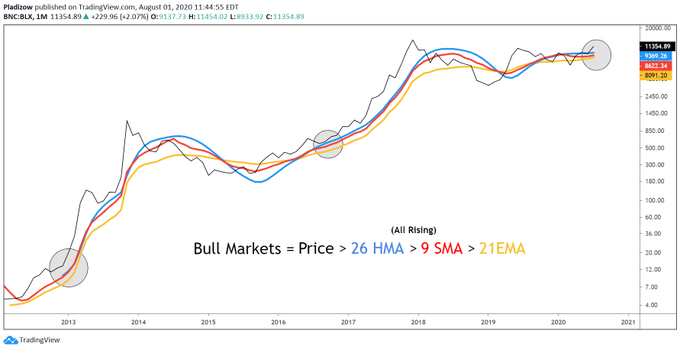
Chart of BTC's macro price action with a long-term moving average analysis by trader "Nunya Bizniz" (@pladizow on Twitter). Chart from TradingView.com
These trends do not 100% confirm that a bull run is imminent. Though, they do show that technically speaking, Bitcoin is more likely to rally than fall.
Featured Image from Shutterstock
Price tags: xbtusd, btcusd, btcusdt
Charts from TradingView.com
Analyst: Bitcoin's Recent Surge Looks Like the Start of 2019's 250% Rally
OhNoCryptocurrency via https://www.ohnocrypto.com/ @Nick Chong, @Khareem Sudlow