
After Surging 20%, Bitcoin Should Have At Least 2 Legs Higher: Analysis
- Bitcoin has continued to erupt higher after failing to break past $11,500 earlier this week. As of this article’s writing, the cryptocurrency is trading at $11,900.
- The asset is now up approximately 20% in the past seven days.
- This strong price performance has made Bitcoin extremely overbought by some technical standards.
- Despite this, a relative strength index analysis by a trader suggests that BTC will see further legs higher in the months higher.
- This is in line with other analysts’ assertions that the leading cryptocurrency will hit $14,000 and $20,000 likely in 2020, then potentially proceed higher in 2021.
Bitcoin Has Room to Rally: RSI Analysis
Bitcoin’s price performance over the past week has been impressive, to say the least. According to data from Coin Market Cap, the asset is up 21% in the past seven days, marking one of the greatest weekly gains in many months.
This recent rally, though, has unfortunately made Bitcoin oversold as per the relative strength index.
The relative strength index, better known as the “RSI,” is an oscillator that attempts to determine whether an asset is overbought, neutral, or oversold. As Investopedia explains:
“The relative strength index (RSI) is a momentum indicator used in technical analysis that measures the magnitude of recent price changes to evaluate overbought or oversold conditions in the price of a stock or other asset.”
According to TradingView, the one-day RSI of Bitcoin has crossed above 85 during the recent rally. This is nearing “extremely overbought” territory, and traditionally means that the top of a trend is near.
Yet an analysis by a cryptocurrency trader has suggested that Bitcoin’s RSI reaching 85 may actually be more bullish, not bearish.
The trader in question shared the chart below on August 1st, noting that Bitcoin has never put in an “intermediate top off an initial 85+ [RSI] close.” He added that “nor has Bitcoin ever had less than 3+ drives above 85″ in a single bull cycle.”
That’s to say, by historical measures, Bitcoin will over the next few months print at least two rallies similar to the one seen over the past week.
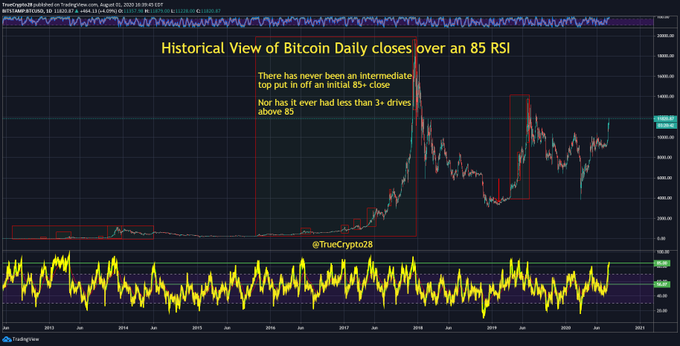
Chart of BTC's macro price action with relative strength index analysis by trader Mr. Anderson (@trueCrypto28 on Twitter). Chart from TradingView.com
Where Will BTC End Up?
Bitcoin may be primed to see further legs higher in the months ahead, but where will the cryptocurrency end up its in terms of its price?
According to crypto analyst Tyler D. Coates, $14,000 by October is possible. As reported by Bitcoinist previously, the trader noted that per a textbook “bull flag” pattern, Bitcoin will hit $14,000 in October or slightly before that.
This optimism has been echoed by Mike Novogratz, CEO of Galaxy Digital. He told CNBC earlier this week that he thinks BTC will hit $14,000 in the next two to three months, then $20,000 by the end of 2020.
Featured Image from Shutterstock
Price tags: xbtusd, btcusd, btcusdt
Charts from TradingVIew.com
After Surging 20%, Bitcoin Should Have At Least 2 Legs Higher: Analysis
OhNoCryptocurrency via https://www.ohnocrypto.com/ @Nick Chong, @Khareem Sudlow