
Technicals Indicate Cardano (ADA) Could Still Rally To $0.15 Despite 7% Pullback
Cardano’s price rallied more than 25% in the past few days and it traded close to $0.1400. ADA is currently down 7%, but it is still holding key supports and likely to resume its surge.
- ADA surged towards the $0.1400 level before correcting lower against the US dollar.
- The price is currently consolidating above the $0.1200 support zone.
- There are two important bullish trend lines forming with support near $0.1200 and $0.1180 on the 4-hours chart of the ADA/USD pair (data source from Kraken).
- The pair is likely to resume its upward move as long as it is above the $0.1100 support.
Cardano (ADA) Holding Uptrend Support
Earlier this month, cardano’s price started a strong increase after it broke the $0.1000 resistance zone. ADA gained bullish momentum above the $0.1200 resistance level and settled well above the 100 simple moving average (4-hours).
The price gained over 25% (outperforming bitcoin) and traded close to the $0.1400 level. A new monthly high was formed near $0.1385 before the price started a downside correction. It corrected lower sharply below the $0.1300 level.
There was a spike below $0.1200, but the bulls protected the $0.1100 zone. ADA recovered and it is currently consolidating above the $0.1200 support zone. More importantly, there are two important bullish trend lines forming with support near $0.1200 and $0.1180 on the 4-hours chart of the ADA/USD pair.
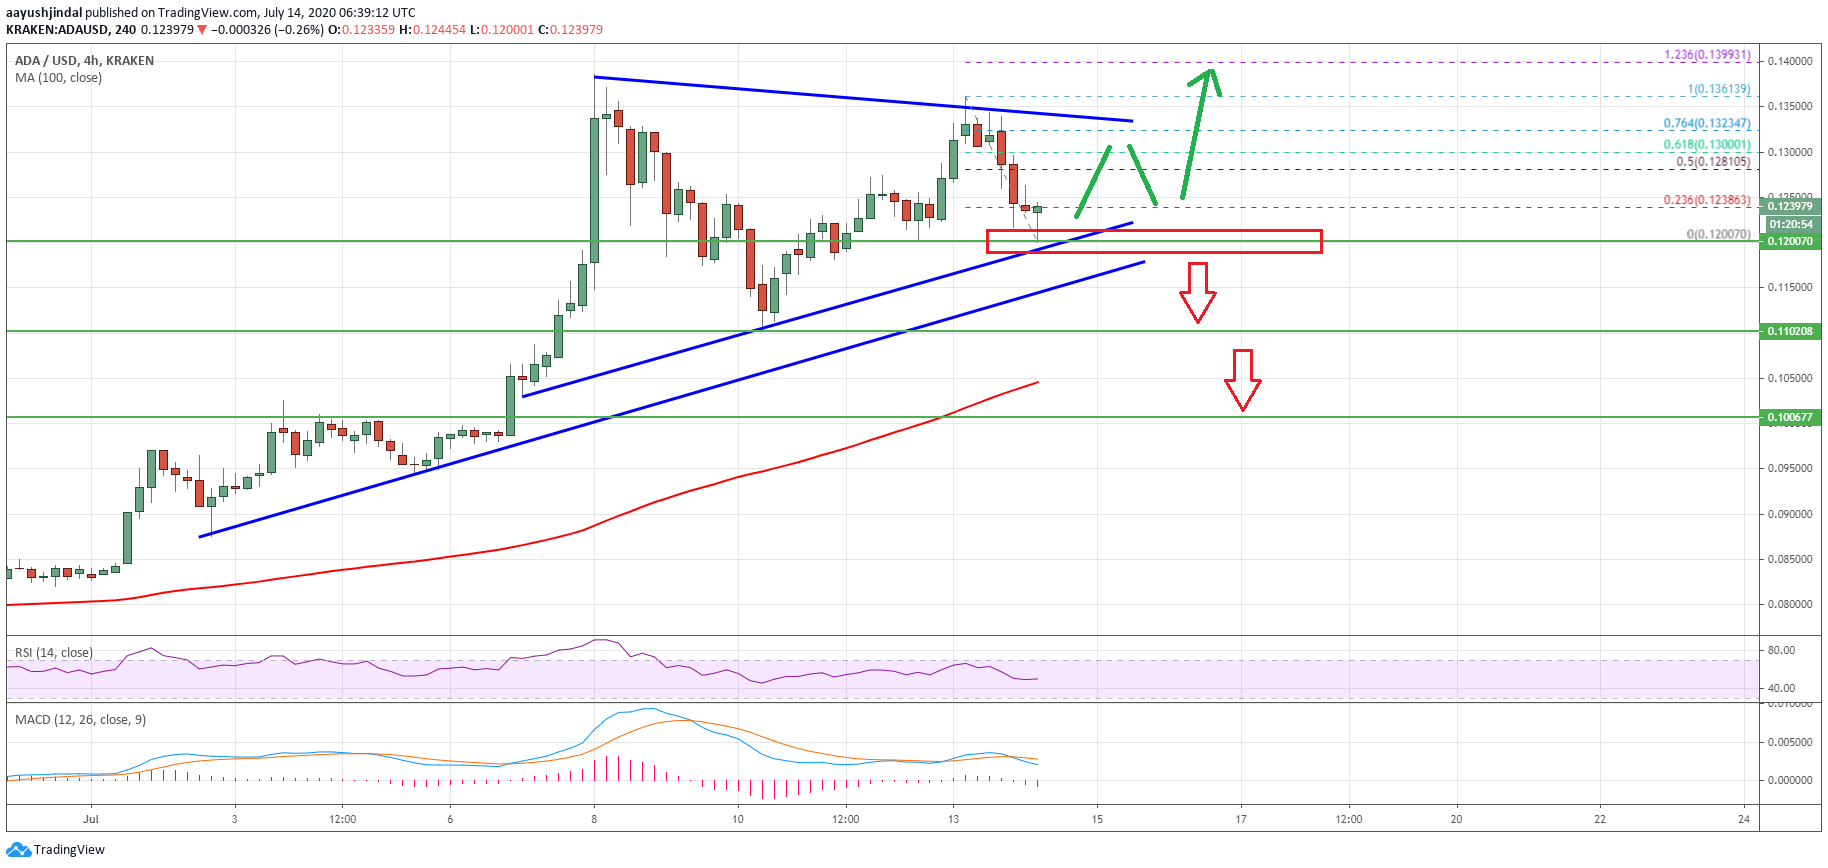
Cardano (ADA) price testing $0.1200. Source: TradingView.com
The recent low was $0.1200 and the price is testing the 23.6% Fib retracement level of the downward move from the $0.1361 high to $0.1200 low. The first major resistance is near the $0.1280 level.
The 50% Fib retracement level of the downward move from the $0.1361 high to $0.1200 low is also near $0.1280. The main resistance is near the $0.1320 level and a connecting bearish trend line on the same chart, above which the bulls are likely to aim a new monthly high above $0.1400. In this case, the price could test the $0.1500 resistance.
Chances of Downside Break?
If cardano’s price fails to stay above the $0.1200 support, it could correct lower towards the $0.1100 level. Any further gains could intiaite a major decline towards the $0.1000 level.
An intermediate support might be near the 100 simple moving average (4-hours) and $0.1050. A successful close below the $0.1000 support may perhaps push the price into a bearish zone.
Technical Indicators
4-hours MACD – The MACD for ADA/USD is showing a few bearish signs.
4-hours RSI (Relative Strength Index) – The RSI for ADA/USD is currently just below the 50 level.
Major Support Levels – $0.1200, $0.1100 and $0.1000.
Major Resistance Levels – $0.1280, $0.1320 and $0.1400.
Take advantage of the trading opportunities with Plus500
Risk disclaimer: 76.4% of retail CFD accounts lose money.
OhNoCrypto
via https://www.ohnocrypto.com
Aayush Jindal, Khareem Sudlow