
Stellar (XLM) Smashes Crucial Resistance: $0.12 Could Be Next
Stellar (XLM) gained a strong bullish momentum and broke the $0.0980 resistance against the US Dollar. XLM price is showing bullish signs and it might continue to rise towards $0.1200.
- There was a sharp upward move from the $0.0880 support zone against the US dollar.
- The price broke the main $0.0980 resistance area and traded to a new monthly high at $0.1053.
- There is a key bullish trend line forming with support at $0.0950 on the 4-hours chart of the XLM/USD pair (data source from Coinbase).
- The pair is likely to continue higher towards $0.1200 as long as it is above $0.0950.
Stellar (XLM) Surges 8%
In the past few days, stellar (XLM) formed a strong support base above the $0.0850 level against the US Dollar. It started a fresh increase above the $0.0920 and $0.0950 resistance levels (outpacing bitcoin, ETH and ripple).
It opened the doors for more gains above the main $0.0980 resistance and the price settled well above the 100 simple moving average (4-hours). The bulls pushed the price above the $0.1000 level and a new monthly high is formed near $0.1053.
XLM is currently consolidating gains near the $0.1020 level. An immediate support is near the 23.6% Fib retracement level of the recent rally from the $0.0887 low to $0.1053 high.
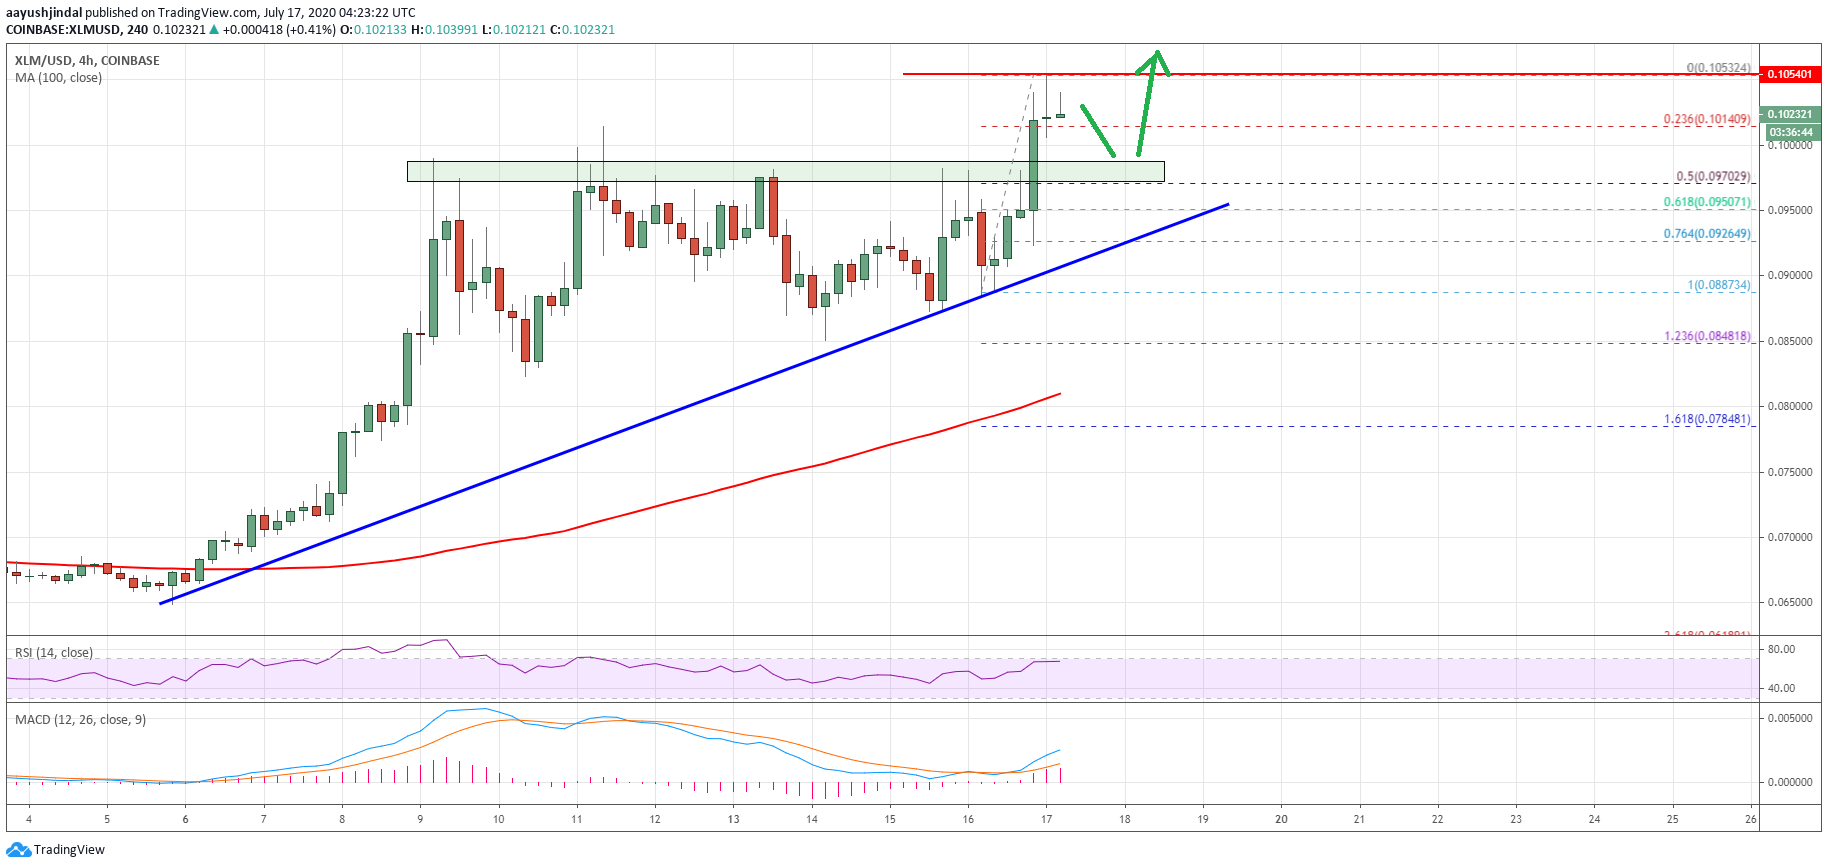
Stellar (XLM) price above $0.1000. Source: TradingView.com
There is also a key bullish trend line forming with support at $0.0950 on the 4-hours chart of the XLM/USD pair. The trend line is close to the 50% Fib retracement level of the recent rally from the $0.0887 low to $0.1053 high.
On the upside, the $0.1050 level is an immediate resistance. A successful break above the recent high could open the doors for more gains towards the $0.1120 and $0.1200 levels in the coming days.
Uptrend Support
If XLM price corrects lower, the bulls are likely to protect the $0.1000 and $0.0980 support levels. The main uptrend support is near the $0.0950 level (the previous breakout zone).
A downside break below the $0.0980 and $0.0950 support levels may perhaps initiate a larger decline towards the 100 simple moving average (4-hours) or $0.0800.
Technical Indicators
4-hours MACD – The MACD for XLM/USD is gaining momentum in the bullish zone.
4-hours RSI (Relative Strength Index) – The RSI for XLM/USD is currently well above the 60 level.
Major Support Levels – $0.1000, $0.0980 and $0.0950.
Major Resistance Levels – $0.1050, $0.1120 and $0.1200.
Take advantage of the trading opportunities with Plus500
Risk disclaimer: 76.4% of retail CFD accounts lose money.
OhNoCrypto
via https://www.ohnocrypto.com
Aayush Jindal, Khareem Sudlow