
New Analysis Shows Bitcoin Is Structurally Similar to 2018’s $3k Bottom
After pushing as high as $9,300, Bitcoin bulls faced yet another strong sell-off on Thursday. The cryptocurrency slid from that local high to a low of ~$8,930 in a number of hours in a move that liquidated dozens of millions.
Despite this drop, there remain multiple valid analyses indicating that Bitcoin is about to press higher.
Related Reading: Crypto Tidbits: Bitcoin At $9k, Grayscale Ethereum Trust, Cryptocurrency & PayPal
Bitcoin’s Current Range Is Similar to 2018’s Bottom
Looking at Bitcoin’s recent price action, it’s easy to call it “boring.” Save for a few deviations, the cryptocurrency has traded between $8,500 and $10,000 for the past two months now.
Some analysts have called the consolidation a textbook “distribution” pattern, seen at the top of bull trends. Postulating that a decline under $7,000 is possible if Bitcoin is truly distributing, one analyst commented:
“A couple more clues developing that lend themselves to HTF distribution. 1. Rising Demand on the verge of failing. 2. Side by side, ascent vs descent with selling the dominant pressure from volume.”
Yet one derivatives trader observed on July 2nd that structurally speaking, the consolidation may be bullish.
He shared the chart below to illustrate this sentiment, showing that Bitcoin’s price action does have similarities to 2018’s ~$3,000 bottom.
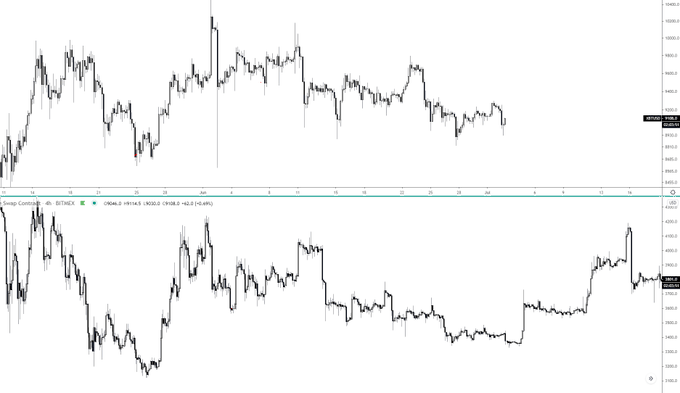
Comparison of BTC's recent range trading to the 2018 $3k bottom by Cantering Clark (@CanteringClark on Twitter). Chart from TradingView.com
Should the similarities persist, Bitcoin will break out of the consolidation in August, then potentially move into a bull market.
After all, what followed 2018’s bottom was a rapid 300% move from ~$3,500 to $14,000 in six months. BTC rallying 300% from here would imply a price of $36,000.
There Are Other Signs an Upmove Is Imminent
In comparing Bitcoin’s recent price action to the bottom of 2018’s bear market, the analyst is suggesting that a leg higher is possible.
Fortunately for bulls, a confluence of fundamental and technical trends indicates this will be the case.
Nexo co-founder Antoni Trenchev commented on his Bitcoin outlook at Blockdown, a digital crypto conference.
He said that because of BTC’s supply cap and due to money printing by central banks, the asset is on track to hit $50,000 this year:
“You can’t have the President of the United States tweeting out that the money supply, the total number of Bitcoin should be expanded from 21 million. You just can’t have that. So yes, I’m sticking to my prediction of 50K until the end of the year.”
Also, a trader recently observed that the premium of Grayscale Bitcoin Trust shares over the spot BTC has plunged. The last time the premium was this low was when Bitcoin bottomed in 2018.
Featured Image from Shutterstock
Price tags: xbtusd, btcusd, btcusdt
Charts from TradingView.com
New Analysis Shows Bitcoin Is Structurally Similar to 2018's $3k Bottom
OhNoCrypto
via https://www.ohnocrypto.com
Nick Chong, Khareem Sudlow