
Bitcoin Hesitates But Indicators Suggest BTC Could Surge Above $9,300
Bitcoin is slowly moving higher and it recently tested $9,300 against the US Dollar. BTC is now trading well above the 100 hourly SMA, and it is likely to surge above $9,300.
- Bitcoin is showing a few positive signs above the $9,200 and $9,150 levels.
- The price revisited the $9,300 resistance and it is now trading well above the 100 hourly simple moving average.
- There is a significant bullish trend line forming with support at $9,180 on the hourly chart of the BTC/USD pair (data feed from Kraken).
- The pair could correct a few points, but it is likely to break the $9,300 hurdle for more upsides.
Bitcoin Price is Eyeing Upside Break
After settling above the $9,000 level, bitcoin started a slow and steady rise against the US Dollar. BTC surpassed the $9,200 resistance level and it is now trading well above the 100 hourly simple moving average.
The recent upward move was positive and the price gained traction after it broke the $9,220 resistance and a connecting bearish trend line on the hourly chart. It opened the doors for more gains and the price climbed towards the $9,300 resistance.
A high is formed near $9,301 and the price is currently correcting lower. It tested the 23.6% Fib retracement level of the recent upward move from the $9,061 swing low to $9,301 high.
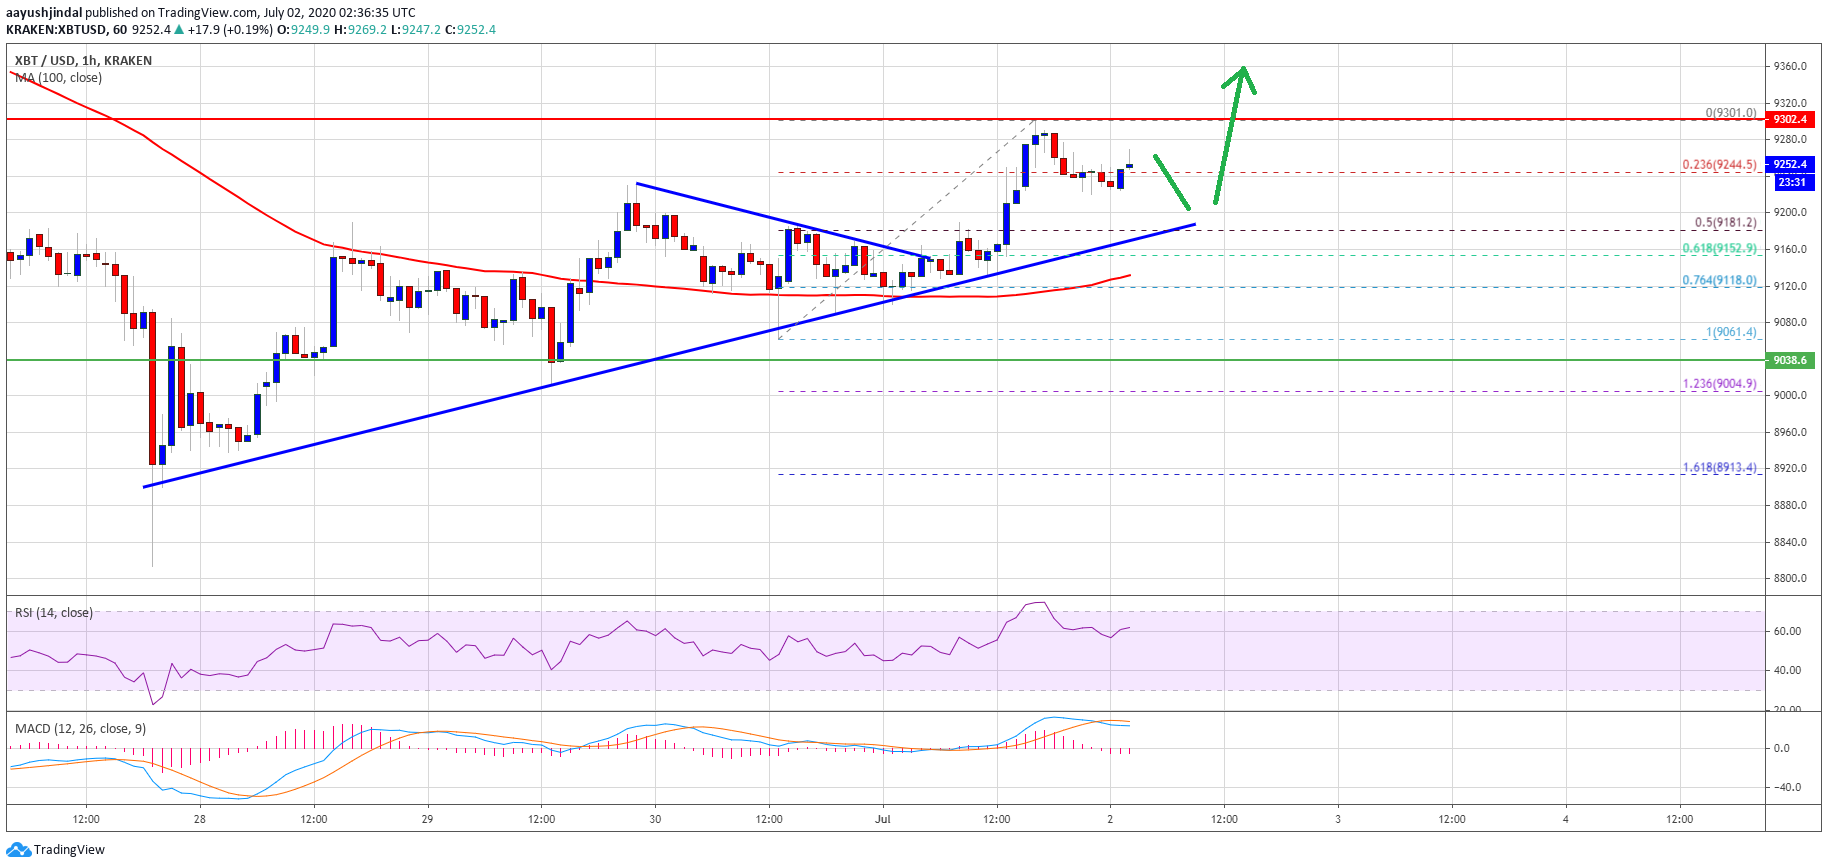
Bitcoin price breaks $9,200: Source: TradingView.com
On the downside, there are many decent supports forming near $9,180 and $9,160. There is also a significant bullish trend line forming with support at $9,180 on the hourly chart of the BTC/USD pair. The trend line is close to the 50% Fib retracement level of the recent upward move from the $9,061 swing low to $9,301 high.
The main hurdle on the upside is still near the $9,300 level. A successful break and close above $9,300 may perhaps clear the path for more gains in the coming sessions. The next key resistance is near the $9,500 and $9,550 levels.
Another Bearish Reaction in BTC?
The trend line support is a major barrier for the bears near $9,180. If bitcoin trades below the trend line support, it could decrease the chances of an upside break above $9,300 in the short-term.
The next support is near the $9,120 and the 100 hourly SMA. The main breakdown support is now near the $9,000 level, below which the bulls are likely to lose control.
Technical indicators:
Hourly MACD – The MACD is slowly moving back into the bearish zone.
Hourly RSI (Relative Strength Index) – The RSI for BTC/USD is currently near the 60 level.
Major Support Levels – $9,180, followed by $9,120.
Major Resistance Levels – $9,300, $9,340 and $9,500.
OhNoCrypto
via https://www.ohnocrypto.com
Aayush Jindal, Khareem Sudlow