
Binance Coin long-term Price Analysis: 31 July
Binance Coin is, like the rest of the altcoin market, a beneficiary of Bitcoin’s pump over $11,000. The exchange token sits on the edge of the top-10 coins in the market with a market capitalisation of $2.89 billion, behind Crypto.com Coin. With a 25-hour gain of just 0.75 percent at press time, while alts above it are surging by 4 percent, BNB is likely to fall below in price looking at the patterns forming.
The long-term daily chart of Binance Coin signaled a breakout of a key level, owing more to the Bitcoin breakout, rather than its own strong technicals. Since the end of March, when the Black Thursday drop pushed BNB’s price to as low as $9.05, the daily charts have been trending in an ascending triangle. On two occasions did the price try to move past the base resistance at $18.75 – in late-April and late-May, but failed on both occasions. This cyclical movement of rise to resistance and fall into range formed a half-eclipse, which hit the lower bottom of the triangle during the third attempt at a breakout.
In early July when the altcoin was trading $15.11 there was a move up, but again the resistance at $18.75 could not be broken. Following a drop to support at $17.42 and $17.09 respectively on 19 July the price again bounced off. This bounce saw Binance Coin create four successive green candlesticks prior to the Bitcoin breakout which allowed the former to push past the $18.75 resistance for the first time in four attempts. Currently trading at $19.97, BNB’s highest price since early-March a inklings of sideways trading is seen.
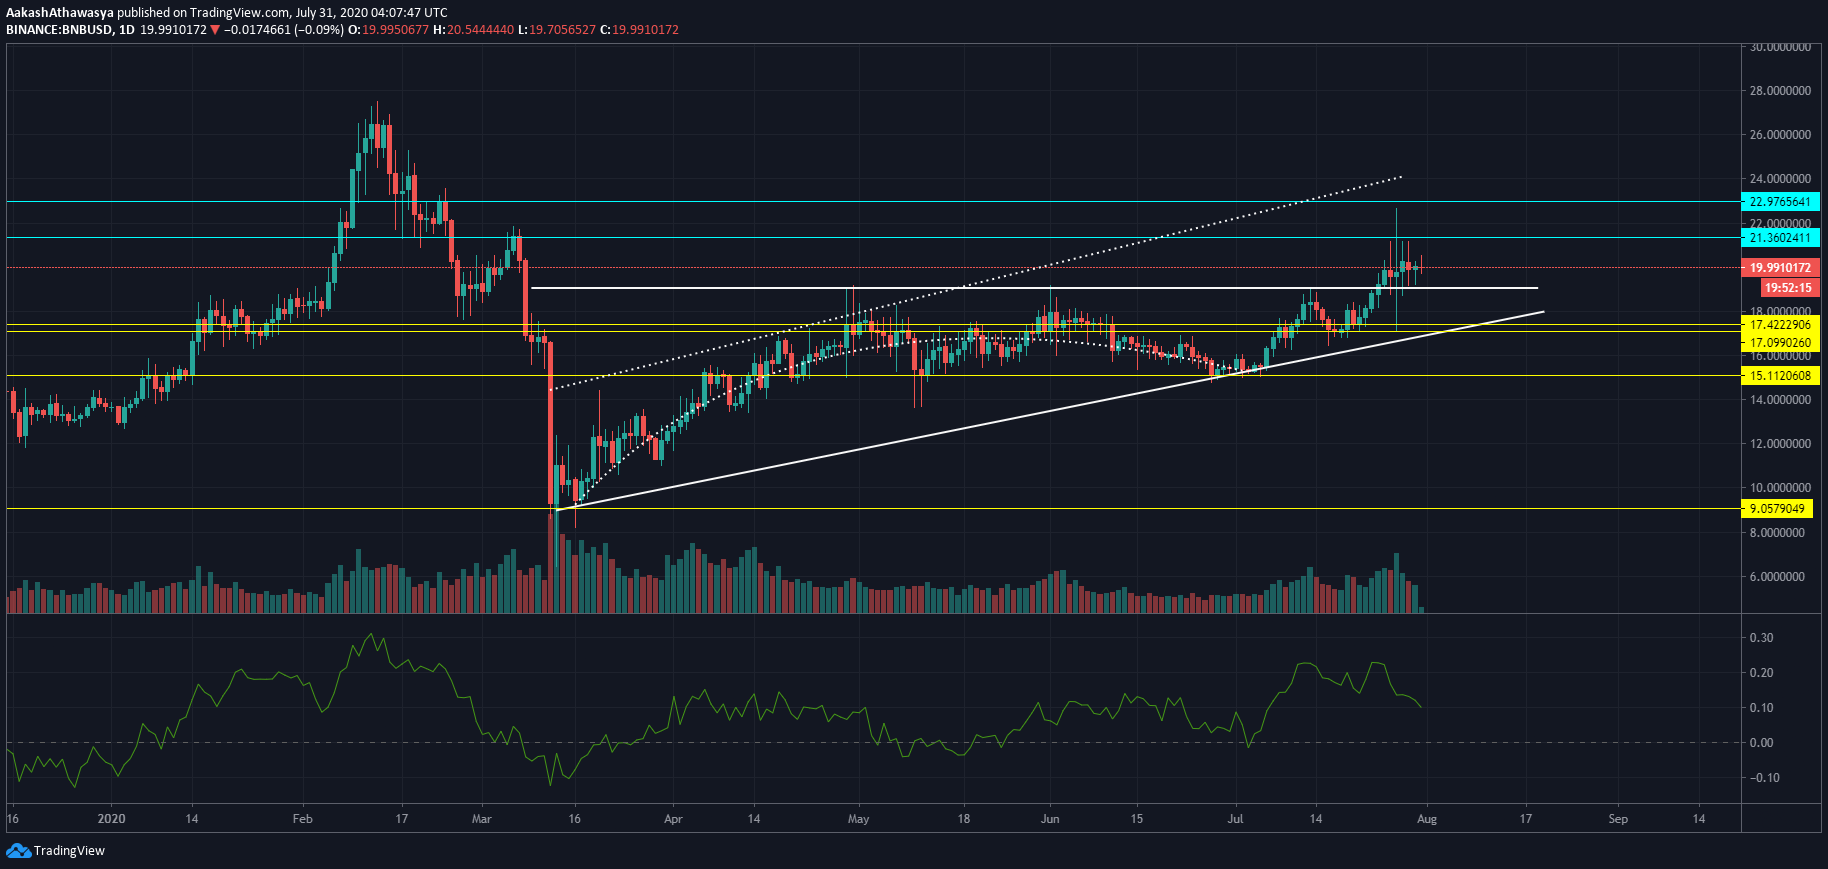
Source: BNBUSD via Trading View
Money inflow in BNB markets has been declining since 24 July despite the price holding strong. Over the past week, the Chaikin Money Flow indicator has dropped from 0.22 to 0.1, perhaps because some investors are liquidating their BNB for Bitcoin or other rapidly increasing altcoins, or using the exchange token as a base trading pair for similar transactions. Either way, its clear that Binance Coin’s net money flow is dropping despite the rising price.
While the breakout over the ascending triangle over the $18.75 resistance is a strong move up, and sideways trading, to consolidate this price point, is beginning, it is unlikely to last given the drop in money inflow. Further, if the anchoring Bitcoin price reverses then Binance Coin’s price will invariably drop. If the exchange token falls, the triangle is unlikely to hold support given it is looking to squeeze out, but the price will move into an upward channel, between the triangle’s lower bottom and the upward dotted line. The key levels to look out for are at the support levels at $17.09 and $17.42 and the range between $15.12 to $17.09.
OhNoCrypto
via https://www.ohnocrypto.com
Aakash Athawasya, Khareem Sudlow