
Bitcoin Could Narrowly Avoid a Downside Thrust if it Closes Above 100 SMA
Bitcoin is declining steadily and trading below $9,400 against the US Dollar. BTC could decline sharply below $9,250 if it fails to reclaim the 100 hourly simple moving average.
- Bitcoin is slowly moving lower and now trading well below the $9,500 pivot level.
- The price is showing a few bearish signs below $9,400 and the 100 hourly simple moving average.
- There is a crucial declining channel or a bullish flag pattern forming with resistance near $9,400 on the hourly chart of the BTC/USD pair (data feed from Kraken).
- The pair could decline sharply below $9,250 if there is no close above the channel resistance.
Bitcoin Price Sliding Towards $9,250
After forming a short-term top near the $9,500 level, bitcoin price started a fresh decline against the US Dollar. BTC broke the key $9,500 support and pivot zone to start a downside correction.
It broke the 23.6% Fib retracement level of the upward move from the $8,907 low to $9,600 swing high. The bears were able to push the price below the $9,400 level and the 100 hourly simple moving average.
It seems like there is a crucial declining channel or a bullish flag pattern forming with resistance near $9,400 on the hourly chart of the BTC/USD pair. On the downside, the first key support is seen near the $9,250 level. It is close to the 50% Fib retracement level of the upward move from the $8,907 low to $9,600 swing high.
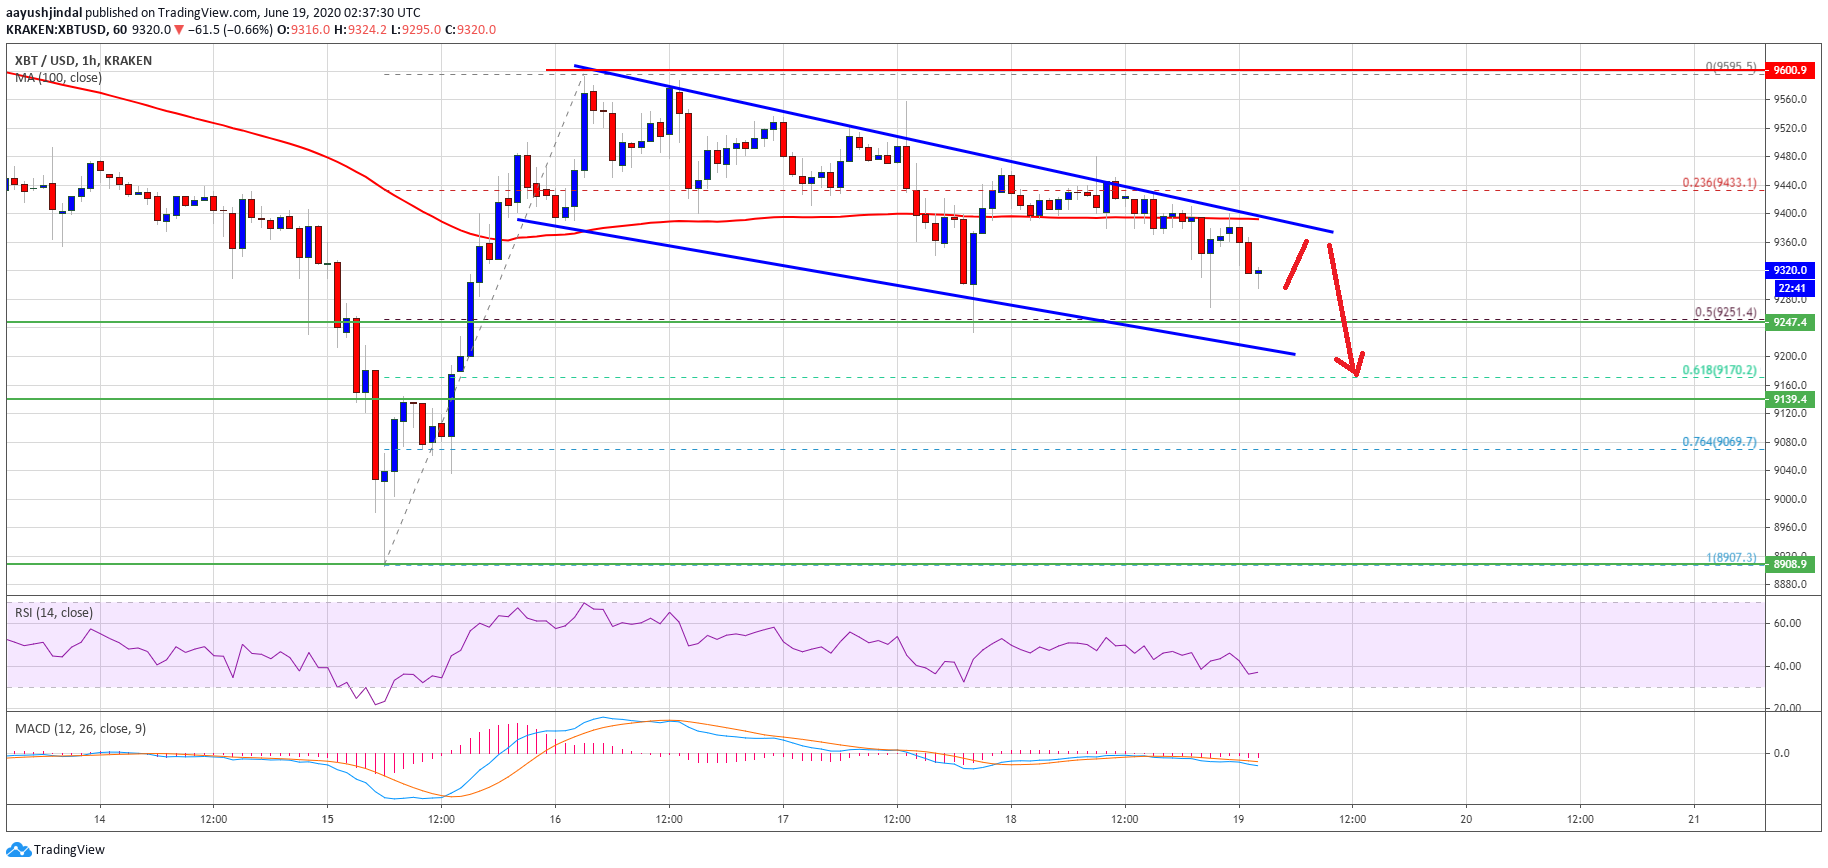
Bitcoin price chart: Source: TradingView.com
Bitcoin is clearly struggling to clear the channel resistance and the 100 hourly SMA to resume its upside above $9,500. Therefore, there is a risk of more losses below the $9,250 support level.
The next major support is near the $9,140 level, below which the price will most likely continue lower towards the $9,000 support level in the near term.
Upside Break in BTC?
If bitcoin manages to clear the channel resistance at $9,400 and the 100 hourly SMA, the bulls are likely to gain strength. The first key resistance is near the $9,500 level, above which the price could revisit the $9,600 swing high.
Any further gains could open the doors for a larger upward move towards the main $10,000 resistance (as discussed using the daily chart).
Technical indicators:
Hourly MACD – The MACD is slowly gaining pace in the bearish zone.
Hourly RSI (Relative Strength Index) – The RSI for BTC/USD is now well below the 50 level, with a bearish angle.
Major Support Levels – $9,250 followed by $9,080.
Major Resistance Levels – $9,400, $9,500 and $9,800.
OhNoCrypto
via https://www.ohnocrypto.com
Aayush Jindal, Khareem Sudlow