
Data Snippet - Price targets for the next Ripple bull run
Various technical indicators can be used if crypto markets re-enter a broad multi-month bullish rally. Although each indicator provides slightly different support and resistance levels, a single indicator is unlikely to give any trader complete confidence during periods of price discovery. Used together, zones of resistance confluence and trade exits can be determined despite no prior price history.
Perhaps the most common and widely used are Fibonacci retracement levels (Fibs), which are drawn from the extreme high to the extreme low for any price movement, or vice versa. Within this price range, static horizontal support and resistance lines are drawn, which can be thought of as potential reversal zones for the spot price. These are levels which many traders often use to open or close trades.
XRP
Fib Extensions: 1.618 From January 2018 all-time high and September 2018 low: US$4.434 1.618 From February 2020 high and March 2020 low: US$0.468 2.618 From February 2020 high and March 2020 low: US$0.671
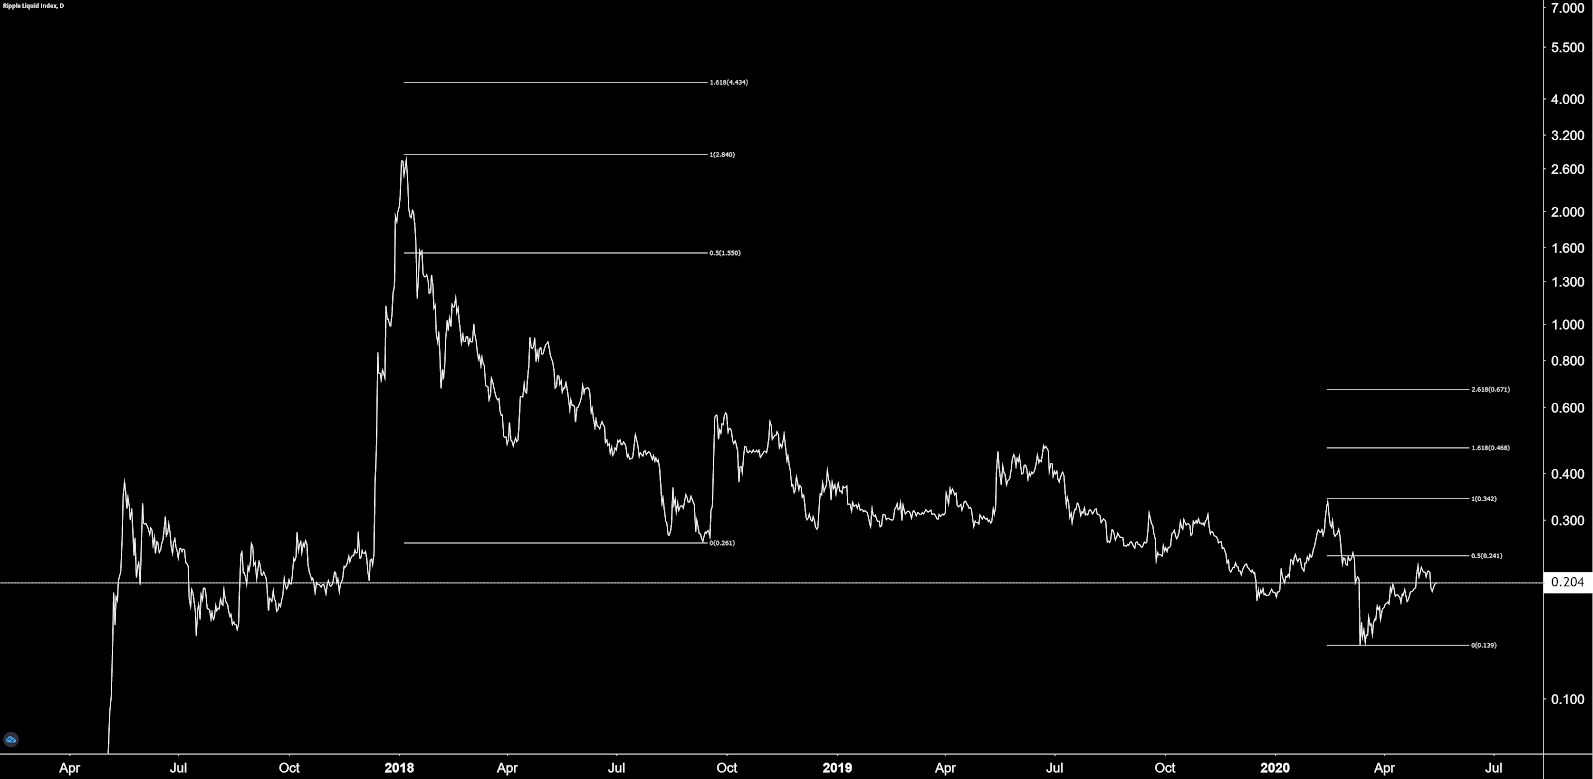
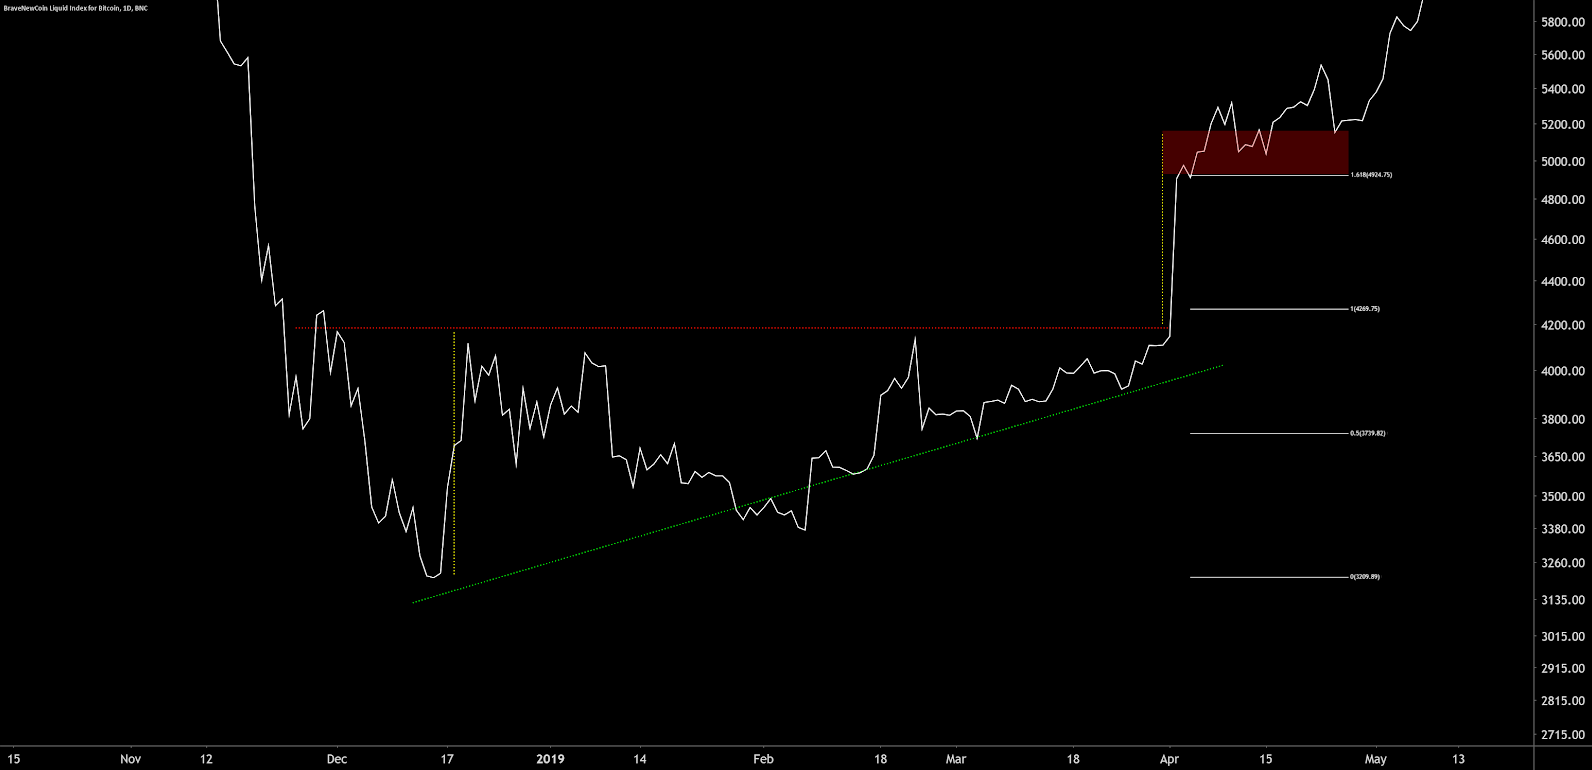
Fibs also include Fibonacci Extensions which give additional support/resistance levels above or below the extreme high to an extreme low of any price movement, the 1.618 and 2.618 Fibonacci extensions being the most widely used. The 1.618 fib extension, in conjunction with a measured move, is also frequently used when determining price targets for chart patterns
Pivot Points are calculated based on the high, low, and close of the previous period. The pivots print at the beginning of the selected period and do not change until the selected period has changed. The yearly pivots print on January 1st of each year and remain the same for the entire year. Monthly pivots are recalculated at the end of each month and print at the beginning of each month.
Support and resistance levels, S1, R1, S2, R2, etc., are then calculated from the main reference pivot. The current yearly pivots are:
S1 - US$0.076 P - US$0.292 R1 - US$0.407 R2 - US$0.627 R3 - US$0.737 R4 - US$0.856 R5 - US$0.982
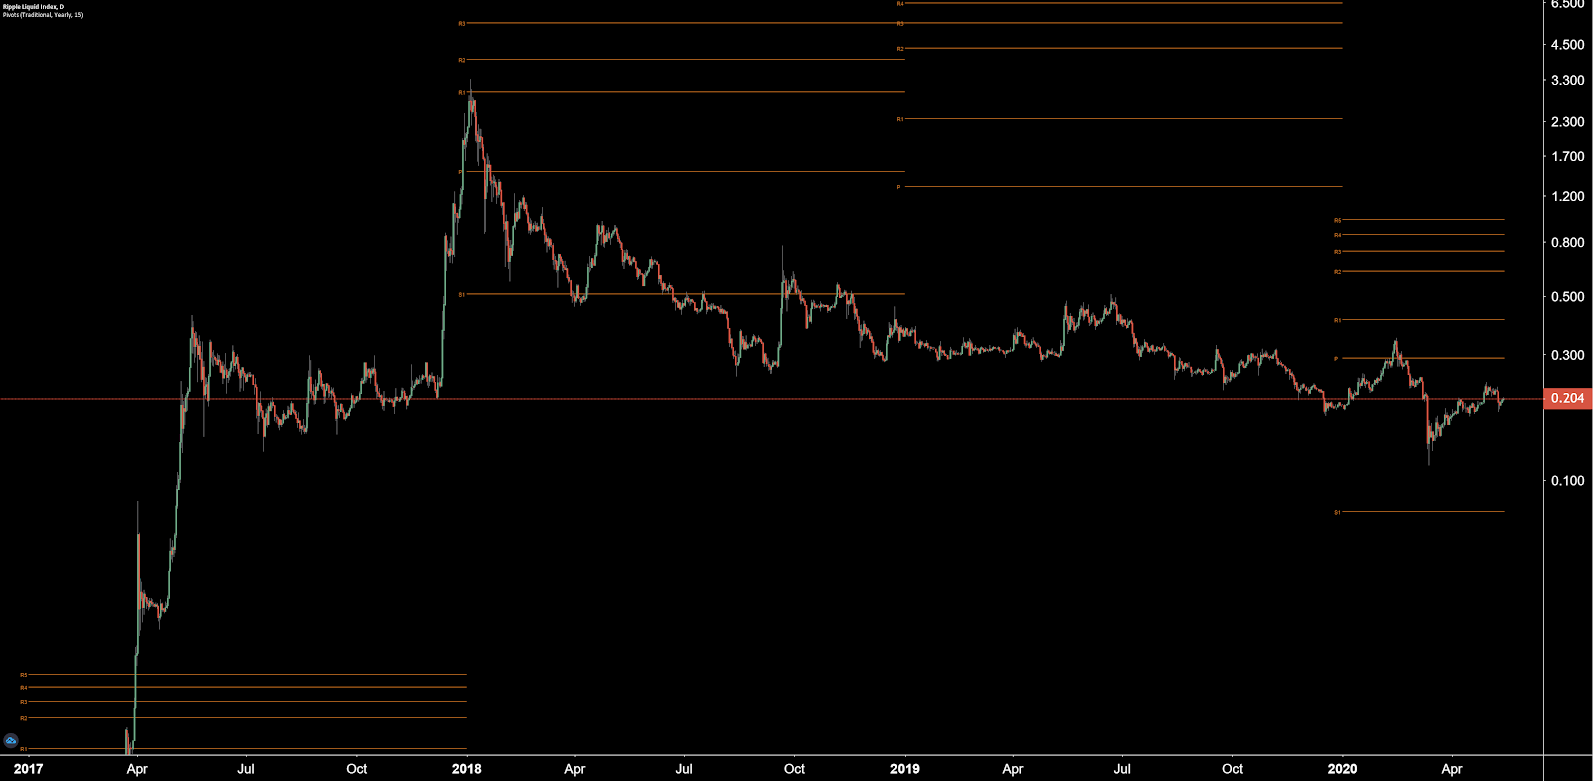
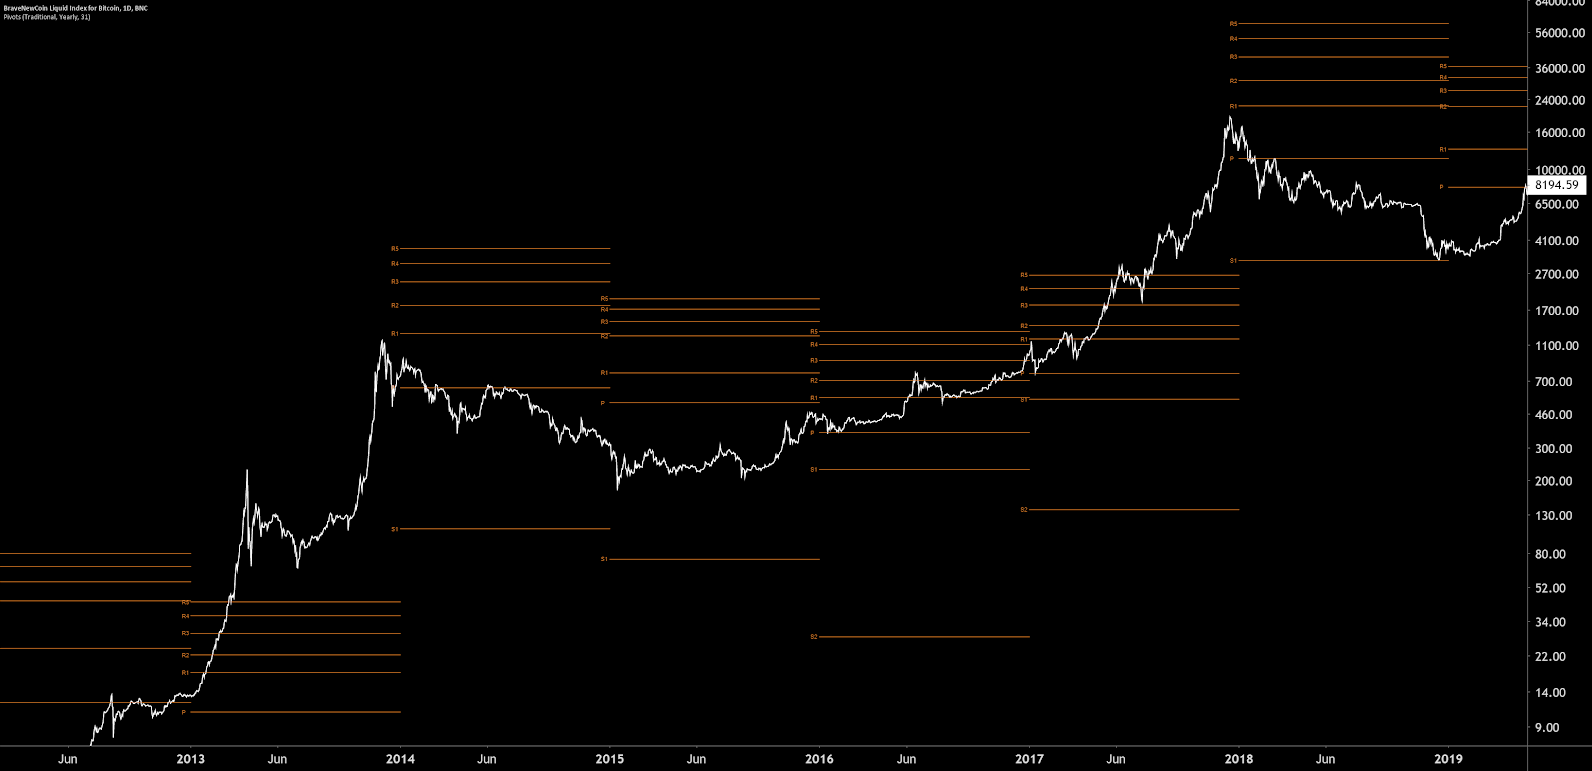
Pivots condense in low volatility environments and expand in high volatility environments. Backtesting reveals yearly pivots were unable to correctly predict the ultimate target of the 2013 or 2017 bull rally. The Bitcoin price far exceeded all of the 2013 and 2017 yearly resistance pivots, but found support exactly on the 2018 yearly S1 pivot. In general, pivots can be thought of as a support and resistance ladder, not necessarily a highly likely target.
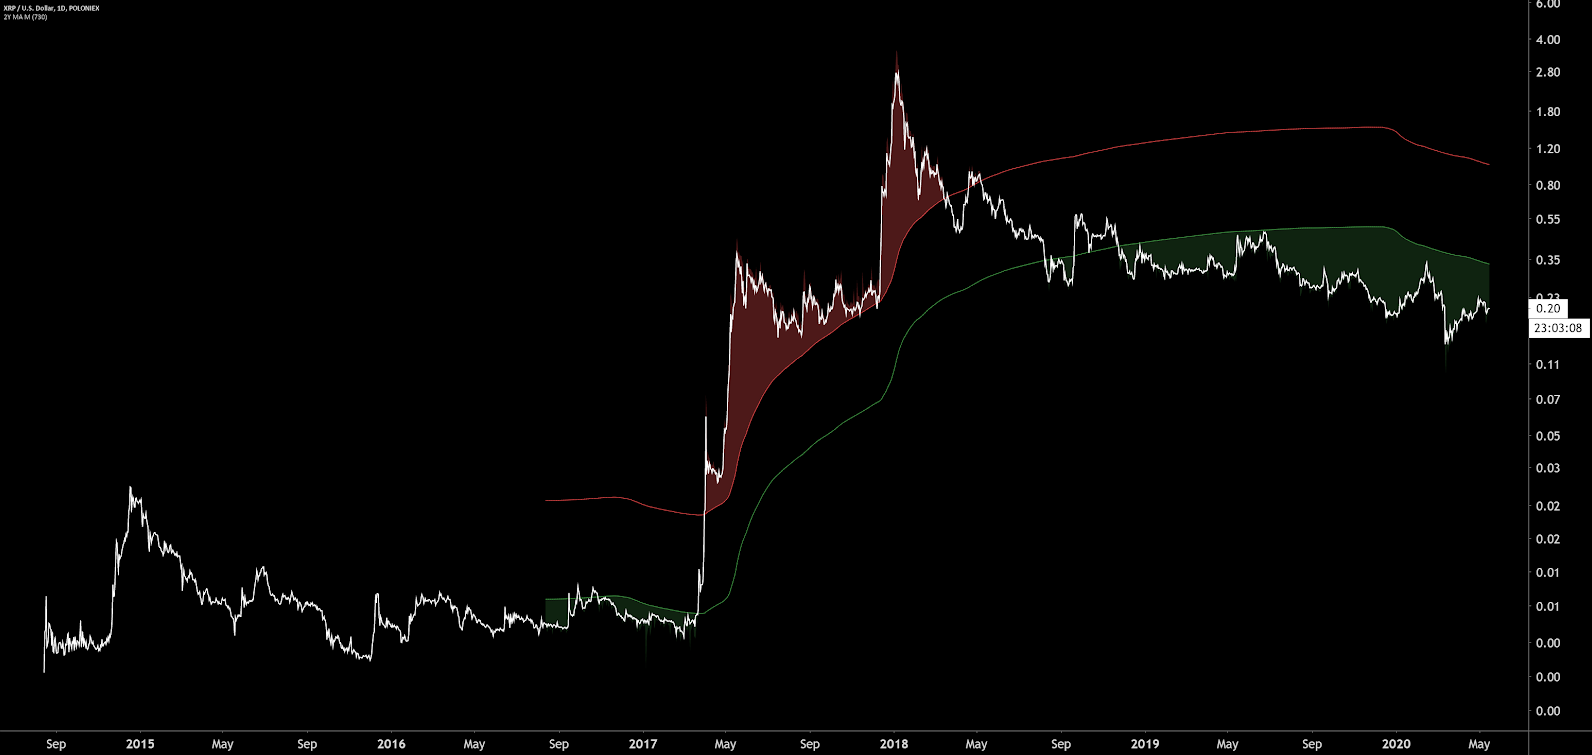
Historic price averages can also provide a band of most likely price targets around a high and low zone. Using backtesting, various iterations of any high timeframe price average can be used, so long as previous highs can be accurately predicted.
Prices below the moving average can be treated as areas that will likely find support and should be considered oversold conditions. Prices above some multiple of the moving average can be treated as zones more likely to find resistance and should be considered overbought conditions.
The two-year moving average currently provides a lower limit of US$0.33. The two-year multiplier currently provides an upper limit of US$1.00
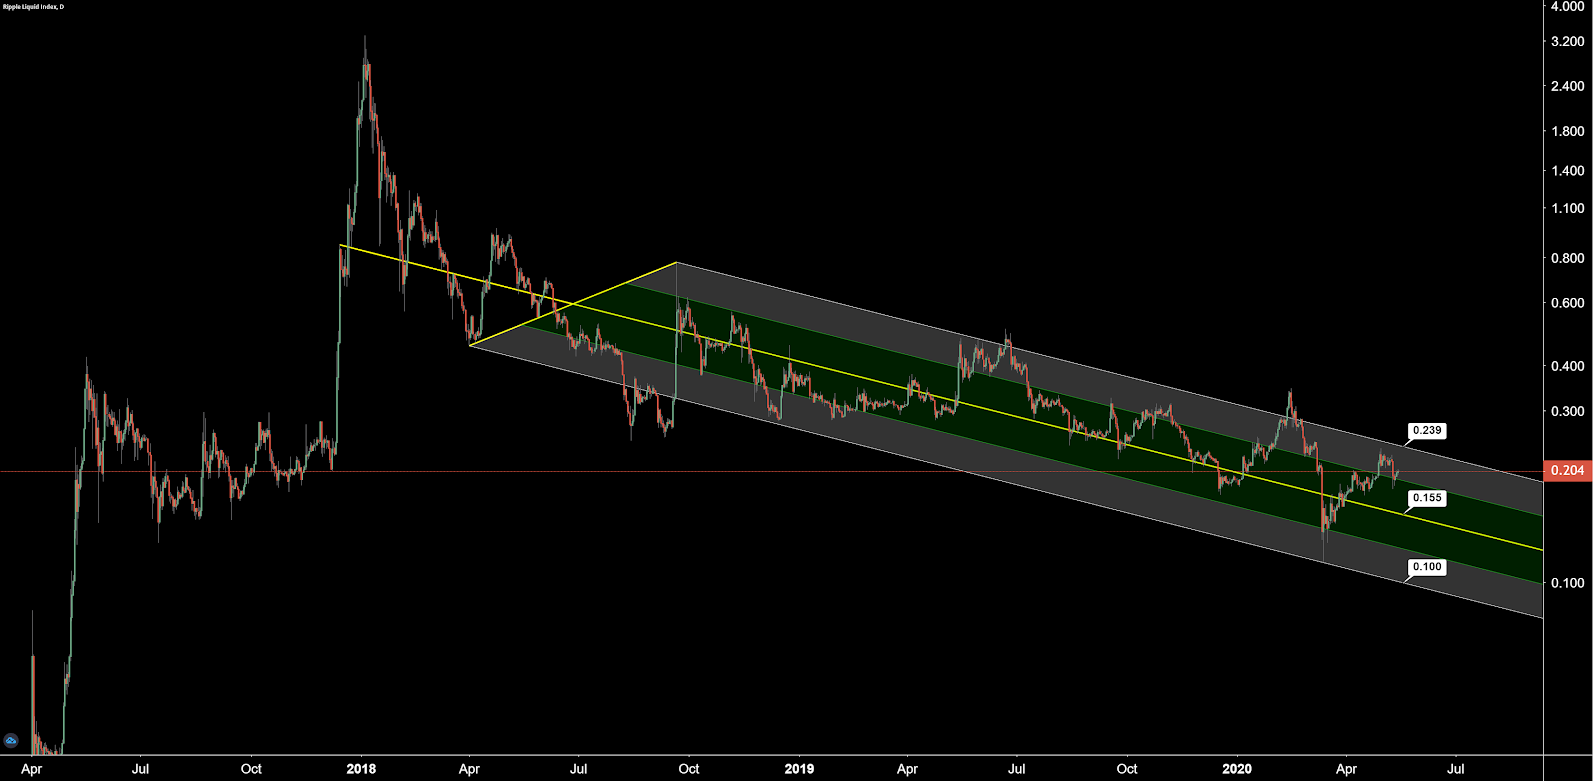
Most coins have both not had enough trading history and not held a continuous trend over multiple years. In this case, pitchforks may be a preferred intermediate trend channel.
The pitchfork is drawn from three points; an extreme high or low, and two other highs and lows. The median line gives the expected mean reversion target throughout the trend as the price will continually attempt to return to this diagonal.
Each diagonal of the pitchfork can be thought of as a potential reversal zone or support/resistance line. The upper blue diagonal zone being ‘most overbought’ or the top bounds of the trend and the lower blue diagonal zone being ‘most oversold’ or the bottom bounds of the trend.
Pitchfork (currently bearish)
Lower Limit - US$0.10 Median Line - US$0.155 Upper Limit - US$0.229
OhNoCrypto
via https://www.ohnocrypto.com
, Khareem Sudlow