
Data Snippet - Rare technical event suggests a possible trend shift for Bitcoin
TODAY WE’RE LOOKING INTO THE ICHIMOKU CLOUD TO UNDERSTAND BITCOIN PRICE TRENDS:
DETAILED EXPLANATION:
The Ichimoku Cloud (Cloud) is a visually complex but easy to understand system of dynamic support and resistance which regularly yields actionable and profitable trading signals. The Cloud relates to many other trading principles and concepts, including but not limited to; moving average strategies, chart patterns, Dow Theory, Elliott Waves, and Fibonacci levels.
The Cloud consists of four metrics to indicate if a trend exists as shown in above chart; the current price in relation to the Cloud, the color of the Cloud (red for bearish, green for bullish), the Tenkan (T) and Kijun (K) cross, and the Lagging Span. The best entry always occurs when most of the signals flip from bearish to bullish, or vice versa.
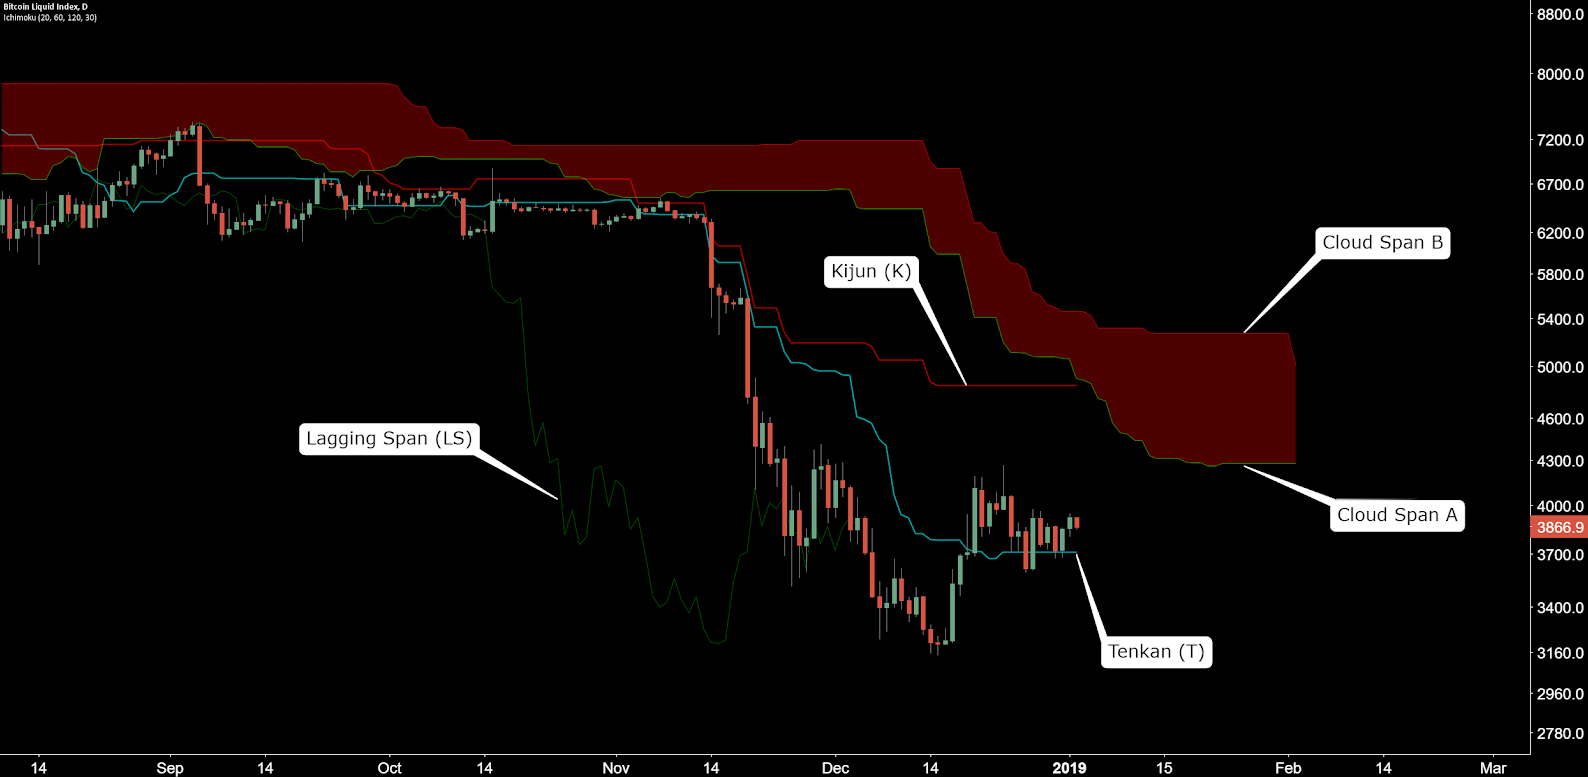
- Tenkan (T) - Conversion Line - (X-period high + X-period low) / 2
- Kijun (K) - Base Line - (Y-period high + Y-period low) / 2
- Senkou Span A - (Kumo/Cloud) - (Tenkan + Kijun) / 2
- Senkou Span B - (Kumo/Cloud) - (2Y-period high + 2Y-period low) / 2
- Cloud Displacement - Z periods ahead of price close
- Chikou Span - Lagging Span (LS) - Z periods behind price close
RELATIVE SETTINGS FOR THE CLOUD IN CRYPTO MARKETS:
Traditional settings for the Cloud are 9/26/52/26 or X/Y/2Y/Z. These settings were established based on a 9AM to 5PM, five day-a-week market with 26 trading days in a month. Because crypto markets are 24/7, I’ve adjusted these settings to 10/20/60/30, which better reflect a market which never closes.
Double the settings to slow the signals down by using more data, decrease signal noise and decrease fakeouts, and increase actionability and probability of signals. Overall, these settings increase the confidence in the trading signals. The final settings are 20/60/120/30.
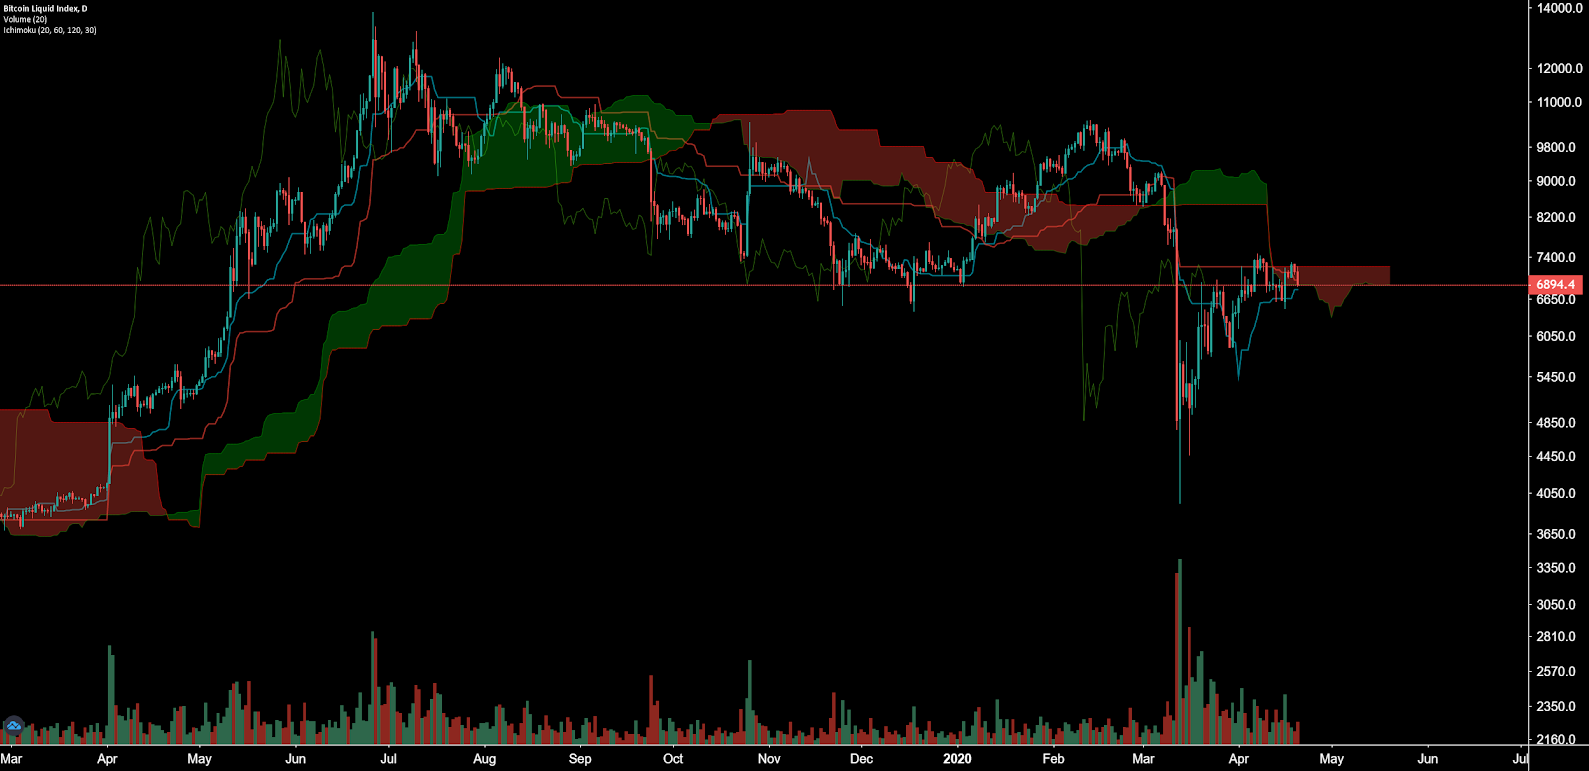
Cloud metrics on the Bitcoin daily time frame with doubled settings (20/60/120/30), for more accurate signals, are currently bearish; the spot price is inside of the Cloud, the Cloud is bearish, the TK cross is bearish but nearly bullish, and the Lagging Span is below the Cloud and above the current spot price.
FEATURES
- *Bearish Trend: *Downward trend in spot price which remains below the cloud.
- Bullish Trend: Upward trend in spot price which will be above the cloud.
- Kumo Breakout: Kumo Breakout can occur when the spot price first breaches the Cloud with no volume or with explosive volume. Trade entries should be adjusted accordingly based on confidence of the signal. An on-volume breakout has a much higher probability of continuation. However, a low volume breakout should not be ignored entirely. Typically, a Kumo breakout has a chart pattern providing additional confluence for the trade.
- Example: Bullish Kumo breakouts are often accompanied by an Adam and Eve or Inverted Head and Shoulders Chart pattern. When these patterns complete, there is typically explosive volume to confirm the reversal.
INSIGHTS BREAKDOWN
- The trend will remain bearish as long as the spot price remains below the Cloud. A long flat Kumo at US$7,200, which also represents a 50% retrace of the current February to March price range, should continue to act as a magnet for price.
- Current daily volume has dropped off significantly since the March 12th crash, and may need several more days of consolidation before a new spike in volume can occur. Cloud signals are trying to zero out at the 50% retracement zone, as this happens; the Cloud thins out, the TK lines go flat, and price usually goes sideways for a few days.
- Kumo breakouts on the daily chart are rare and unusual events which typically lead to strong trend continuation. Since January 2019, there have been two bullish Kumo breakouts and two bearish Kumo breakouts.
- The April 2019 bullish Kumo breakout resulted in a +185% move and the January 2020 bullish Kumo breakout resulted in a +22% move. The September 2019 bearish Kumo breakout resulted in an eventual -32% move and the March bearish Kumo breakout resulted in a -53% move.
- If price does not breach US$7,200 on a daily close, the alternative is new weekly lows and a revisit of local lows. A definitive shift and decision on the current trend should be obvious with the next spike in daily volume. The bullish Kumo breakout may also coincide with the Bitcoin block reward halving, which occurs every four years.
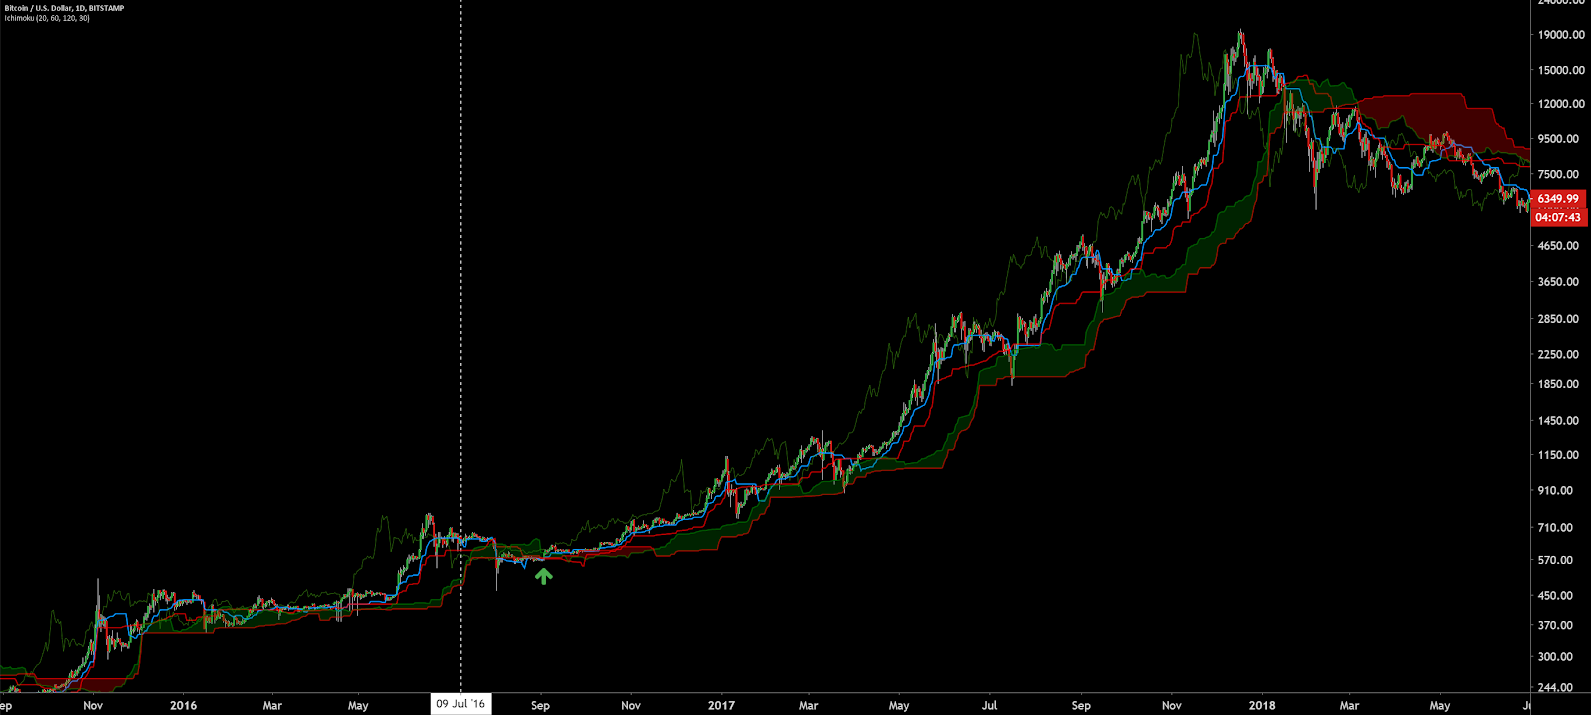
DIVING DEEPER INTO PREVIOUS BITCOIN HALVING:
The previous halving occurred in a tightly ranging price channel, shortly before the Bitfinex hack in August 2016 when 120,000 BTC were stolen. A complete reset of Cloud metrics and a bullish Kumo breakout in September 2016 would eventually lead to a 3,000% price appreciation over the next two years.
OhNoCrypto
via https://www.ohnocrypto.com
Josh Olszewicz, Khareem Sudlow