
Content - Data Quality - Shared order books and correlation
Outside of the more innocent data inaccuracies often found in cryptocurrency market data is the problem of fake volume, where the number of genuine, economic trades can represent a small fraction of what is reported. Brave New Coin collects from hundreds of exchanges, but only uses a subset as constituents for our price indices, and for aggregate asset volumes.
A key area of volume reporting that gets overlooked by most data aggregators is that of shared order books, commonly used by white label exchange solutions. Multiple exchanges can, and do, use a single central order book to improve liquidity for traders, which is not dissimilar to smart order routing in traditional markets. Although the practice could be more transparent, it shouldn't be considered as malicious or deceptive.
In most cases, sharing liquidity between multiple venues allows for better price discovery, and acts to consolidate an industry suffering from fragmented liquidity. The area that requires attention is in how trades filled on these shared order books are reported.
Consider exchanges A, B, and C which are all sharing a central order book. A limit order is added by a user of exchange A (maker) but filled by a user of B (taker); which exchange gets credited with the trade?
In most cases, all three exchanges report the trade and include it in their trading volume, even if the order was added and filled by the same venue. If not addressed, a single trade of 0.5 BTC adds 1.5 BTC to Bitcoins aggregate trading volume.
Misreported volume not only sends false signals to the market, by overstating the interest and liquidity of a particular asset, it also overweights particular markets in volume-weighted price indices.
BNC has devised a method to identify these networks of shared liquidity using ticker correlation and matching ticks, and uses this to prevent double counting.
Identifying correlation in exchange prices
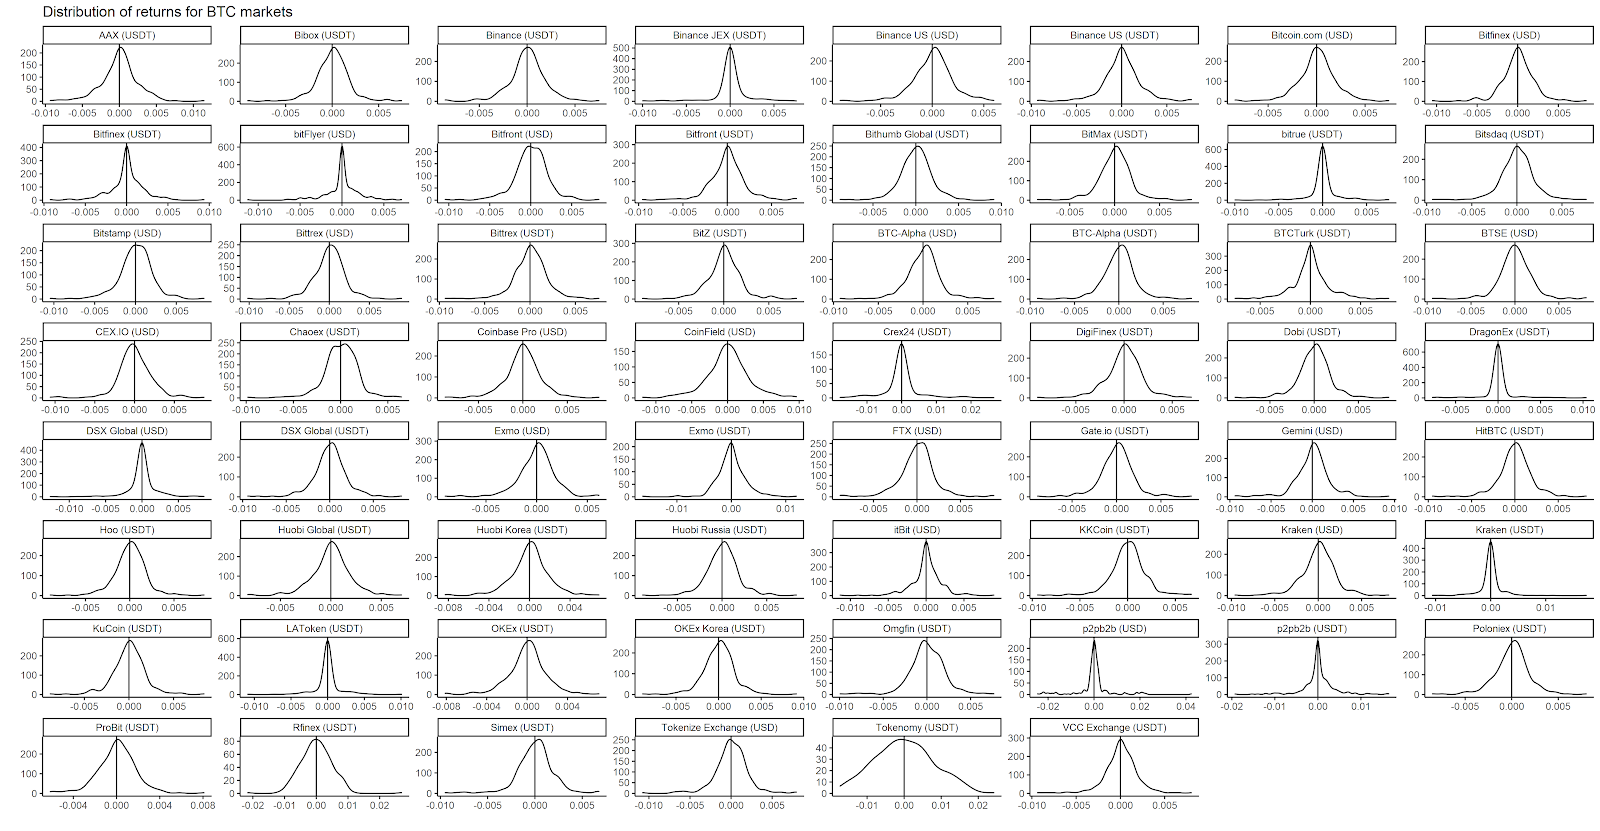
The following example uses ticker data for all exchange pairs in the BTC/USD and BTC/USDT markets, over a 24hr period. A correlation matrix is calculated from the arithmetic returns of each series, using Pearson’s correlation coefficient.
As we are using correlation to identify exchanges by comparison, a density plot of returns will suffice for the normality assumption.
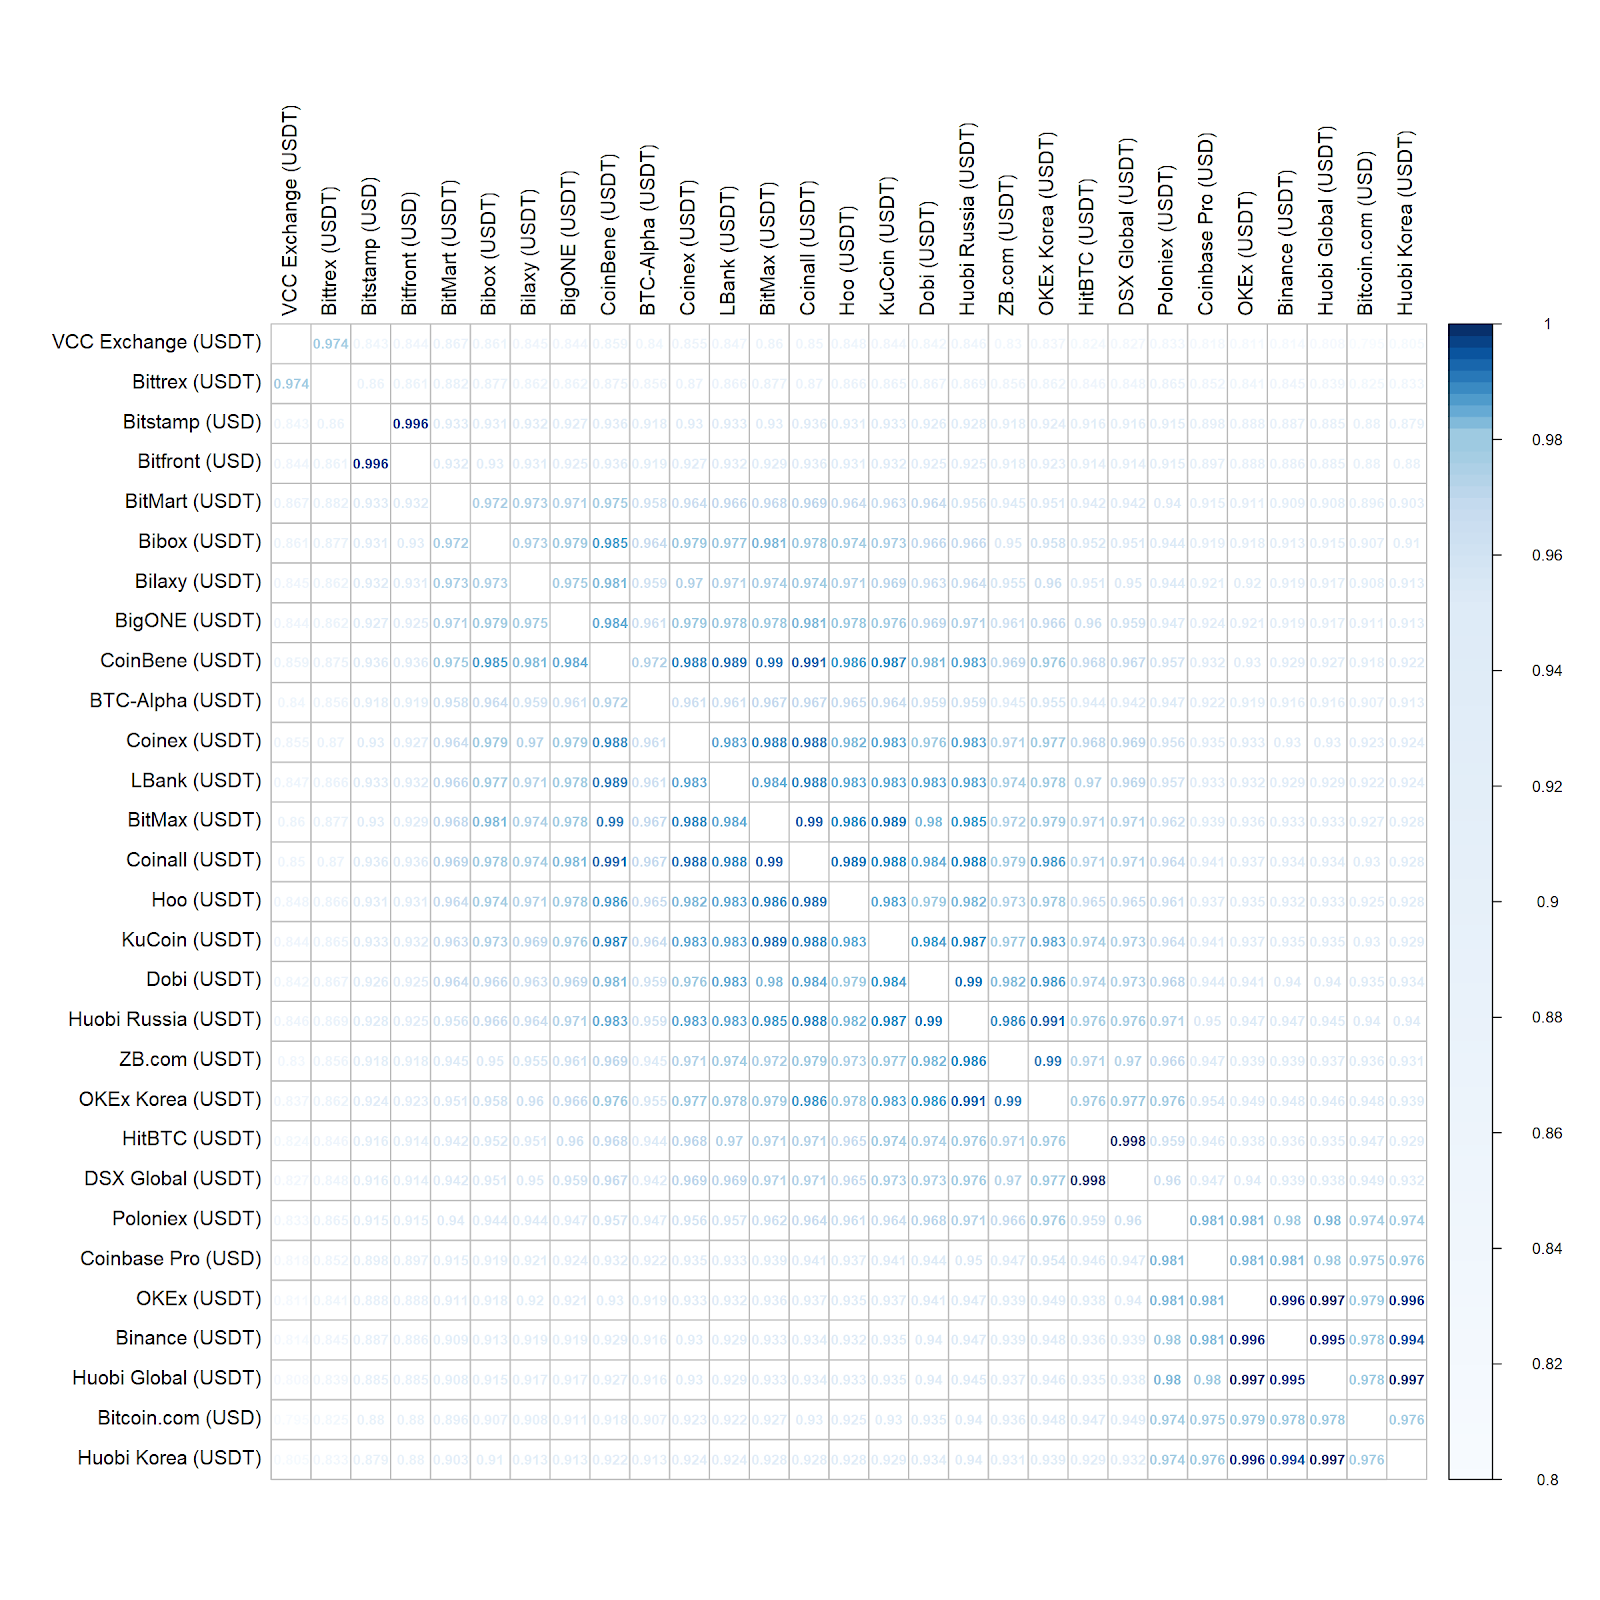
The significant pairs can then be plotted on a heatmap to identify highly correlated exchange pairs (dark blue) as well as clusters of high correlation. Only pairs from exchanges with very high correlation, above 0.8, were included to improve legibility.
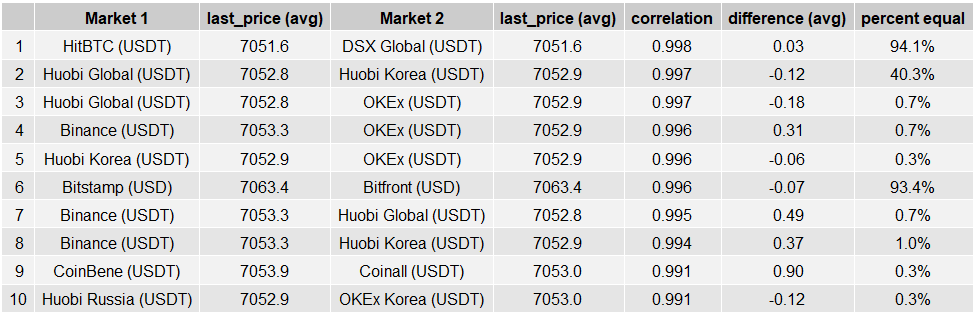
The correlation coefficient only tells half the story; whether these exchanges are moving in unison. The second half is how similar the observations are, including volume and price.
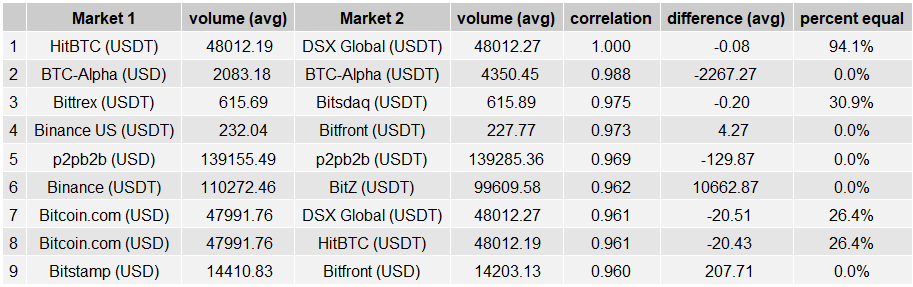
The following table summarizes the most correlated pairs of markets, showing the average dollar difference and the percentage of ticks which were equal.
Observations:
- The HitBTC / DSX Global (USDT) and Bitstamp / Bitfront (USD) pairs have very high correlations, 0.998 and 0.996 respectively, but also have a very high proportion of ticks with identical price points.
- There is a highly correlated cluster in the bottom right, including Binance, OKEx and Huobi.
- There is a large cluster in the middle, which includes typically untrusted exchanges.
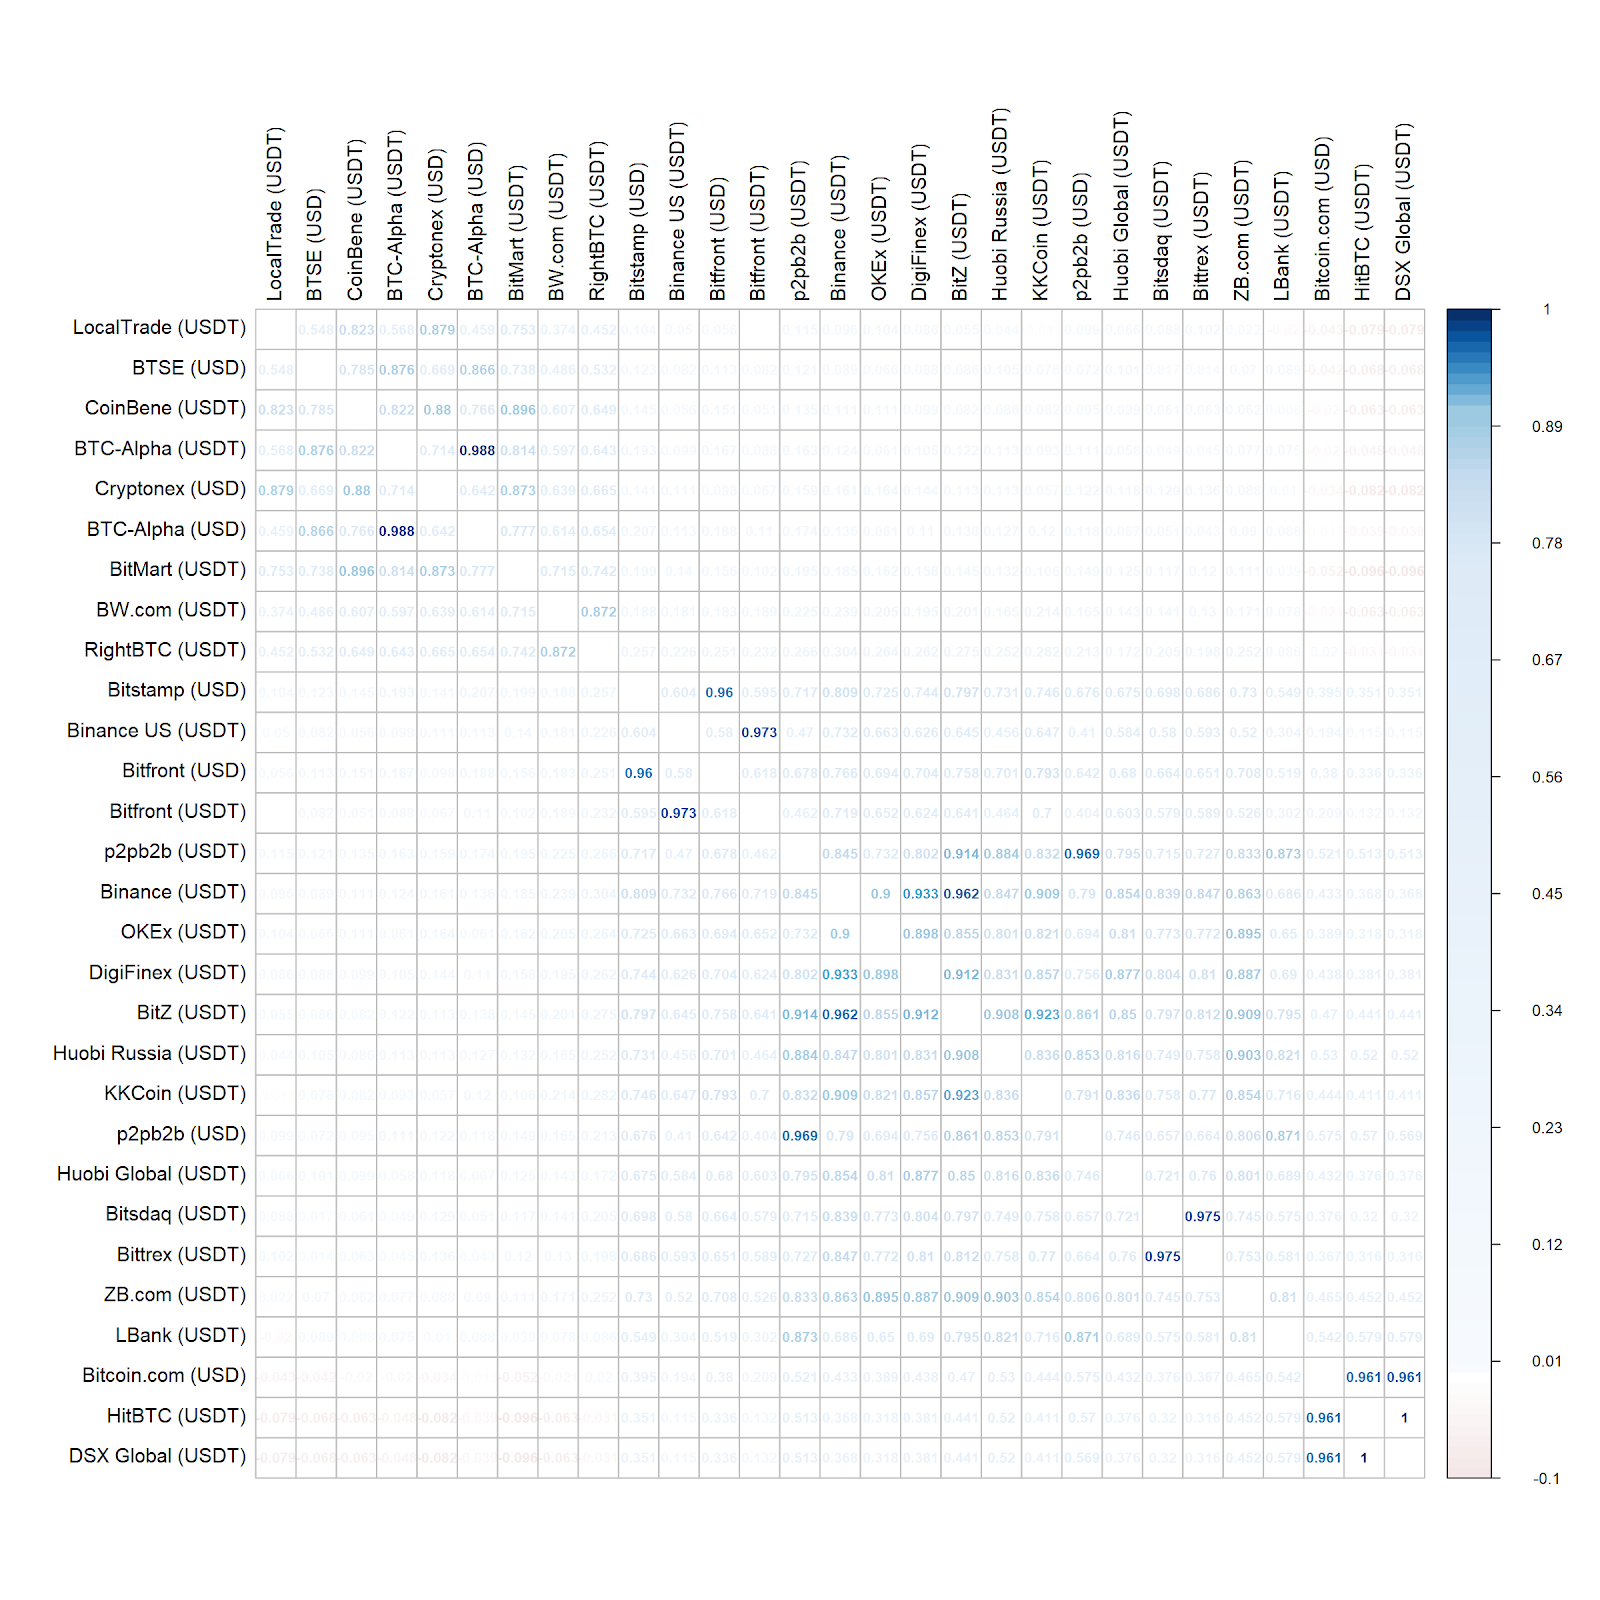
Identifying correlation in exchange volume
Arbitrage, market making and the general maturing of crypto markets means highly correlated pricing is expected. The correlation of volume, especially in a sideways market, will be more telling.
Observations:
- The HitBTC / DSX Global (USDT) and Bitstamp / Bitfront (USD) pairs again show significant correlation, whilst adding an exchange to their respective clusters; Bitcoin.com (USD) and Binance (US).
- Despite having a 0.988 correlation, BTC-Alpha’s USDT market volume was consistently twice the size of its USD market.
- Despite having high liquidity, strong price discovery and significant arbitrage activity, exchanges such as Coinbase Pro, Bitfinex and Kraken didn't make it past the correlation filter.
Exploring the correlated clusters
By far the highest correlation in both last price and 24hr volume was between HitBTC, DSX Global and Bitcoin.com. Close to 100% of the HitBTC and DSX tickers were identical, and just under 70% when each were compared to Bitcoin.com. The reason for this interaction is that all three exchanges use the services of “liquidity provider” multiexchange.
Their trade history API is virtually indistinguishable.
Effectively, this claimed 24hr volume represents the aggregate total volume across these three, and any other exchanges that use multiexchange. The relatively new exchange Bitcoin.com is reporting this shared orderbook as a USD market. The top two “qualified” exchanges in this market, Coinbase and Bitfinex, currently have a combined 24hr volume of around 33,000BTC. Bitcoin.com is reporting 35,000.
Much like Bitcoin.com, Bitfront has quickly risen to the top of the BTC/USD volume ranks since it was launched by Japanese messaging Giant LINE, less than 2 months ago. Judging by its high correlation and 93% rate of equal ticks, most of that success appears to have come from the help of Bitstamp. There is no public information about this particular arrangement but their orderbook, trade, and ticker data are largely identical.
We also observe a relationship found between Bitfront’s BTC/USDT market and Binance US, although at a much smaller volume scale.
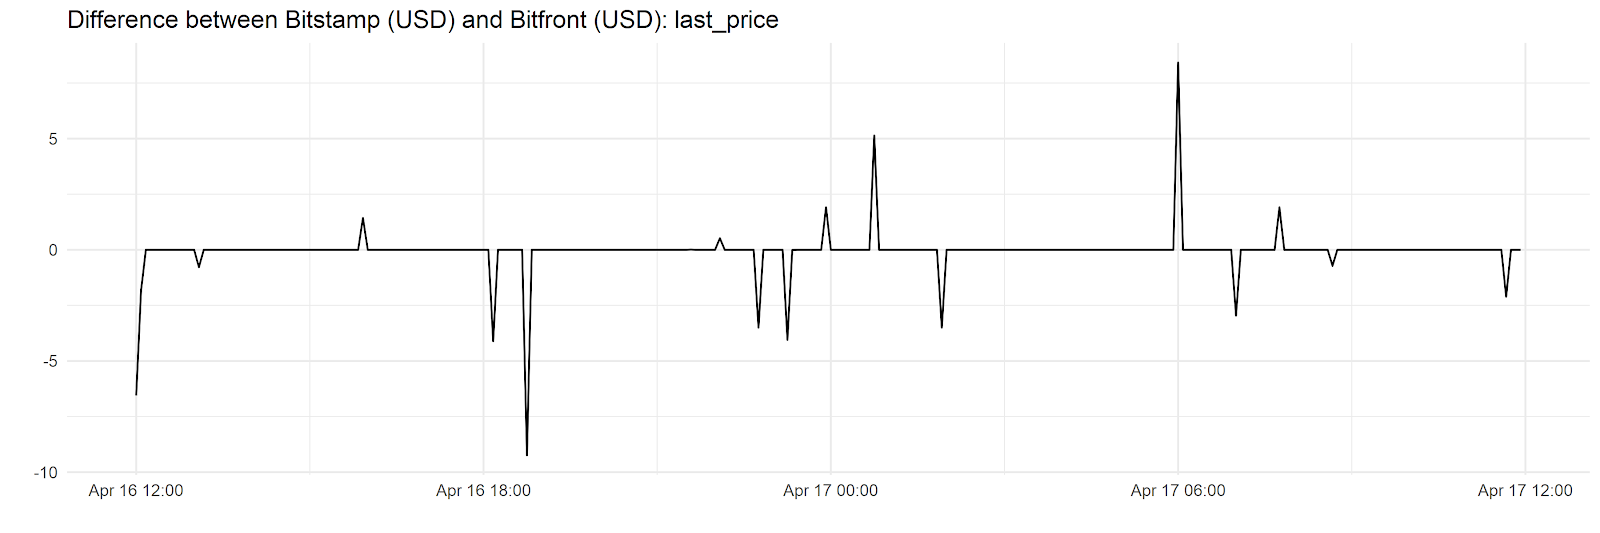
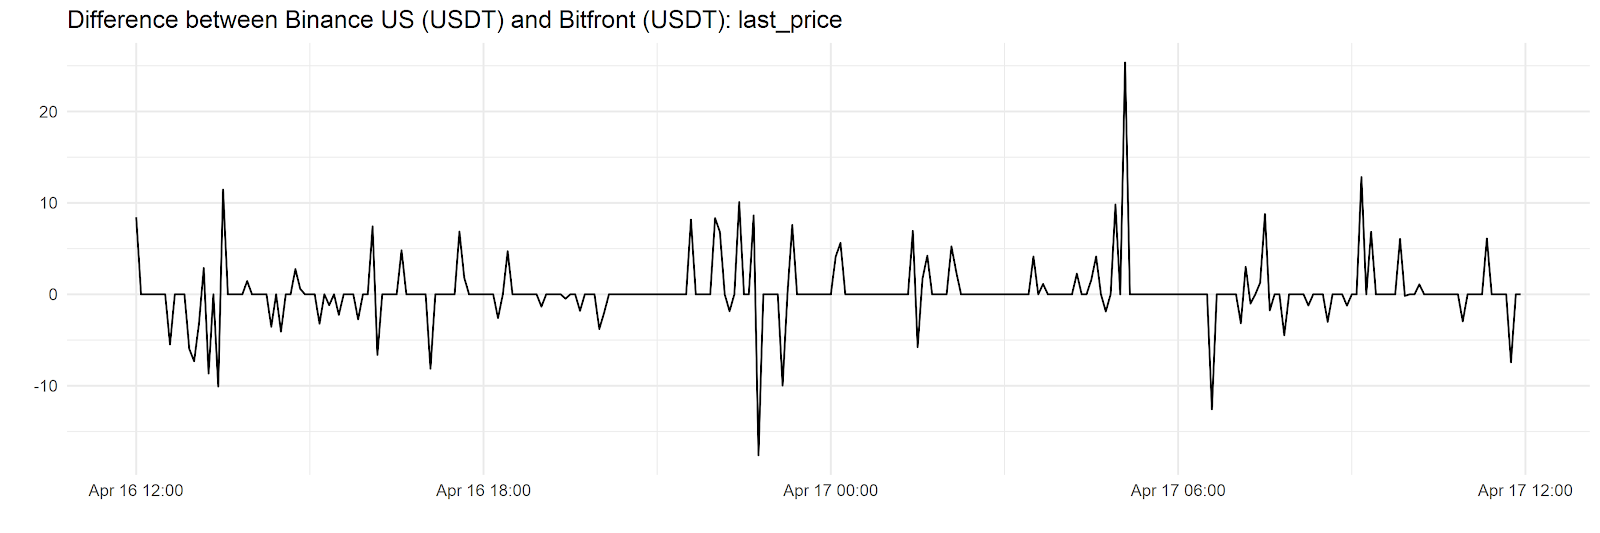
The difference between Bitstamp, or Binance US, and Bitfront’s price shows that any disparity is short-lived. This cluster does not seem to represent a mutual liquidity sharing relationship as in the previous example. More likely, Bitfront are using a white label exchange solution to “pull liquidity” into their own venue.
A popular white label solution, Skalex, describes the process, conveniently using Bitstamp as an example. “The nostro account created on your exchange will read the orderbook of Bitstamp and publish orders from Bitstamp orderbook to the orderbook of your local exchange.” The company also provides advice on how their clients can recover Bitstamps fee, by passing it on to their users.
- Bittrex and Bitsdaq, a user of Bittrex’s white label solution, also have highly correlated volume with 30% of the reported ticks matching.
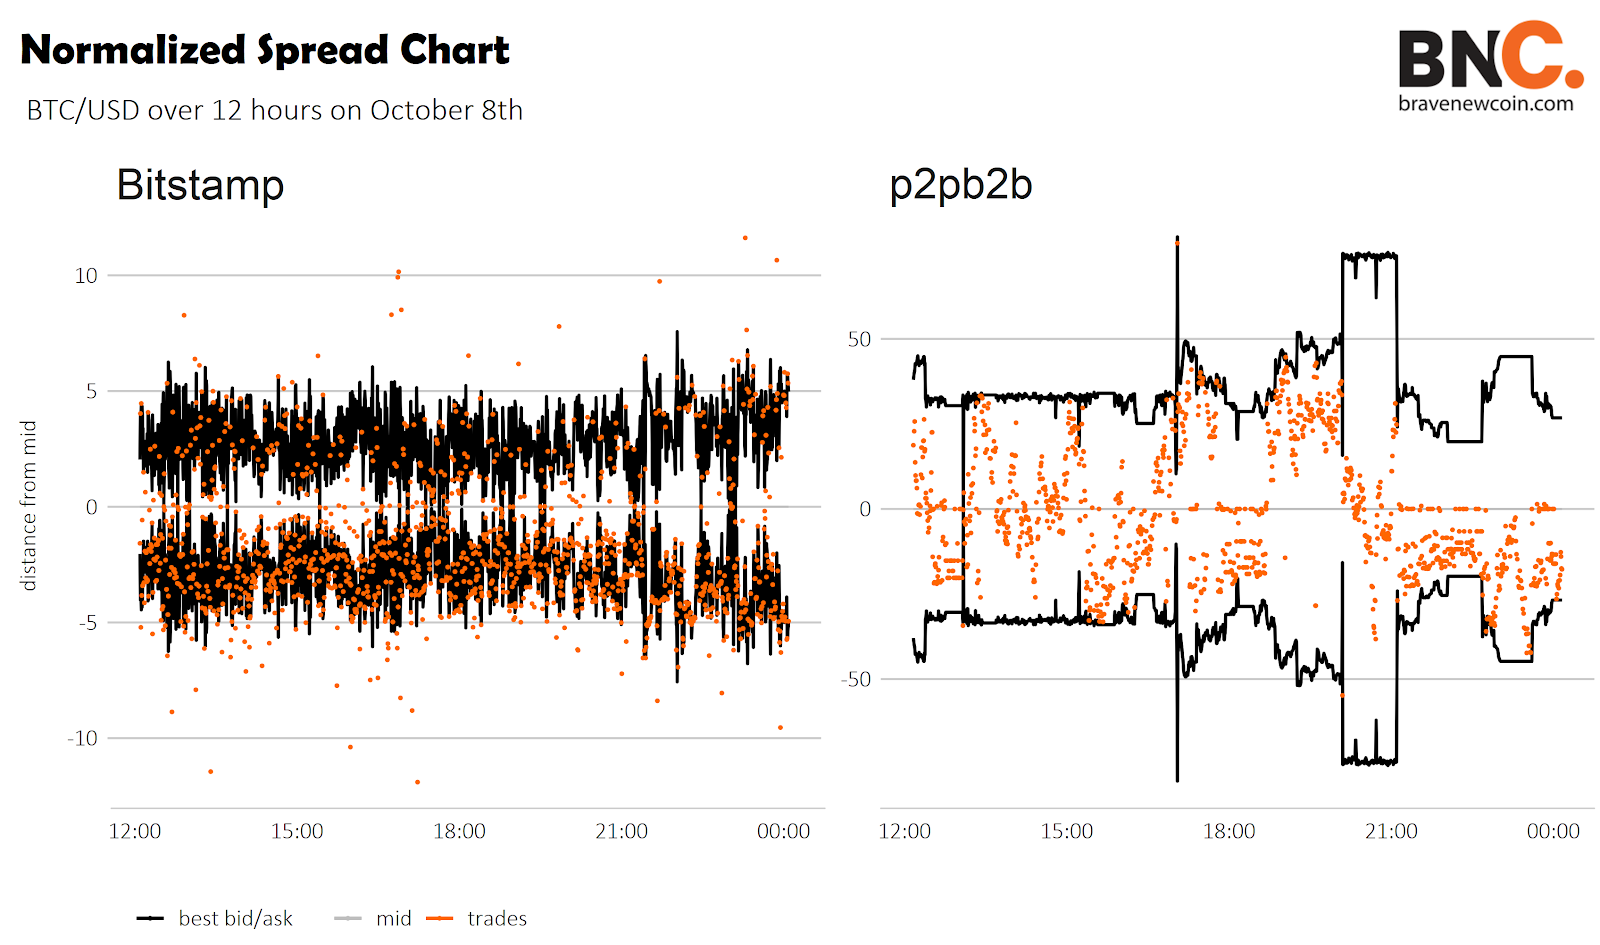
- The BTC/USD and BTC/USDT markets of p2pb2b exchange were also highly correlated. Their reported volume is three times larger than that of Coinbase Pro, Bitfinex, Bitstamp and Kraken combined.
Shared orderbooks present a problem that is not being addressed by crypto data providers. With Binance recently announcing its own white label exchange infrastructure, Binance Cloud, we could see this problem of double counted trades adding more and more misleading volume to the industry.
This analysis was performed using Brave New Coin’s XchangeFeed service, which provides access to standardized, exchange-level data via a single REST api or websocket. XchangeFeed accesses data from more than 240 exchanges, covering more than 5,000 market pairs.
- Some exchanges report an expanding sum, which resets once a day, instead of a rolling sum as their 24hr volume.
OhNoCrypto
via https://www.ohnocrypto.com
Ryan Greaves, Khareem Sudlow