
Brave New Coin Weekly Bitcoin halving countdown update: 28th February
What is the Halving?
Bitcoin is a decentralized digital currency that enables instant payments to anyone, with no central authority. The Bitcoin network is secured by miners which are specialized computers that use a consensus mechanism called “proof of work” to verify each block of bitcoin transactions.
The miner that verifies each block is rewarded for their work with newly-created bitcoins. This ‘block reward’ is how new bitcoins are released into the system. A new block of transactions is added to the Bitcoin blockchain approximately every 10 minutes. The current reward is 12.5 bitcoins per block.
An average of 144 blocks are mined every day which means approximately 1,800 new bitcoins are generated every 24 hours.
The number of new bitcoins that are created via the block reward is reduced by half every four years. This is known as the Bitcoin Halving. The next halving will be the third halving, and the current block reward of 12.5 bitcoins will reduce to 6.25 bitcoins.
This week in the halving countdown
_The Bitcoin network’s hashrate has increased - bringing forward halving predictions. The financial markets saw heavy losses due to Coronavirus fears and capital flight. _
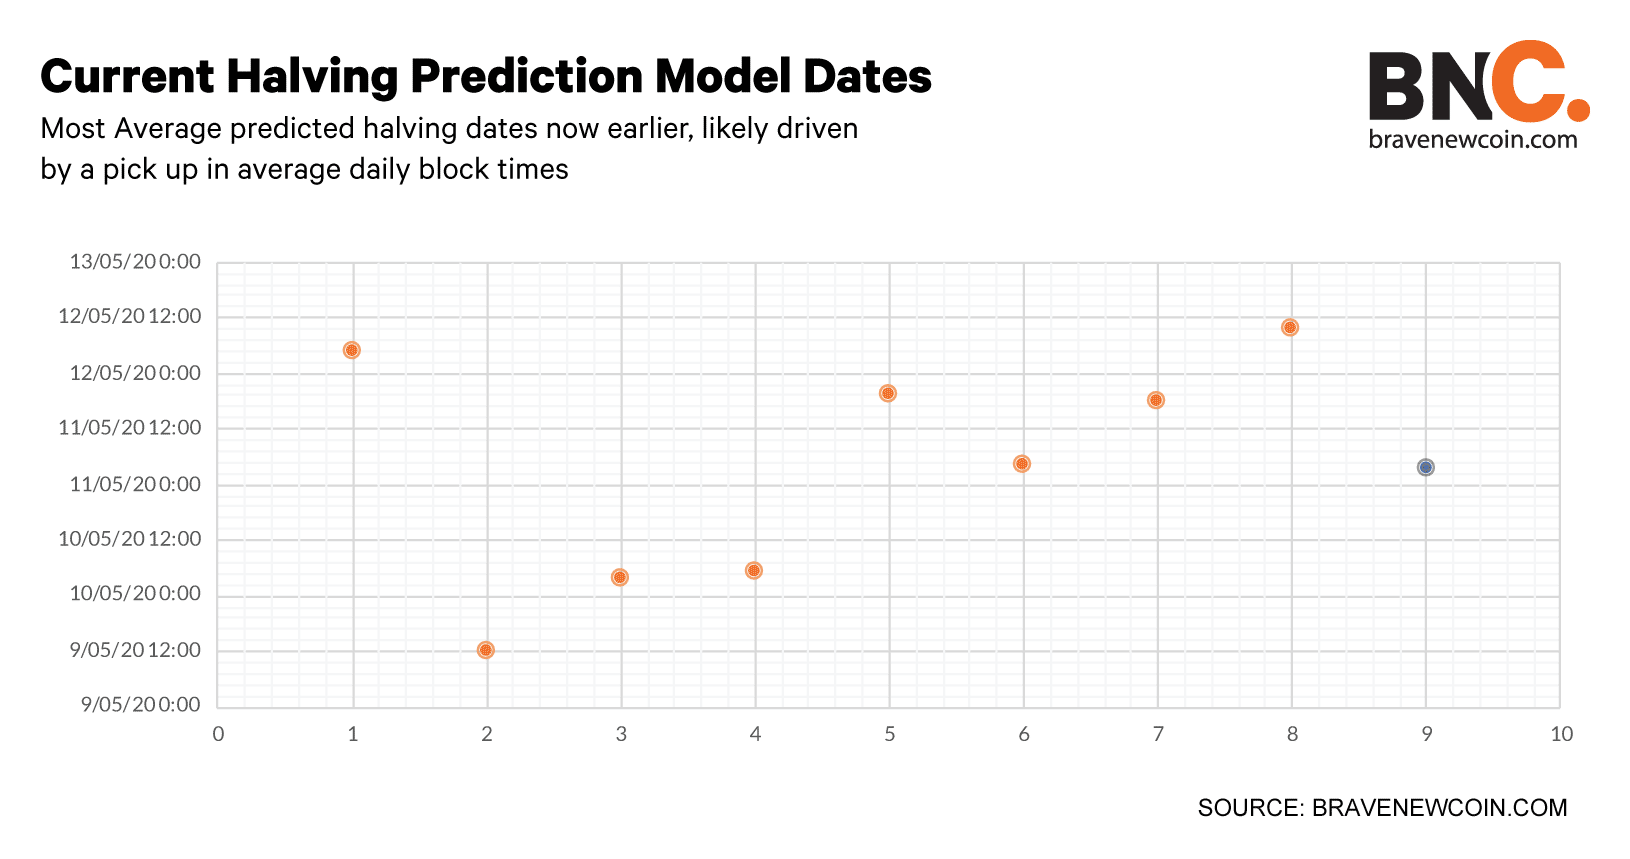
This week’s consolidated (across all Brave New Coin prediction models) Bitcoin block reward having prediction date is *11/05/2020 03:37. *
The consolidated prediction date from a week earlier was 12/05/2020 11:39, 8 hours and one minutes later. Each model is recalculated every day. The consolidated block halving prediction date has been brought forward. The most likely reason for this is due to a pick up in the Bitcoin network’s hashrate. This means blocks are being processed at a slightly faster rate which has pulled the predicted dates of BNC’s prediction models forward. Bitcoins hashrate rose ~3% last week and maintains a positive long term macro growth trend.
It was a unique week for the Bitcoin ecosystem and the financial markets in general. The outbreak of the coronavirus has had far reaching economic consequences across the global financial markets. The price of assets on the Dow Jones, NASDAQ, S&P and other major global indexes have fallen heavily over the last week as uncertainty around the virus has intensified. The capital flight to liquidity/cash has also affected the crypto markets and the price of Bitcoin has dropped 8% in the last 7 days.
Bitcoin’s rising hashrate against the backdrop of Coronavirus fears is an endorsement of the network’s strong fundamentals. While most manufacturing and industrial investments have been heavily impacted by the global supply chain slowdown, the Bitcoin network continues to produce more energy. This pick up in mining activity has pushed the BNC halving countdown clock forward, given the now faster daily average block times.
Halving prediction dates:
- Average predicted block halving date 16/02/2020 across the 8 different models= 11/05/2020 03:37
- Average predicted block halving date the week before across the 8 different models = 12/05/2020 11:39
- Difference= 8 hours and 1 minute earlier
This is the average execution time of all Bitcoin blocks mined the day before. This model estimates the number of days left until the next halving, by multiplying the average daily block time by the number of blocks left to be mined before the next halving. Using this measure we calculate the timestamp for next halving.
Date Convergence charts:
Scenario 1: Average Daily Block Time
This is the average execution time of all Bitcoin blocks mined the day before. This model estimates the number of days left until the next halving, by multiplying the average daily block time by the number of blocks left to be mined before the next halving. Using this measure we calculate the timestamp for next halving.
Dates put out by this model now ranging closely around the average of past prediction dates

Average predicted halving date (first observation 01/01/2019)= 12/05/2020 17:04
Predicted halving date on 23/02/2020= 12/05/2020 04:31
Scenario 2: Cumulative Average Block Time
This is the cumulative numerical average of execution time of all Bitcoin blocks mined till the present day. In order to remove the long gap between the initial block execution, the average block time between those blocks is taken as 600 seconds. We estimate the number of days left until the next halving, by multiplying the cumulative average block time with the number of blocks left to be mined before the next halving. By using this measure we calculate the timestamp for next halving.

*Average predicted halving date (first observation 01/01/2019) = *08/05/2020 06:11
*Predicted halving date on 16/02/2020 = *09/05/2020 07:26
Scenario 3: Simple Moving Average Block Time 50 day
This is an arithmetic moving average of all block times calculated by adding the average block time of blocks executed each day for the last 50 days of the period. This is a lagging technical indicator which applies an equal weight to all observations over the period for determining if the block time will continue to have the same trend or reverse it. If the simple moving average points up, this will explain the increase in the number of blocks execution which means the halving date will arrive faster than expected. If it is pointing down it means that the blocks executed will decrease on a daily basis and the halving date can move further away.
- Driven by the rising hashrates the predicted dates now sits 3 days below its historic average. The outputted prediction date for the model is also much lower than last week.
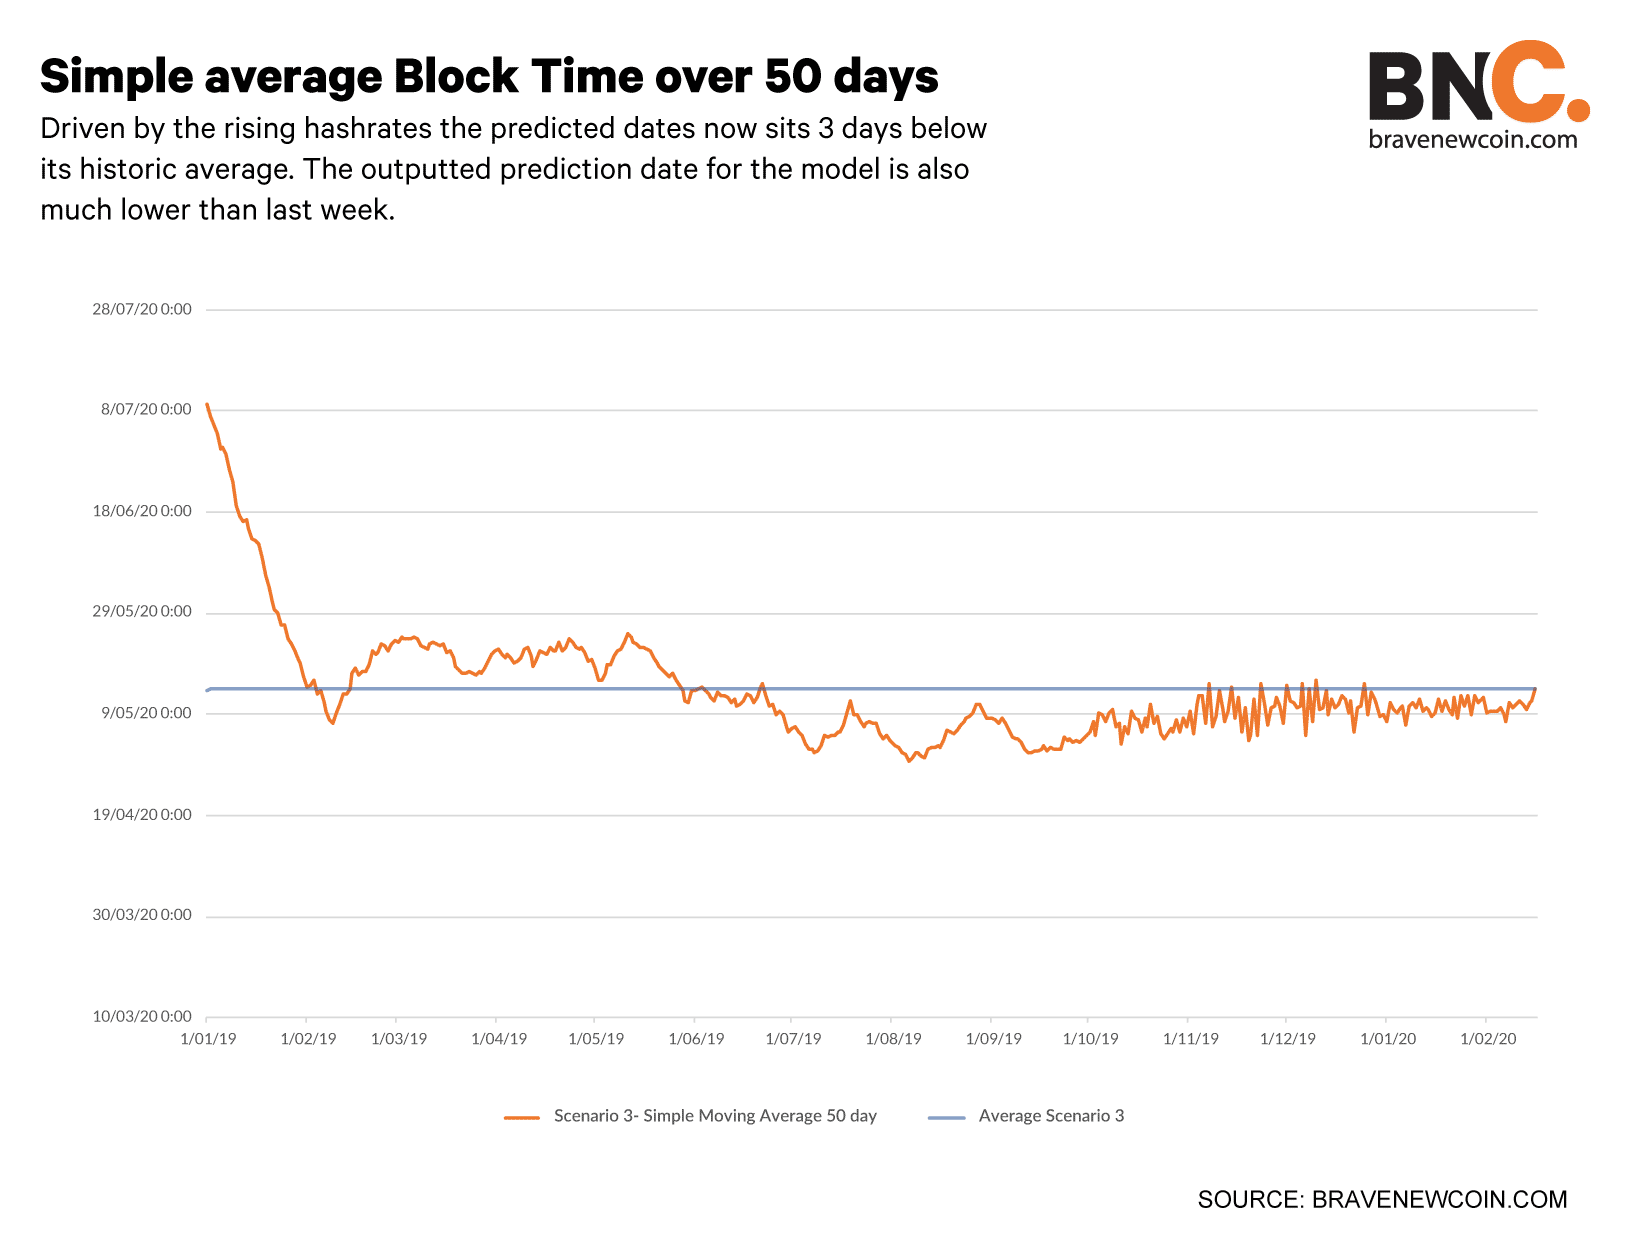
*Average predicted halving date (first observation 01/01/2019) = *13/05/2020 22:07
*Predicted halving date on 23/02/2020 = *10/05/2020 05:14
This is a type of moving average where a greater significance is given to the most recent average block times. This provides good signals on crossovers and divergences from the historical average block time. This is a lagging technical indicator. When the average block time crosses the moving average block time, the large changes are expected in the average block time, where the trend changes direction. As EMA provides higher weight to the recent daily average block time than on older data, it is more reactive to the latest block time changes.
This halving date predictor model appears to be moving towards its historical average and rose last week
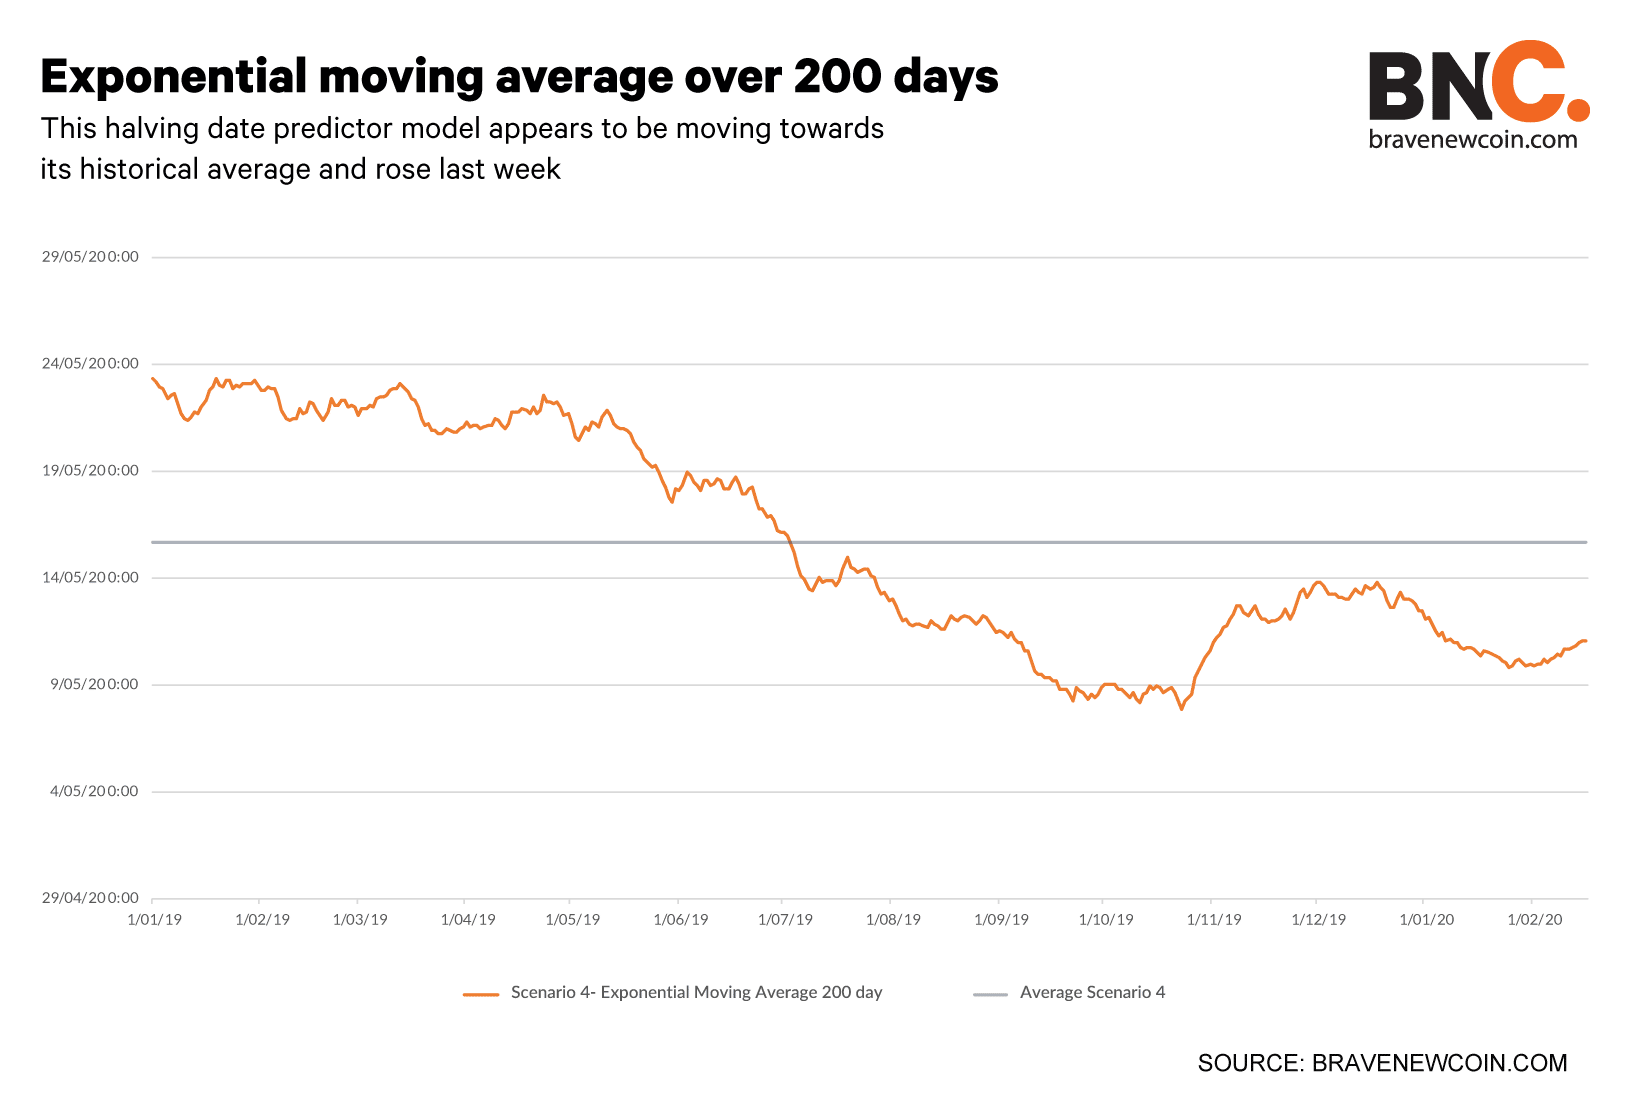
*Average predicted halving date (first observation 01/01/2019) = *15/05/2020 14:22
*Predicted halving date on 16/02/2020 = *11/05/2020 04:03
Network fundamentals
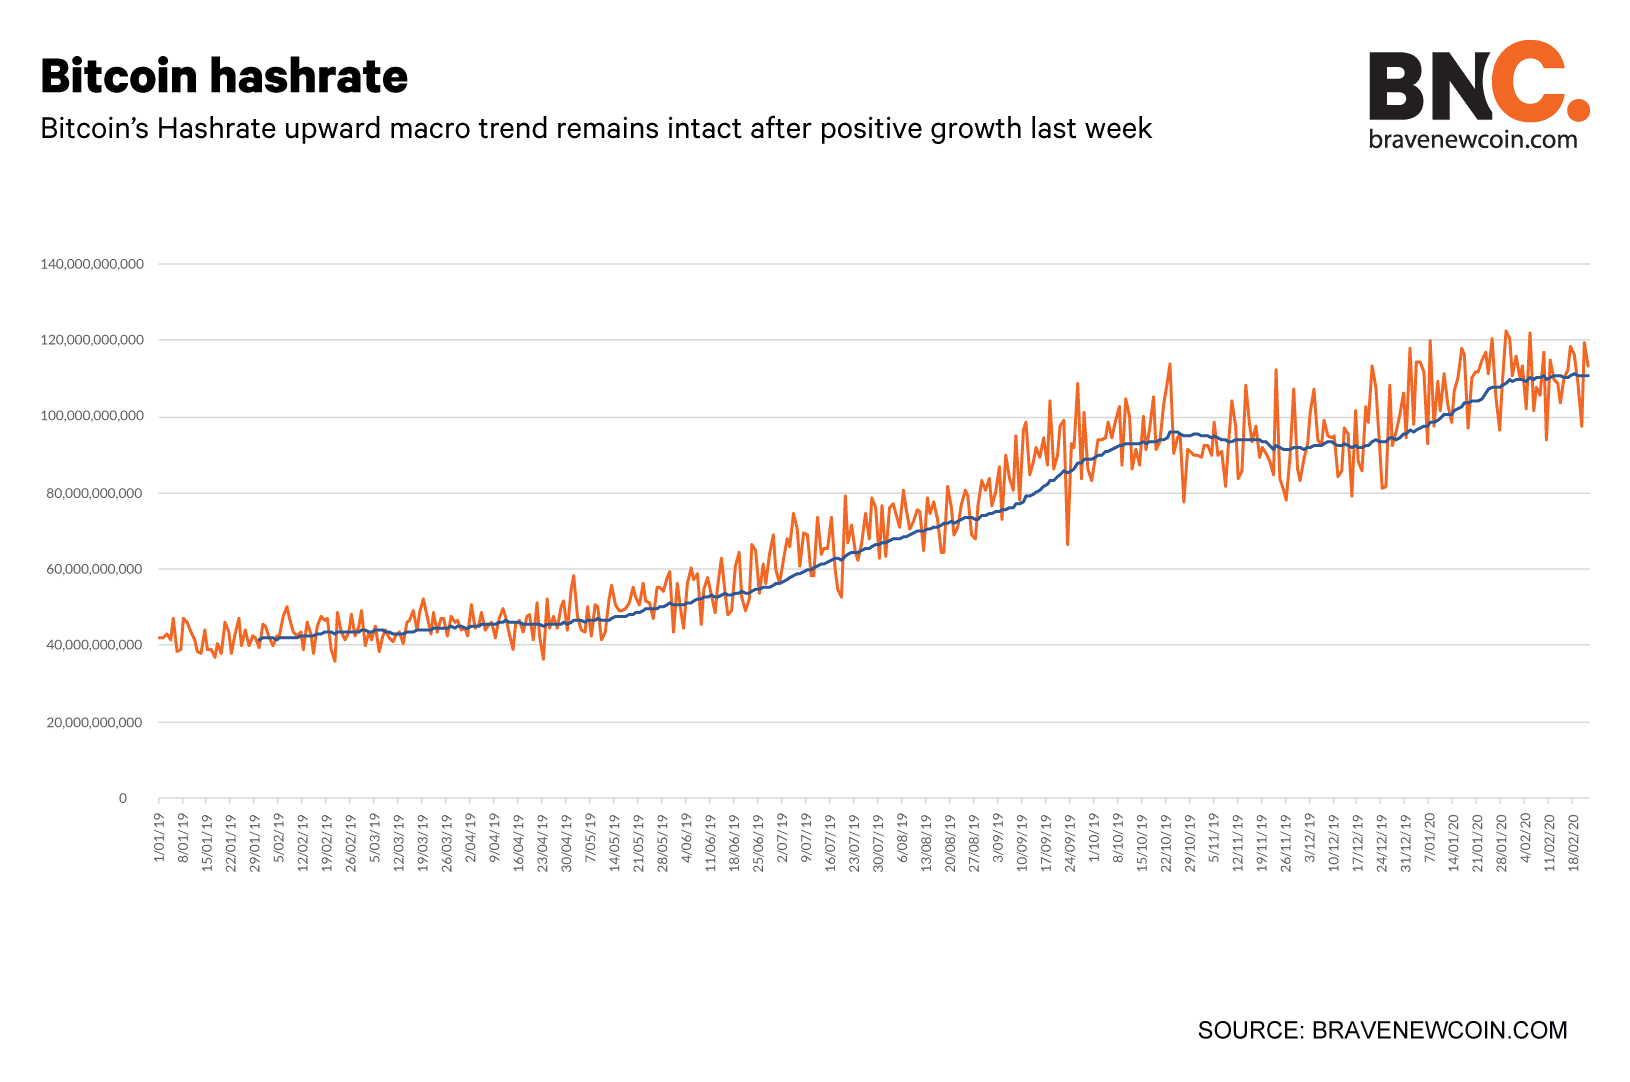
- Average Daily Hashrate from 16/02/2020-23/02/2020= 112,178,662,505
- Average Daily Hashrate the week before= 108,821,302,672 Th/s
- Percentage change= -3.09%

- Bitcoin left to be mined before the halving as of 23/02/2020= 141037.5 btc
OhNoCrypto
via https://www.ohnocrypto.com
Aditya Das, Khareem Sudlow