
2019 Q4 Cryptocurrency Review
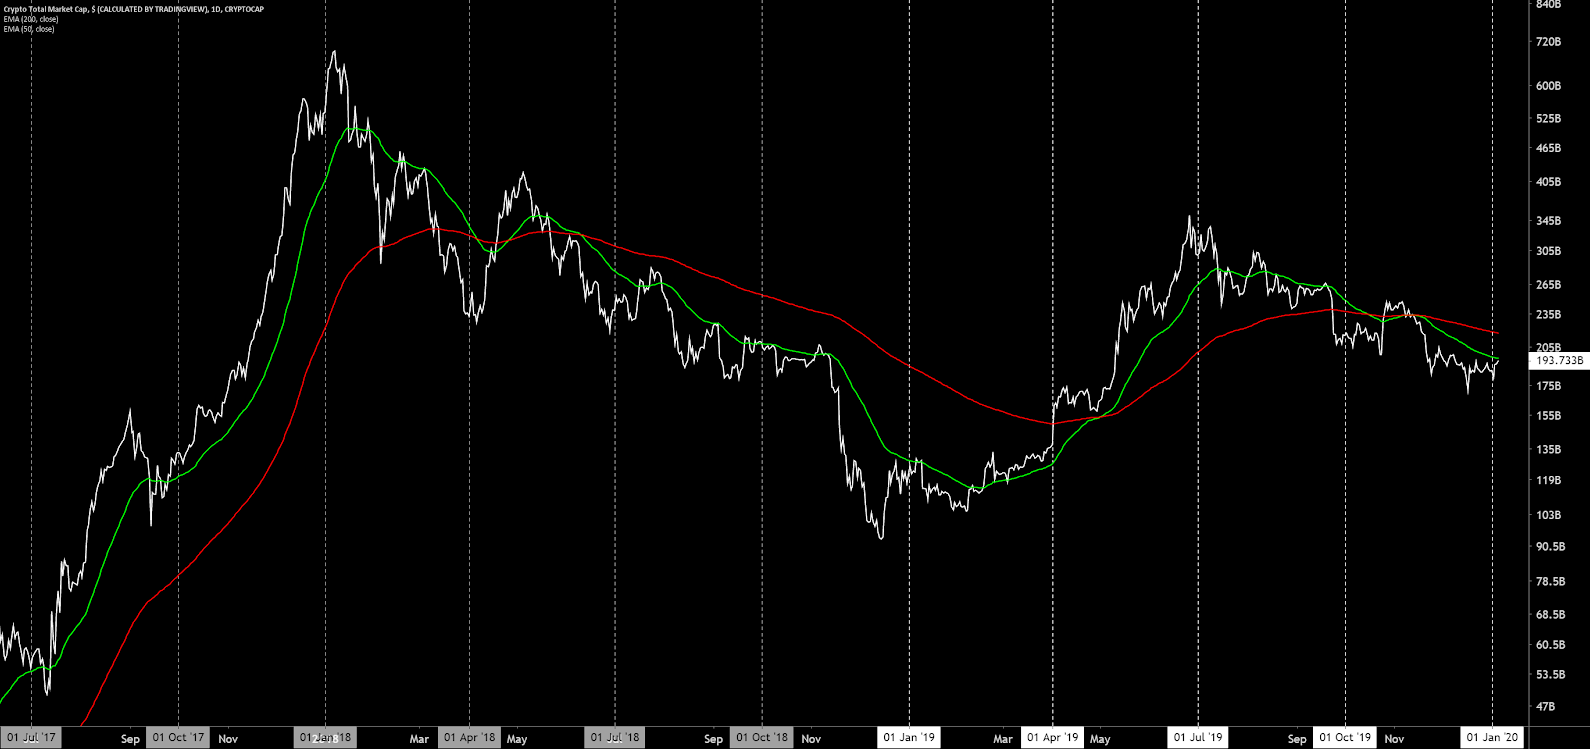
The total market capitalization for cryptocurrencies was up 44% in 2019, after increasing 138% in the first half of the year and decreasing 38% in the second half. This year begins with a bearish 50-day and 200-day moving average cross on the daily market cap chart, which is consistent with bear market conditions. The previous bear market lasted 324 days, from June 2018 to April 2019.
Bitcoin is the world’s largest cryptocurrency by market cap and commands a large portion of the trading volume in the cryptocurrency markets. Among high market cap assets, ChainLink (LINK), Tezos (XTZ), and Binance Coin (BNB) were the best performers when compared to BTC throughout last year.
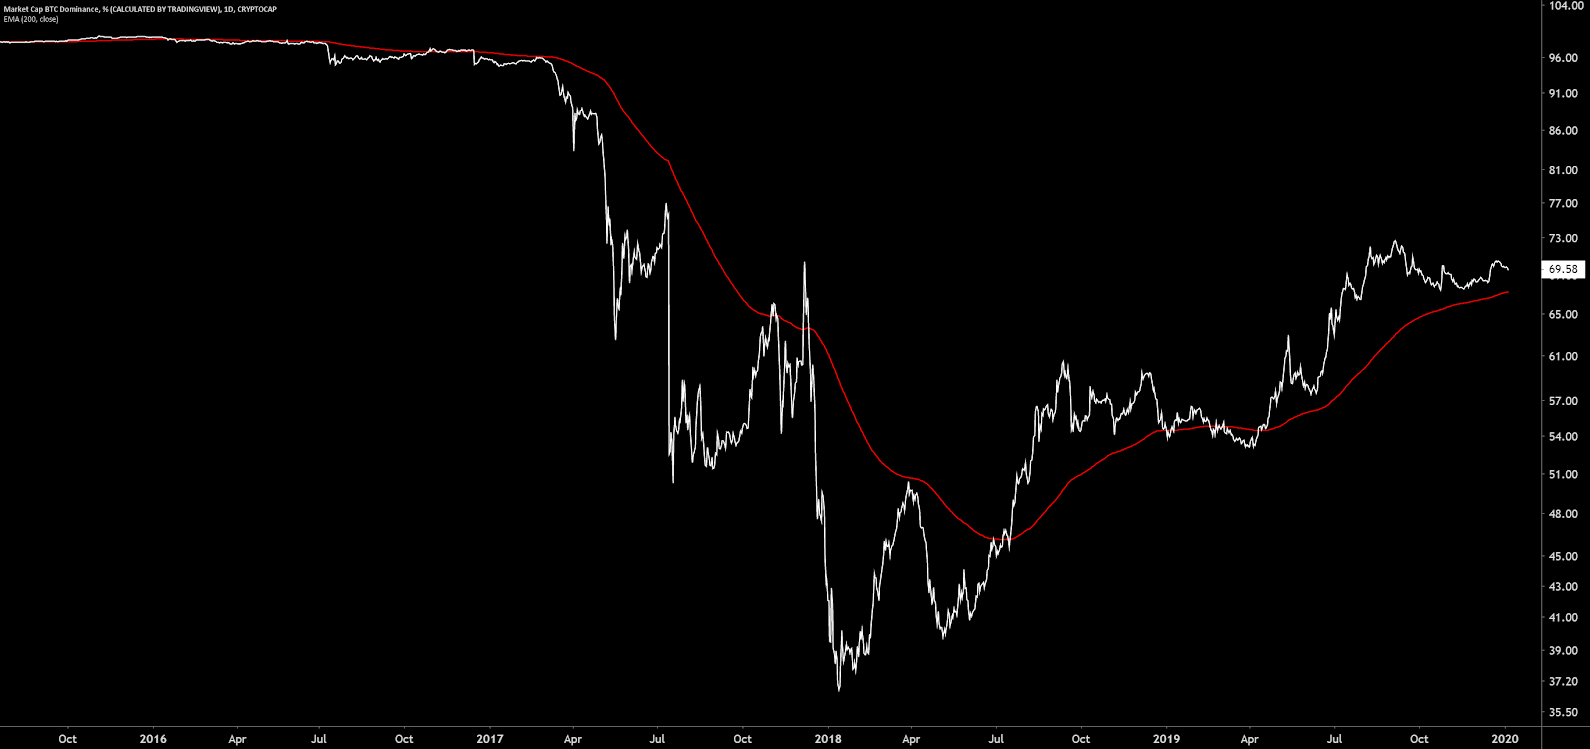
The ratio of the market cap of Bitcoin and the rest of the cryptocurrency markets is simply referred to as Bitcoin dominance. The daily chart tracking bitcoin dominance has largely remained above the 200-day moving average since July 2018. The wider market is unlikely to broadly outperform BTC until the asset drops below this key moving average.
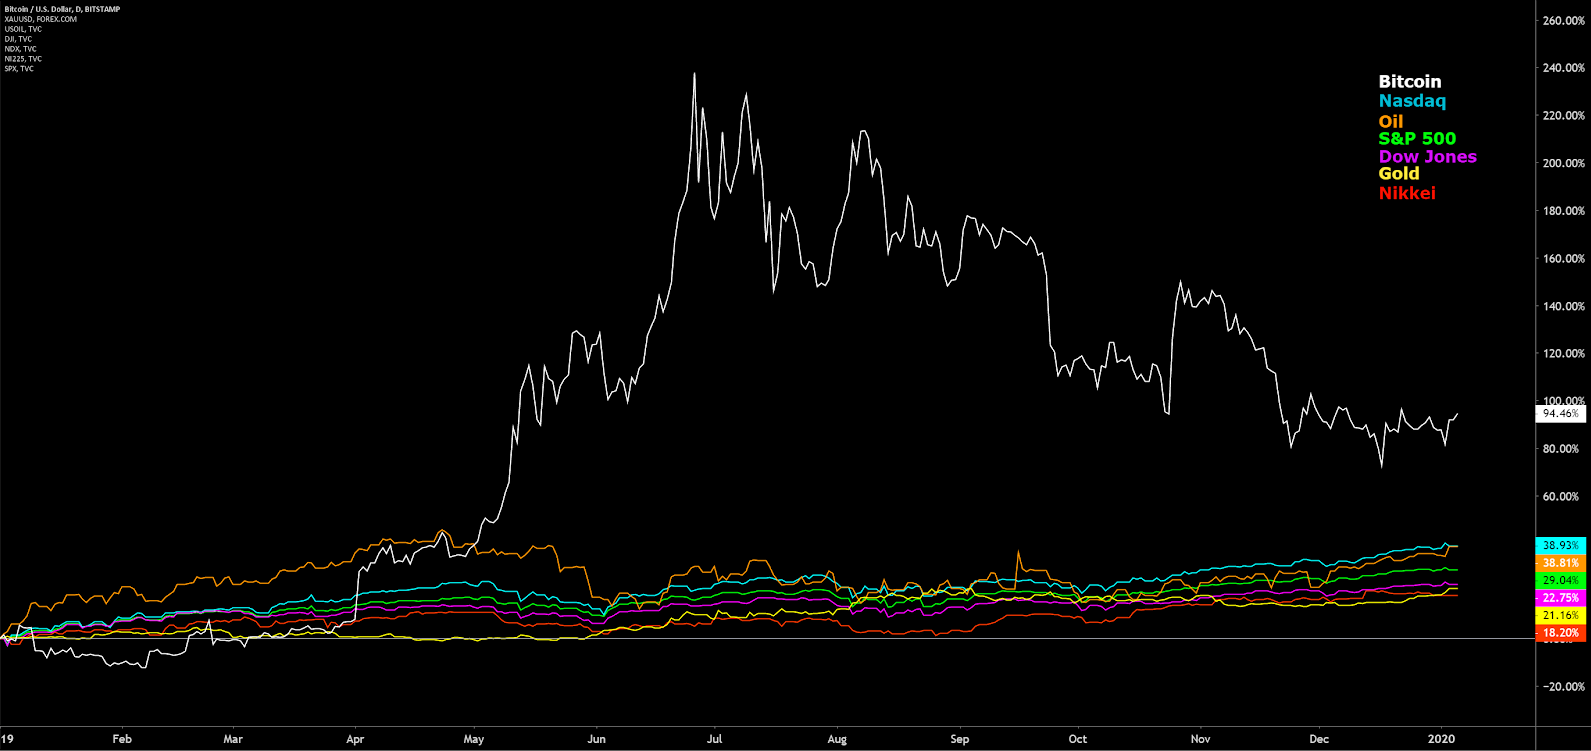
Compared to legacy markets, Bitcoin markets experienced extreme volatility throughout most of the year. Since January 2019, Bitcoin was essentially uncorrelated to other global indices and made strong gains against Gold and Oil. Despite legacy markets pushing all-time highs, Bitcoin had the strongest percent gain over the course of the year.
## New Year, New Quarter
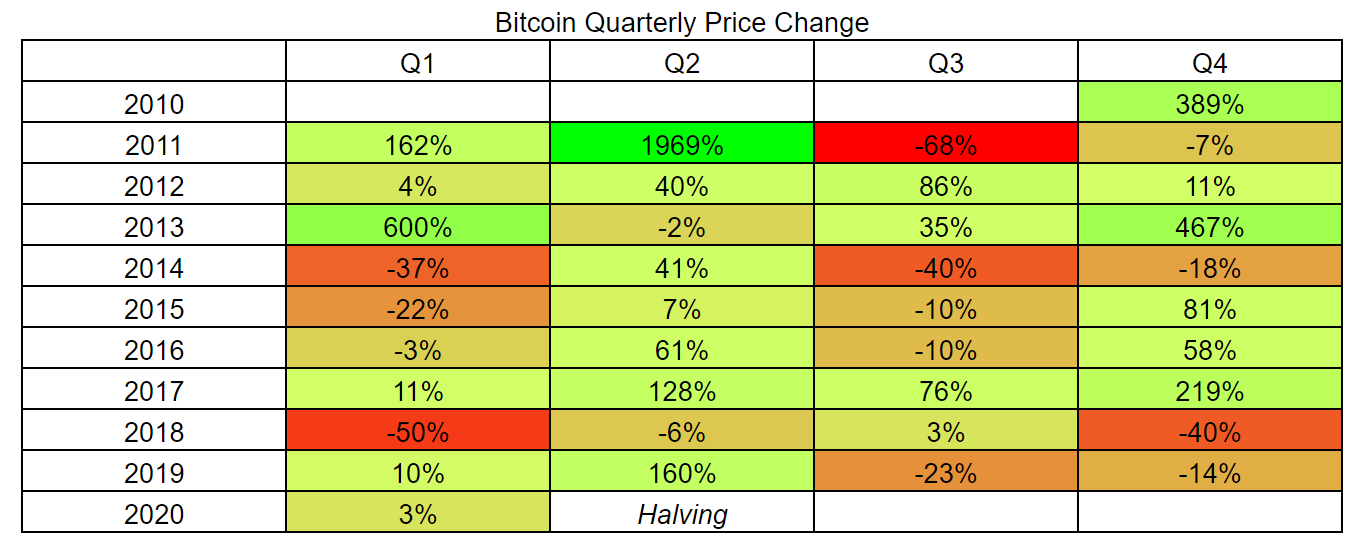
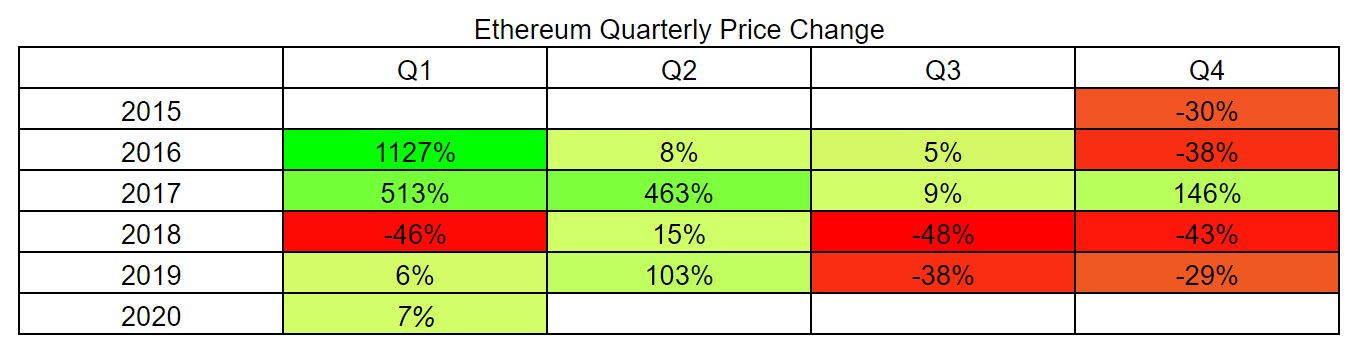
Historically, relative changes in Bitcoin markets have been closely related to three-month cycles. These quarterly cycles often see a dramatic expansion or contraction in price, with very few quarters ending with less than a 10% price change. Q2 and Q4 of any given year have historically been the most positive periods, while Q1 and Q3 have been the most negative periods. Q2 is typically the best performing quarter for all cryptocurrencies.
In total, there have been 21 positive quarters and 15 negative quarters. Bitcoin’s massive Q2 2019, at +160%, was the seventh-best quarterly gain. The highest positive period was Q2 2011 at +1941%, and the highest negative period was Q3 of the same year at -68%. Q3 2019 marked the fifth negative Q3, which now has the most negative periods of any other quarter. Q4 2019 closed at -14%, which was the fourth negative Q4 in Bitcoin’s history.
The average gain among all positive periods, excluding the extreme outlier in Q2 2011, is 126%, while the average loss among all negative periods is -23%. The longest period of consecutive gains occurred between Q4 2016 and Q1 2018, totaling 484%. The longest period of consecutive losses occurred between Q3 2014 and Q2 2015, totaling 80%.
Ethereum (ETH) has had 17 total trading quarters, far fewer than Bitcoin, but most of ETH’s price changes within each quarter have been very similar. Negative quarters have historically had a tight range of -30% to -48% whereas positive quarters fit into three ranges: <+15%, around +100%, or >+500%. The average gain among all positive quarters, excluding the extreme outlier in Q1 2016, is +141%, and the average loss among all negative quarters is -39%. ETH has only outperformed BTC in six quarters.
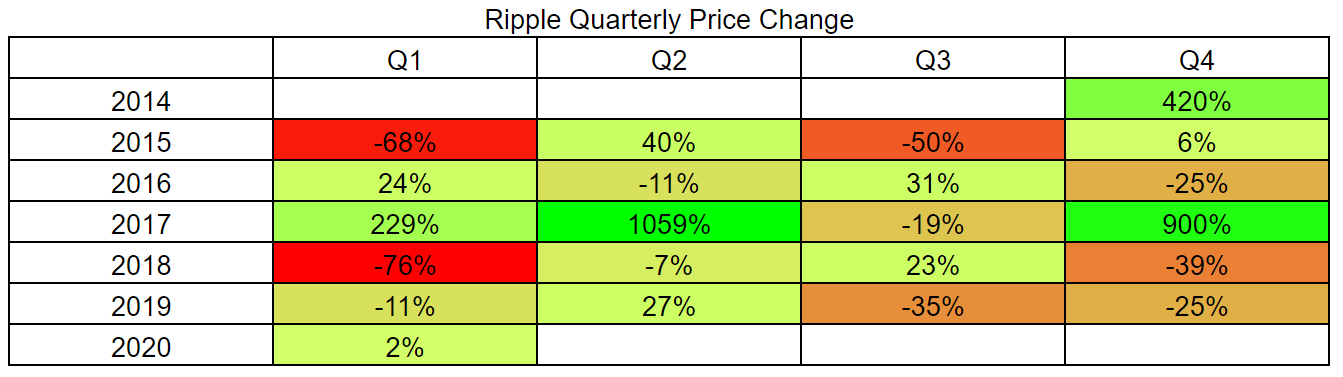
Ripple (XRP) has had 21 total trading quarters, with just over half yielding a negative return. Positive quarters averaged 276%, while negative quarters averaged -33%. The asset has outperformed BTC in eight total quarters and outperformed ETH a total of nine quarters. However, since Q4 2017, XRP has only had two positive quarters.
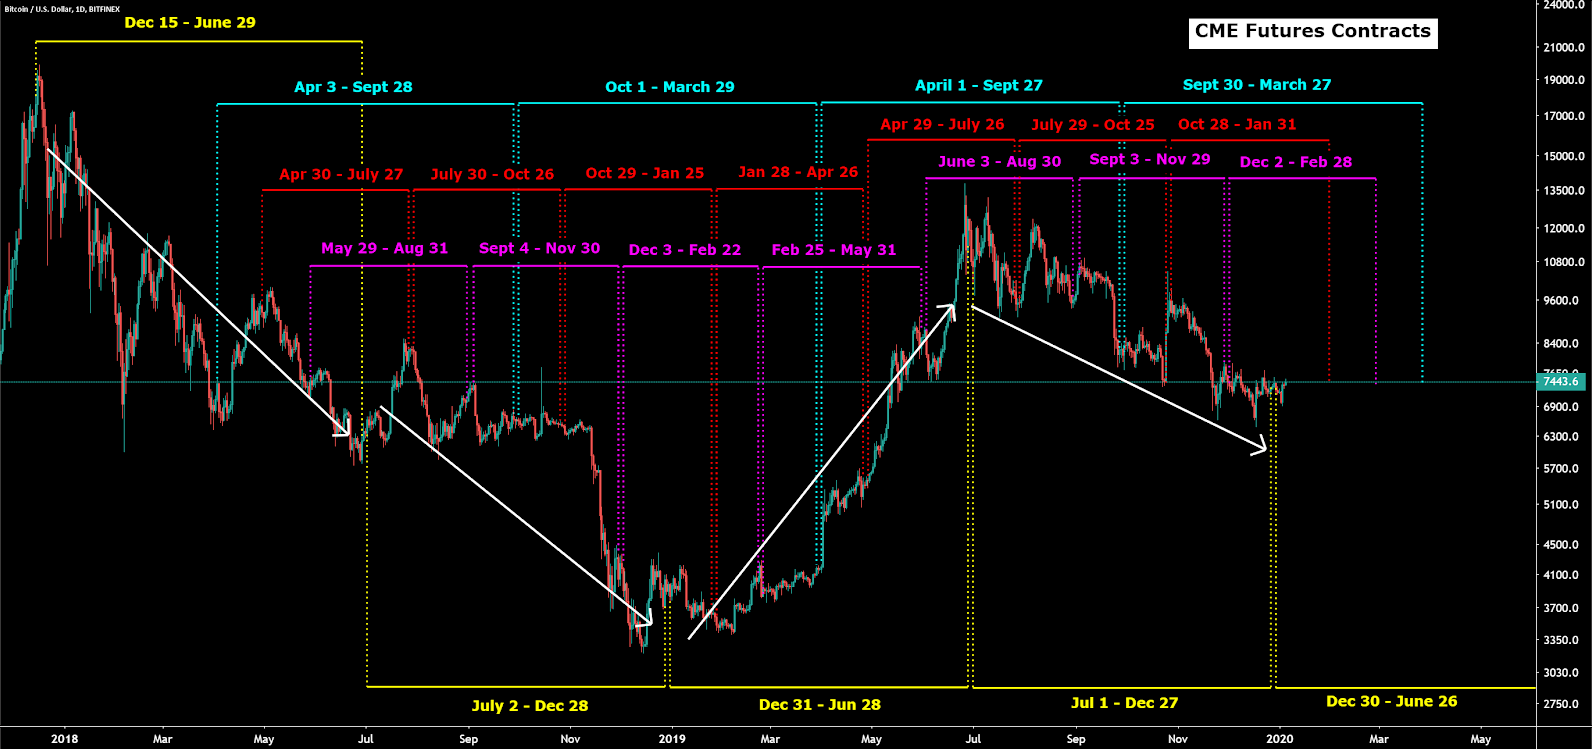
The Chicago Mercantile Exchange (CME), which facilitates the largest portion of derivatives contracts in the world, launched a cash-settled BTC futures contract in December 2017. The opening and expiration dates of futures and options markets have had an increasing influence on market pricing.
Volume and price volatility have typically increased near each contract rollover period. The bi-annual contracts have also largely dictated the market direction for each period.
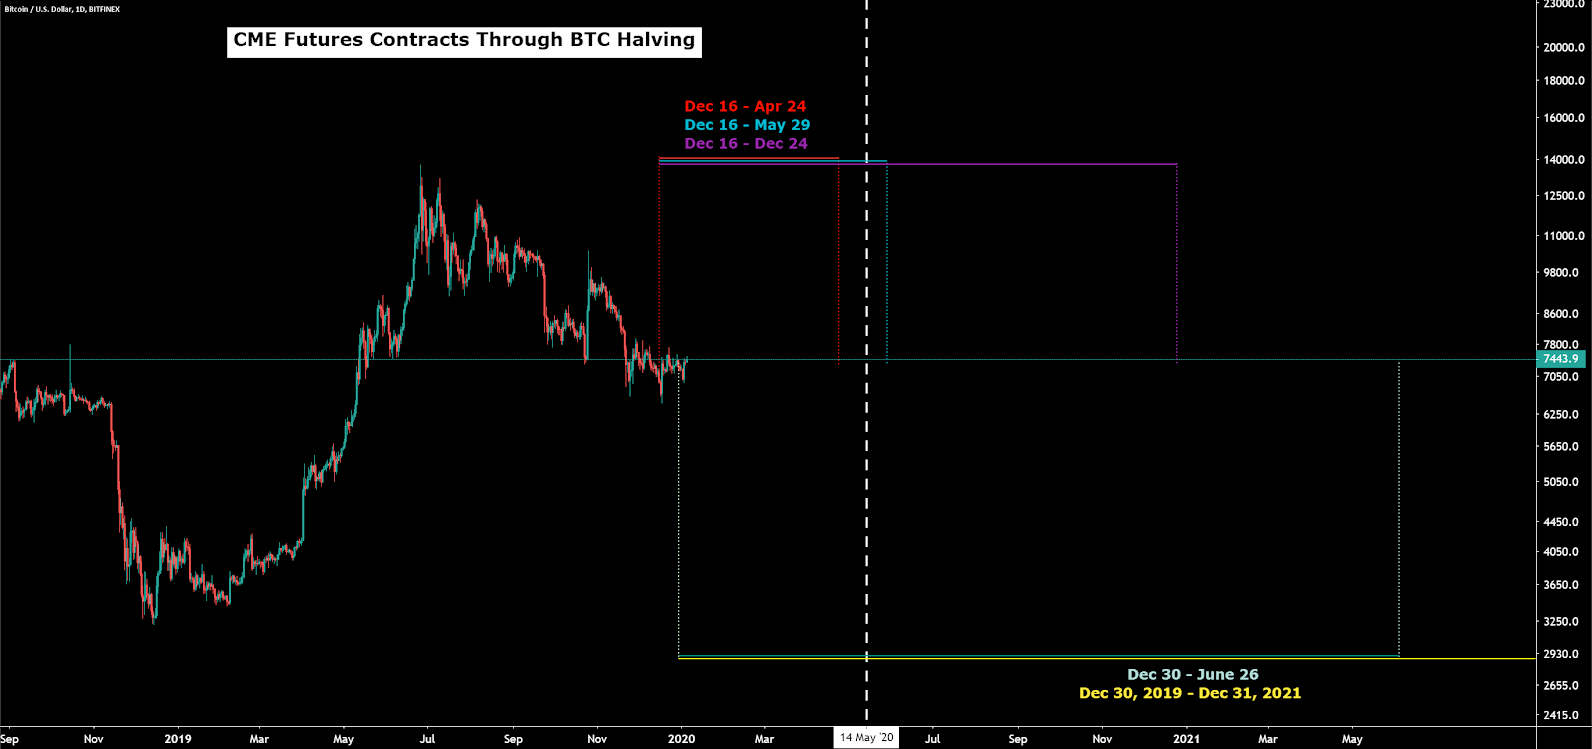
The CME has also recently added several long-dated contracts that extend through the Bitcoin block reward halving, which is slated to occur in May this year.
## The Ponzi Giveth and the Ponzi Taketh
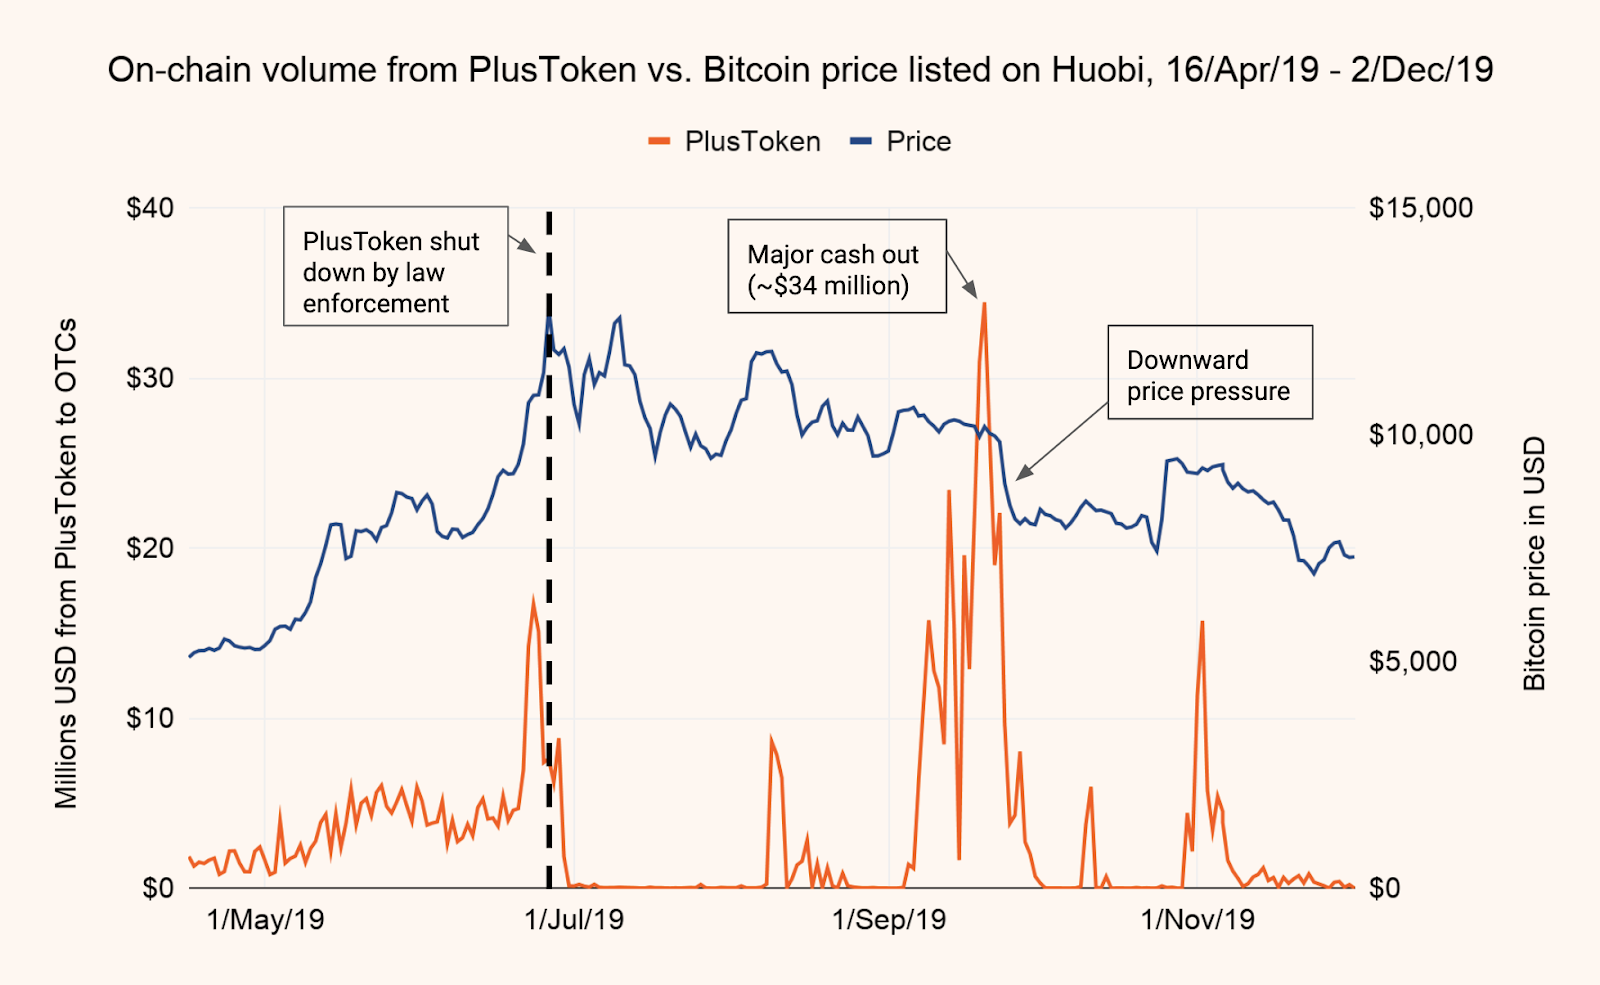
The crypto narrative throughout last quarter was dominated by the Asian PlusToken Ponzi scheme, which collected 180,000 BTC, 6,400,000 ETH, and 110,000 USDT throughout 2018 and 2019, or roughly US$2 - US$3 billion in total. Some of the members of the scheme were arrested in late June, and some of the funds were sold in Q4.
The moving assets were first noticed due to a large mixing transaction on the Wasabi wallet. In August and September, LaurentMT and ErgoBTC began mapping these transactions, discovering links to Huobi. Despite disagreement in the crypto community, PlusToken-related buying pressure likely played a contributing role in the Q2 bull market and PlusToken-related selling pressure likely played a contributing role in the Q4 bear market.
## On-Chain Activity Closes Flat for the Year
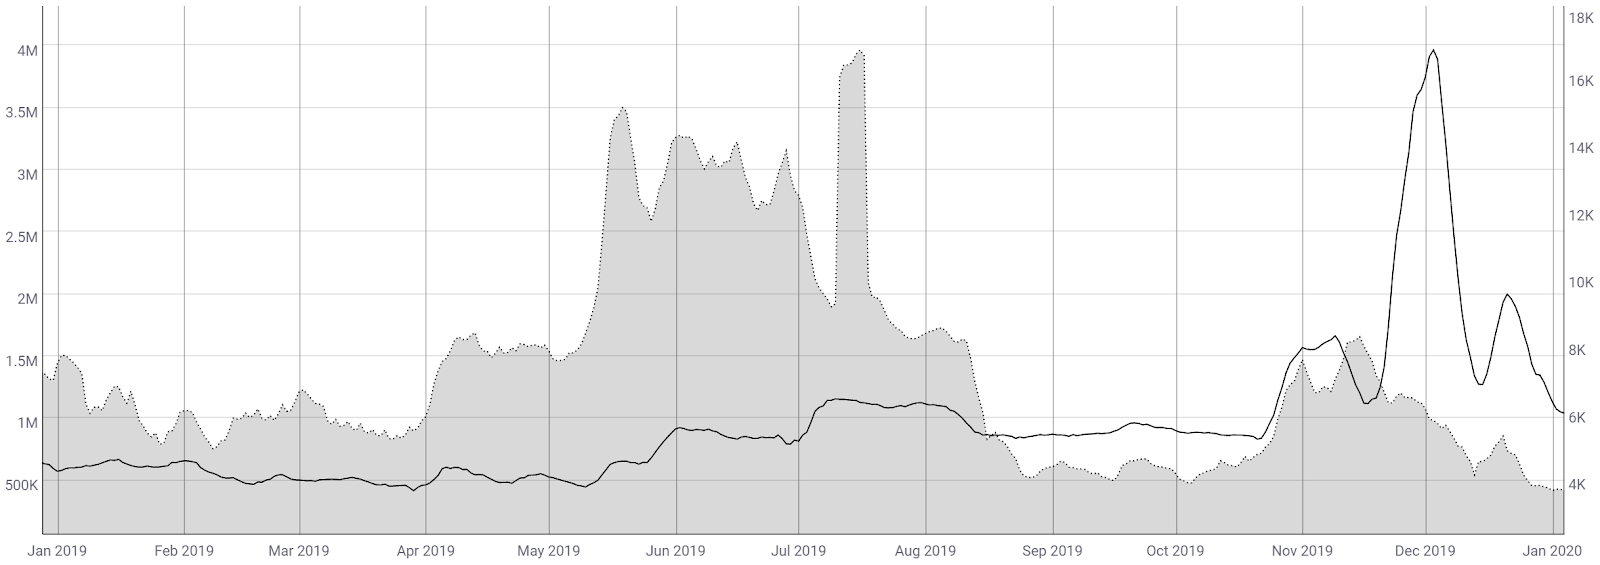
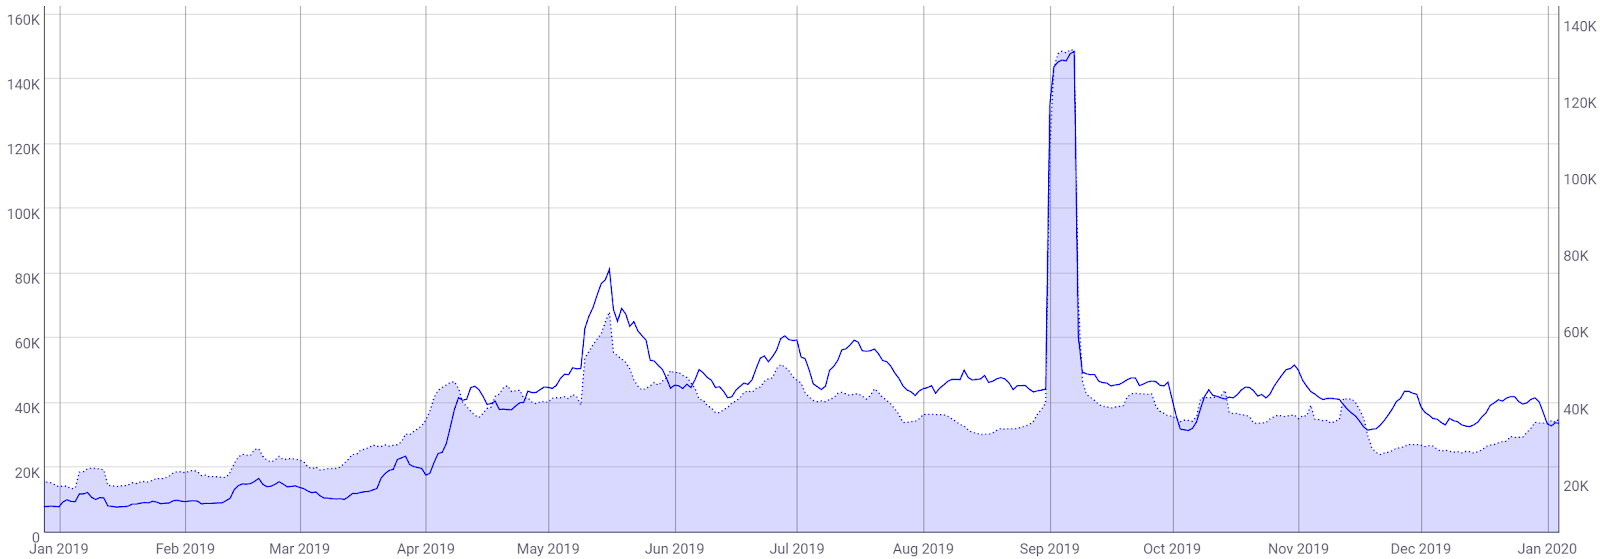
Metrics tracking on-chain activity for major assets essentially closed mostly flat for the year. Both average transactions per week (line, charts below) and weekly active addresses (fill, charts below) saw virtually no change throughout 2019 for Bitcoin (BTC), Ethereum (ETH), Ripple (XRP), Bitcoin Cash (BCH), and Litecoin LTC.
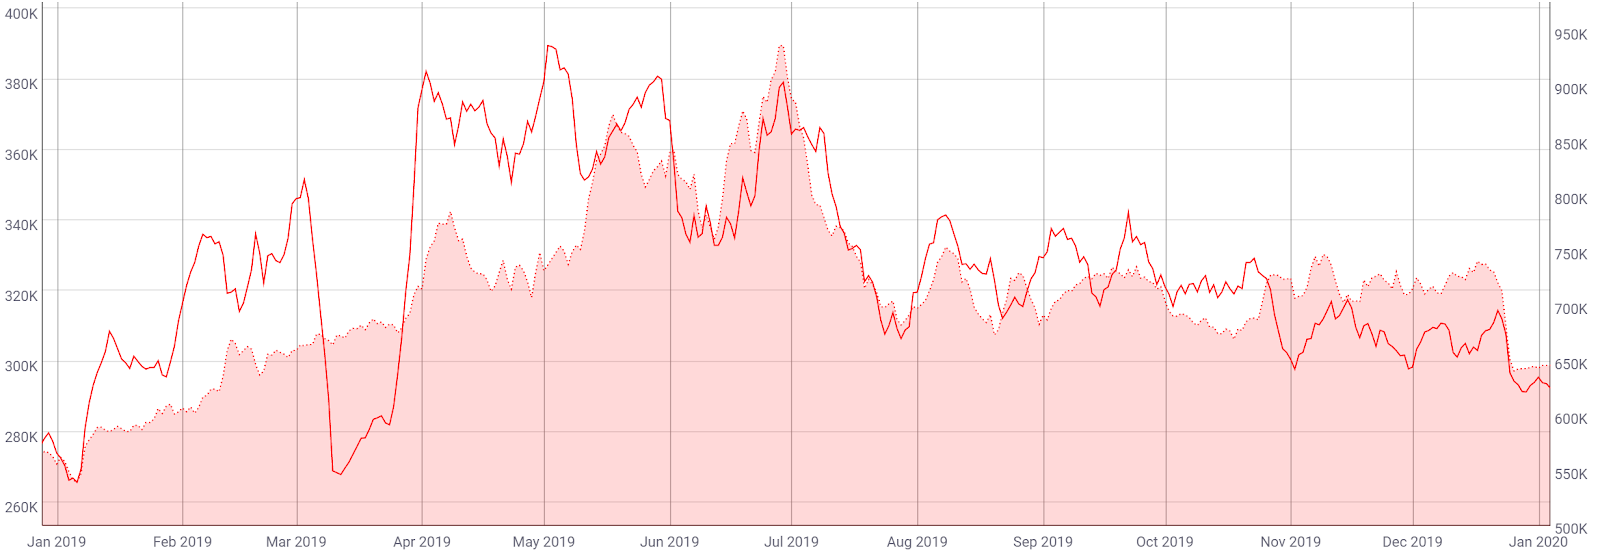
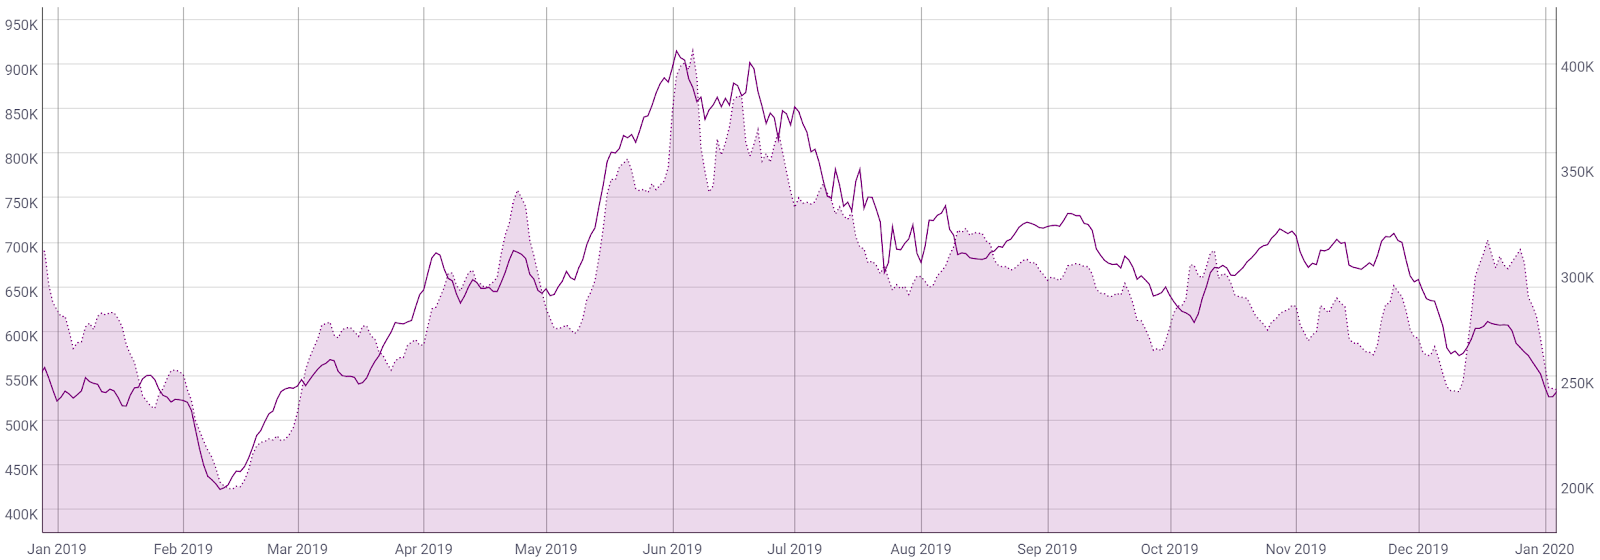
The spike in XRP transactions was due to a swathe of low-value transactions on the chain while the spike in BCH transactions and active addresses was related to a stress-test on the chain.
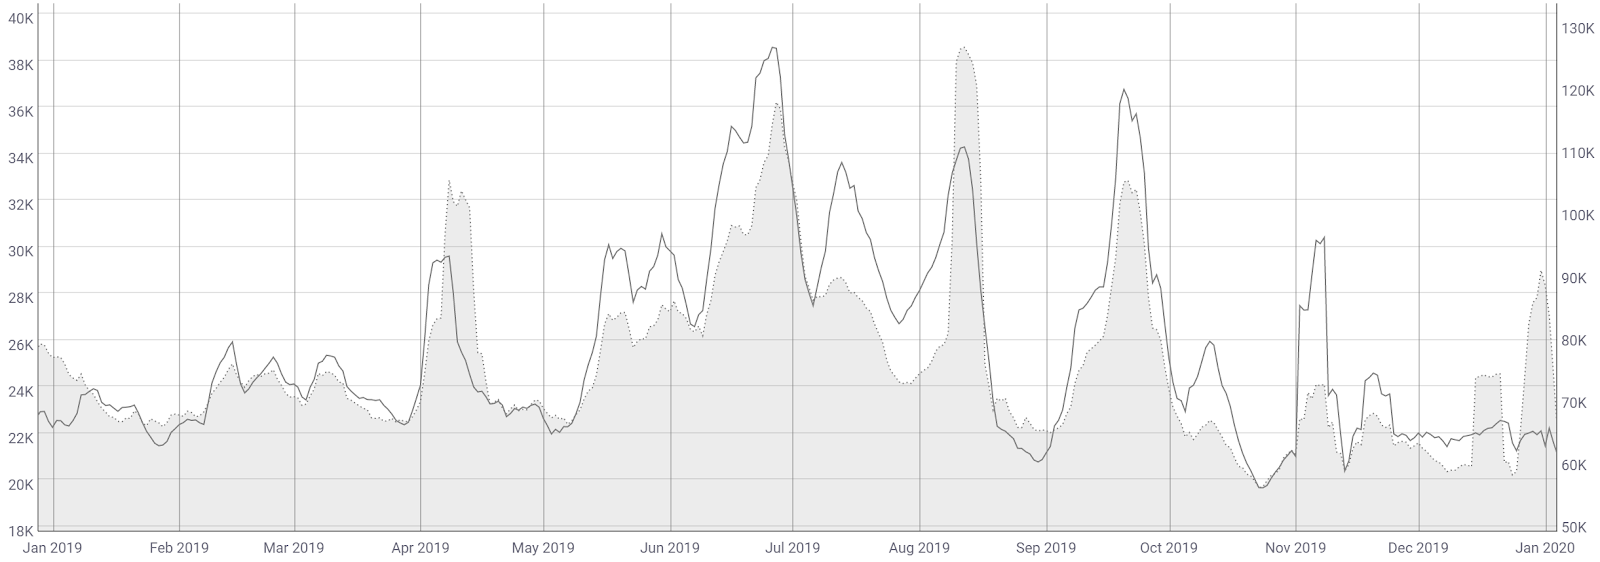
LTC experienced a block reward halving in Q3, which likely played a role in the rollercoaster of on-chain activity.
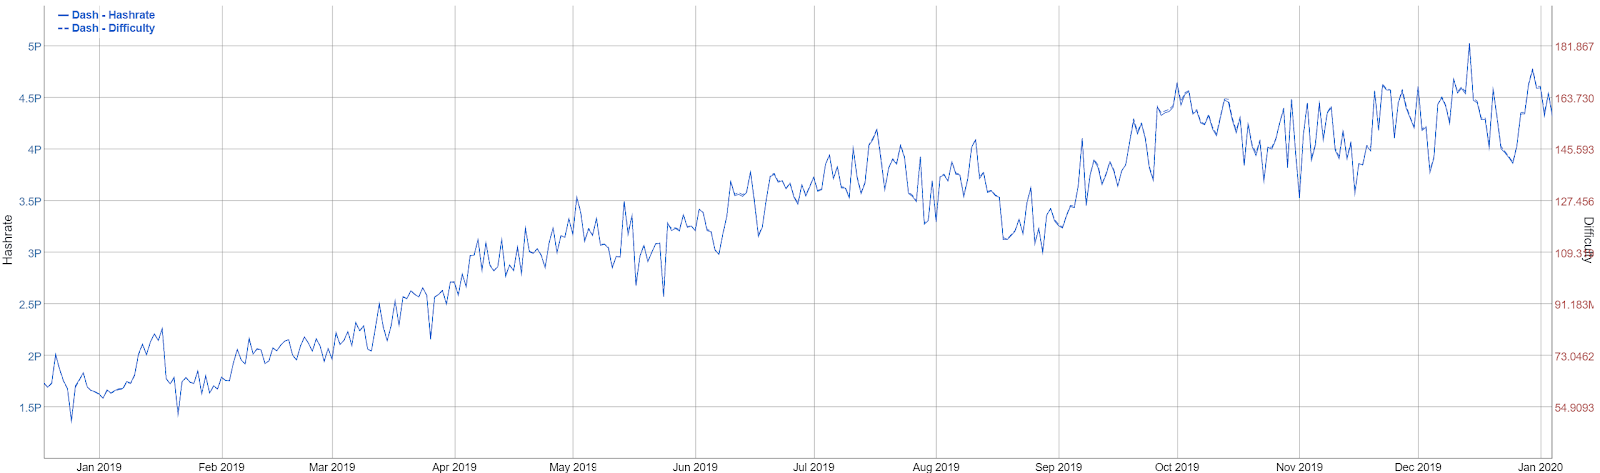
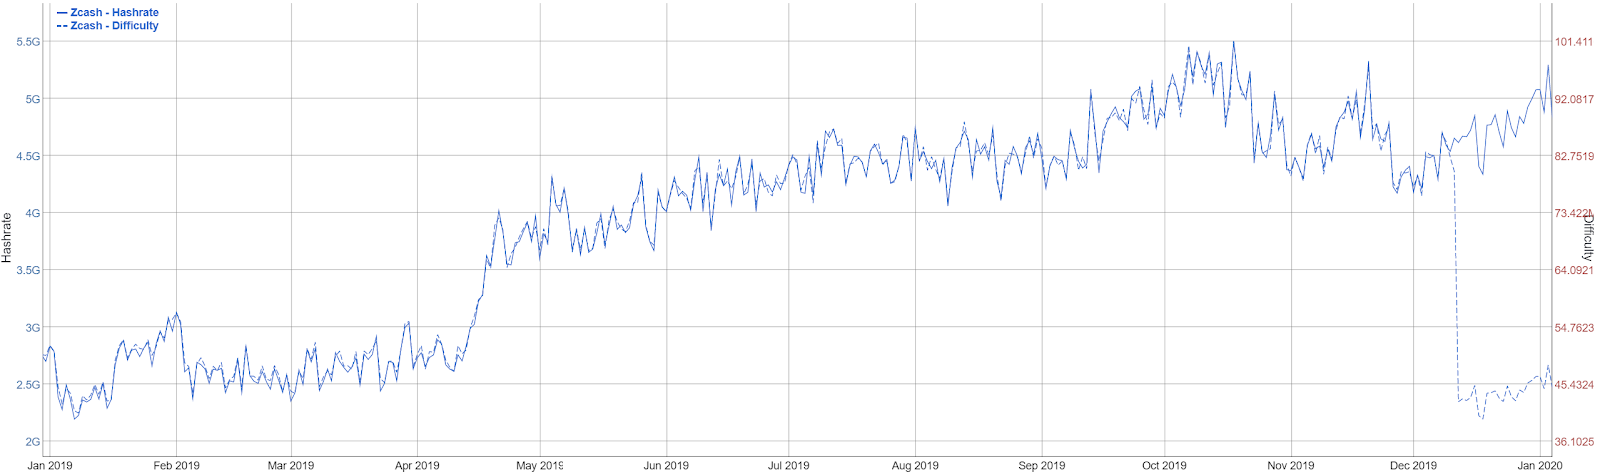
## Proof of Work Hash Rates Soar
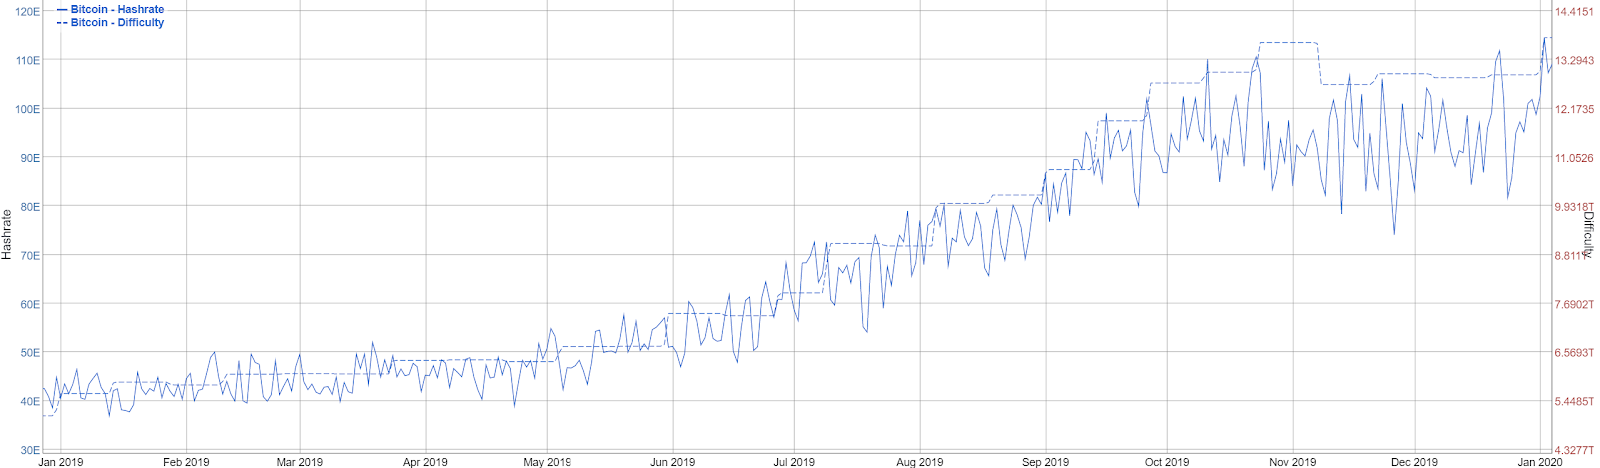
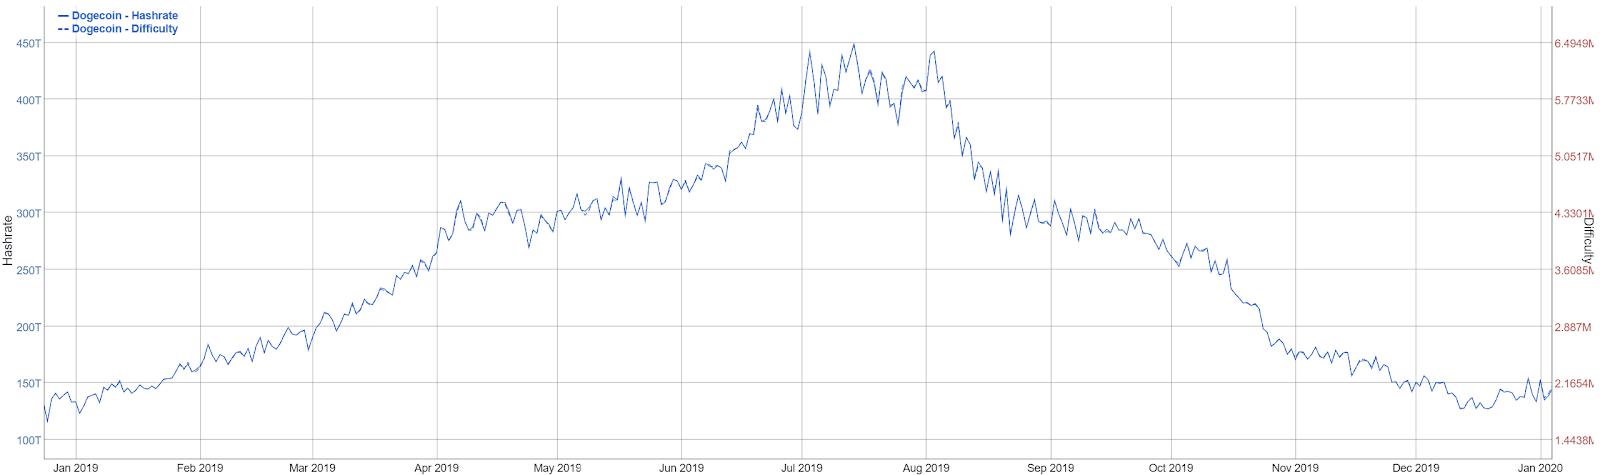
Mining metrics show that hash rate and difficulty for many assets using Proof-of-Work (PoW) algorithms continued to explode. This can be attributed to; cheap electricity globally from renewable energy sources, an increase in application-specific integrated circuits (ASICs) production, and increasing ASIC efficiency. Hash rates and difficulty hit record highs this year for Bitcoin (BTC), Litecoin (LTC), Dash (DASH), Zcash (ZEC), Monero (XMR), and Doge (DOGE).
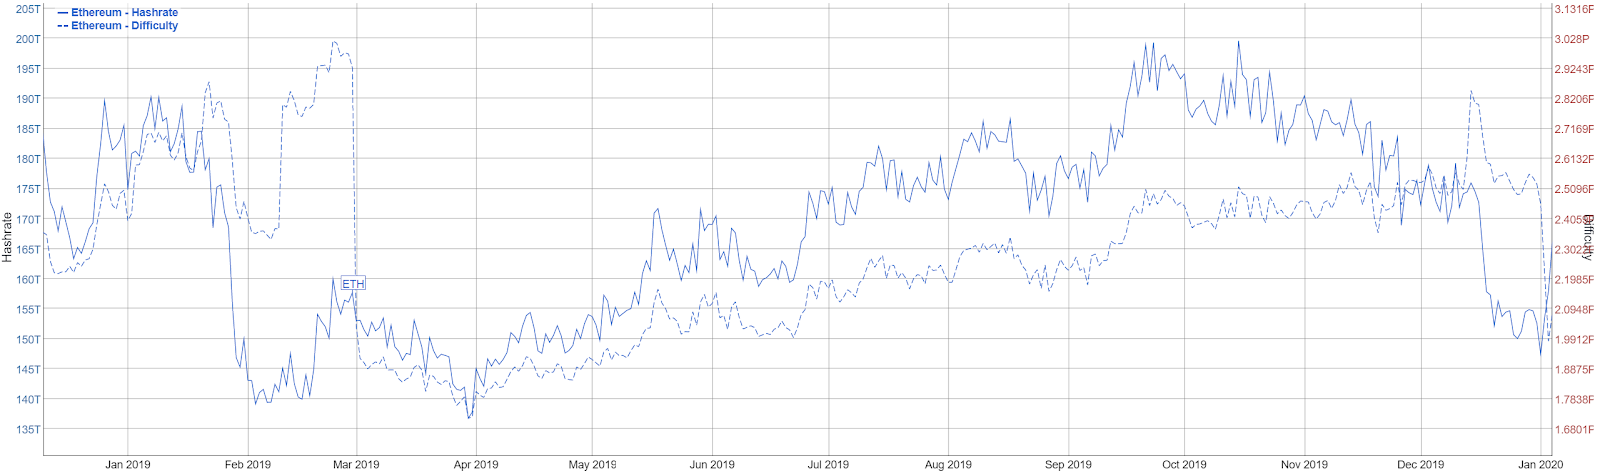
The ETH hash rate is well below the record high, but has increased steadily since April, after a difficulty bomb and block reward adjustment. ETH is due for a PoW algorithm change, to ProgPoW, sometime in 2020, in an effort to decrease ASIC use. The most recent difficulty bomb was delayed in the Muir Glacier hard fork on January 2nd.
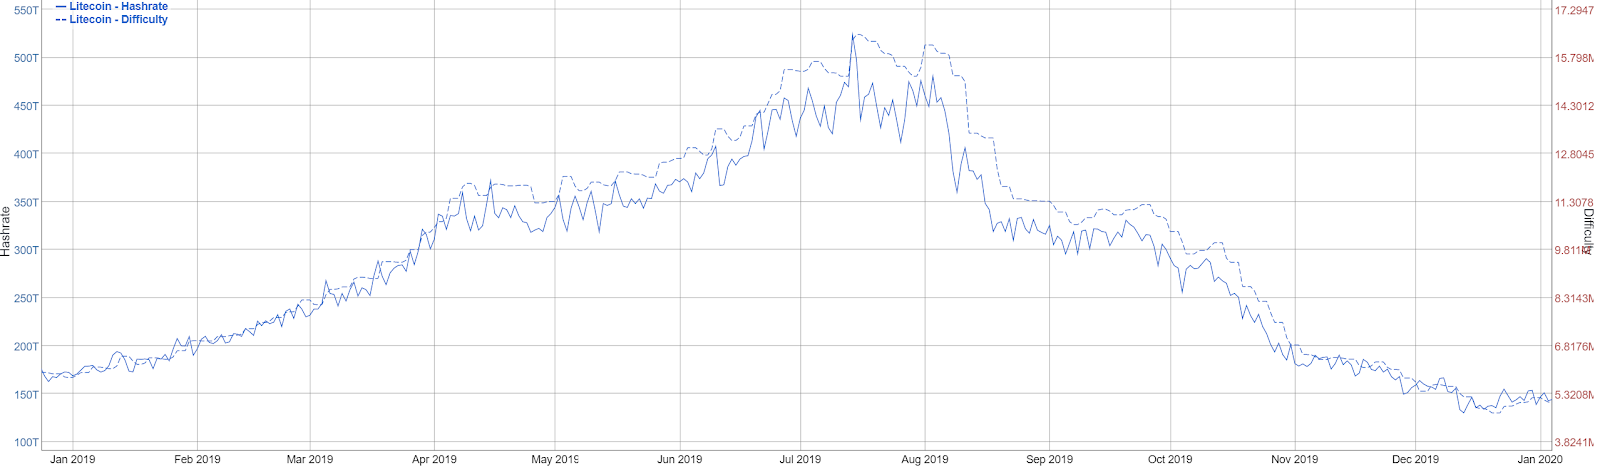
The LTC halving played a role in both the LTC and DOGE hash rates as DOGE is merge-mined with LTC.
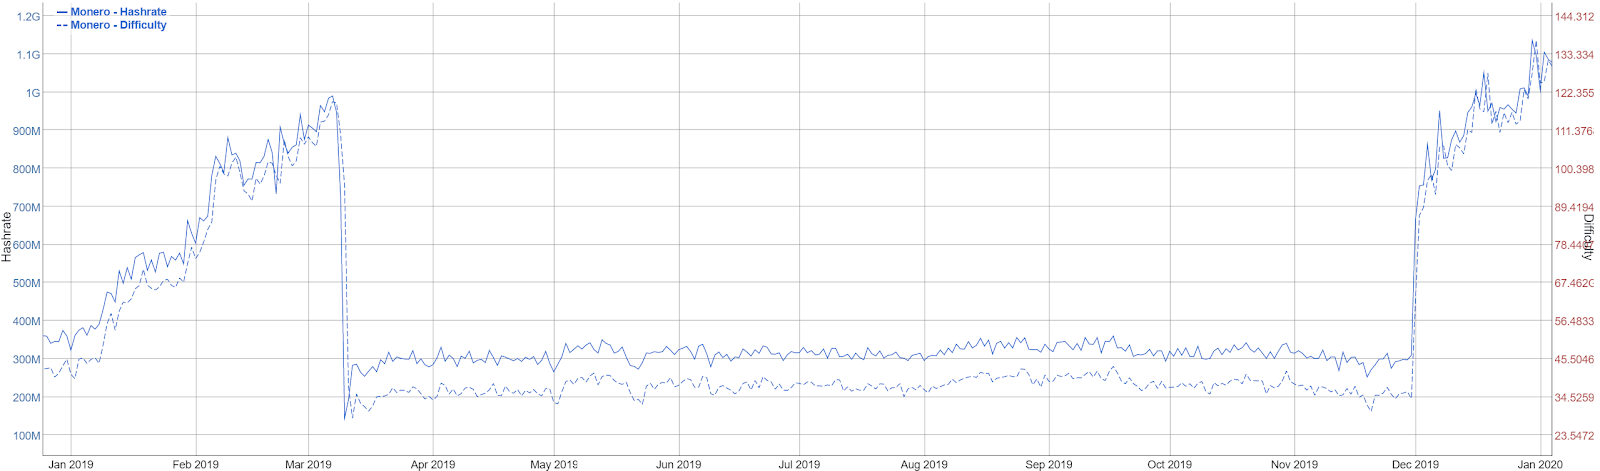
XMR, which is developed with a staunch anti-ASIC approach through recurring algorithm adjustments, released a new consensus algorithm change this quarter. RandomX, optimized for CPU mining, has quickly increased the XMR hash rate over the past few months. Although unlikely, but not impossible, a mining optimizer or botnet network using the RandomX consensus algorithm may have already been developed, explaining the large increase in hash rate.
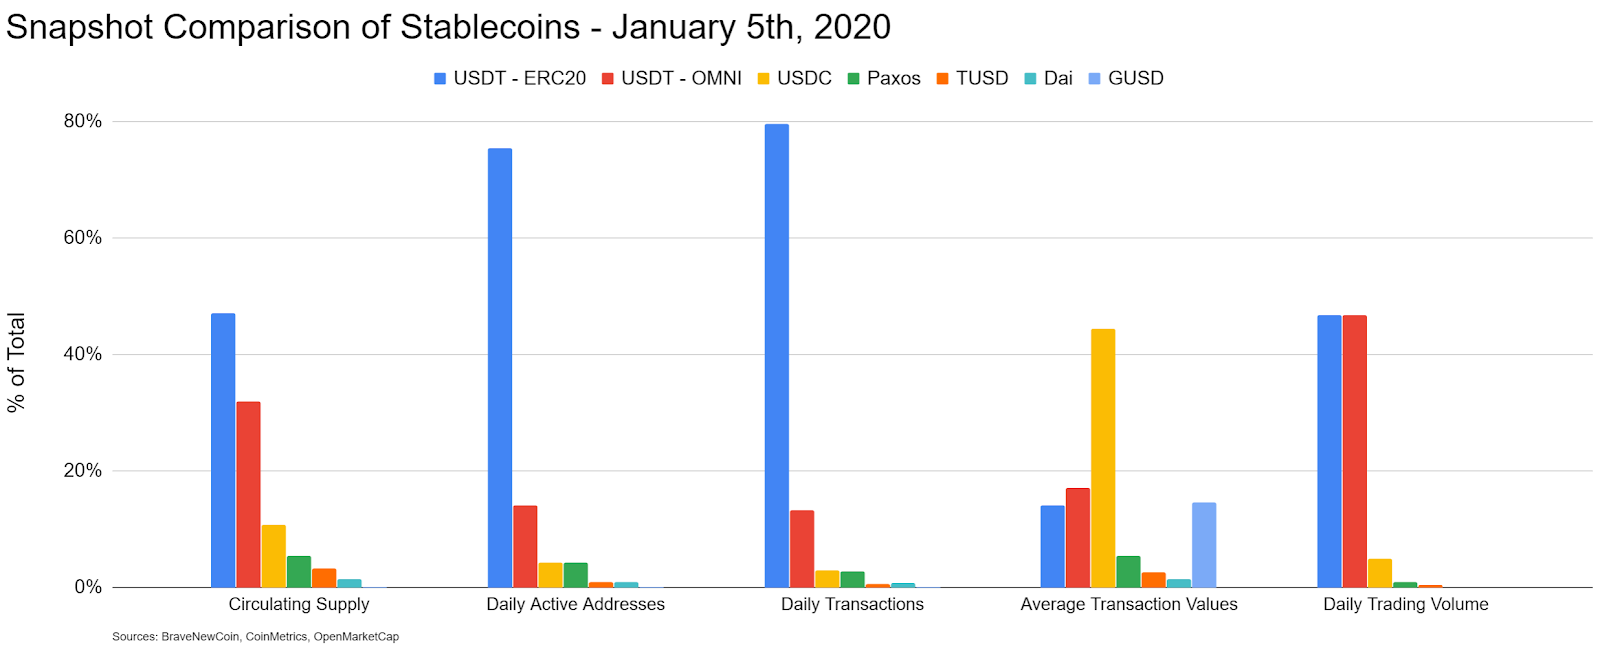
## Tether’s Dominance Amongst Stablecoins Continues
An Ethereum (ETH)based version of Tether (USDT) was released in January 2018. Adoption was slow initially but increased rapidly as exchanges implemented the asset. USDT-ERC20 quickly became the dominant stablecoin medium of exchange, which means continued and increasing strain on the ETH blockchain. Tether was originally launched on the Omni (OMNI) chain, and USDT-OMNI circulating supply and transfers will likely continue to shrink as USDT transfers on ETH are both cheaper and quicker than those on OMNI.
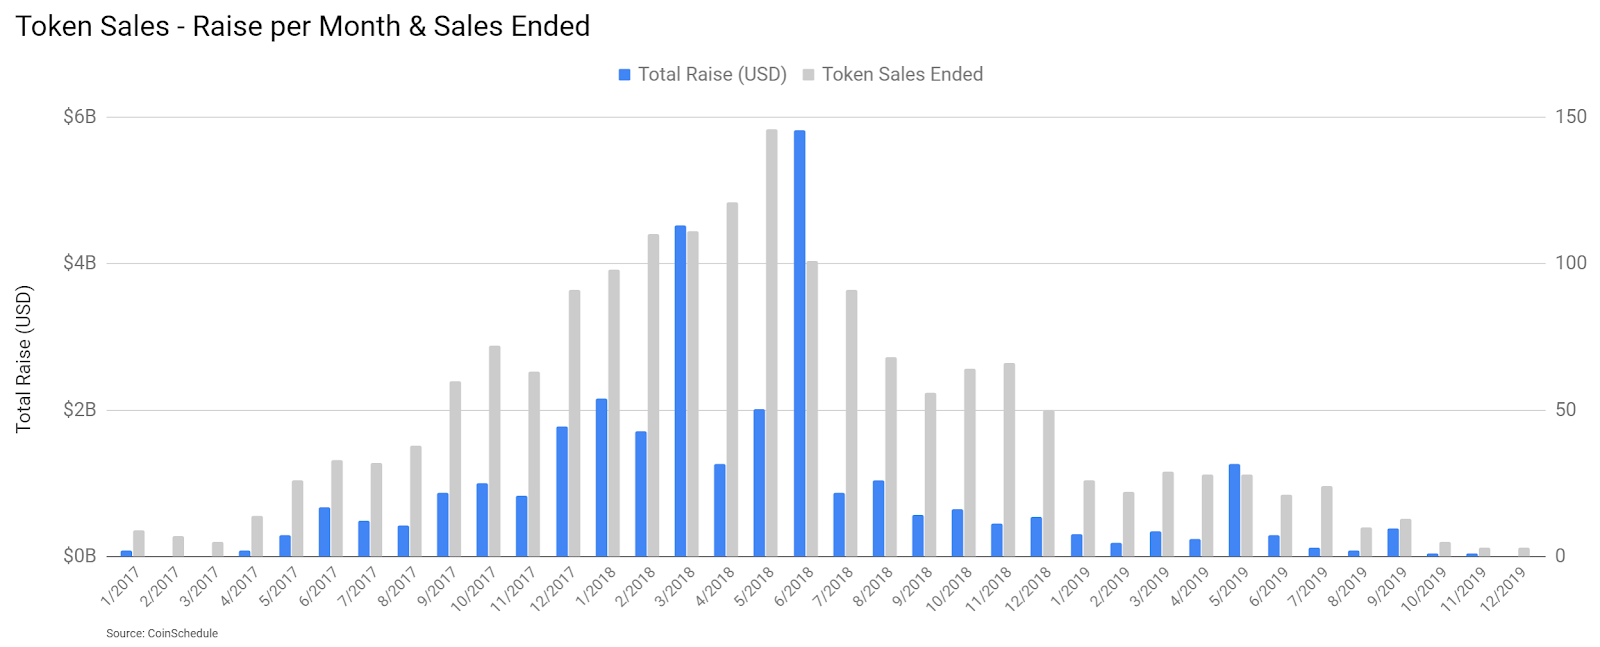
## Initial Coin Offerings and Treasuries Continue to Decline
Initial Coin Offerings (ICOs) have largely been replaced with Initial Exchange Offerings (IEOs) as a means for projects to raise capital. While ICOs were typically launched on Ethereuem (ETH), IEOs are typically not. IEOs have served as a way for exchanges to generate additional fees for a listing and guaranteed trading pairs for the projects. The largest IEO thus far has been Bitfinex’s LEO token, which raised a reported US$1 billion in May, with LEO trading on the exchange shortly thereafter. The total raises and token sales of ICOs and IEOs have essentially dropped to nearly zero.
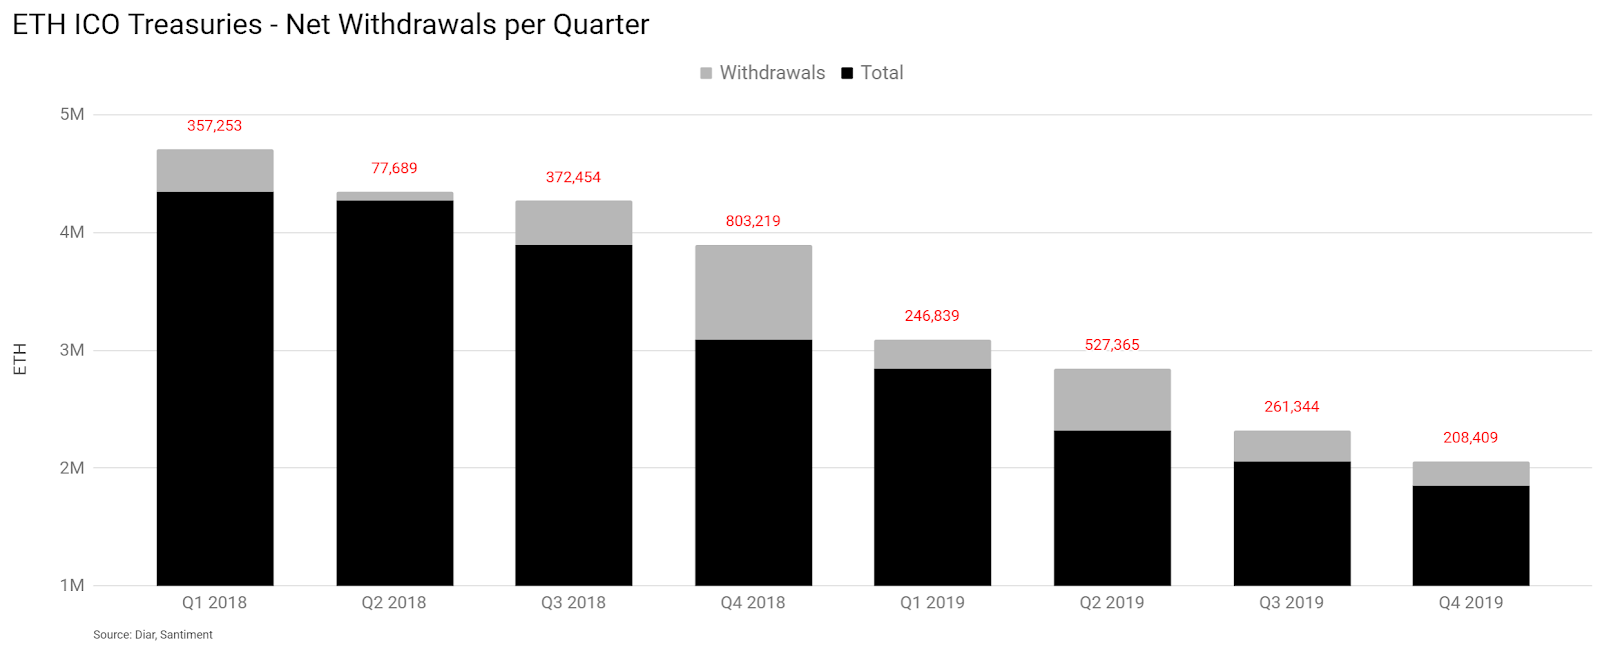
ICO treasuries continue to decrease as well, with just under two million ETH held by projects with transparent wallet addresses. Q4 marked the smallest reduction in ICO treasuries for any quarter throughout 2019. The largest ICO treasuries include DigixDAO (DGD), Golem (GNT), Aragon (ANT), Gnosis (GNO), and Status (SNT).
The DGD ICO occurred in early 2016, raising 466,648 ETH, or between US$5.44 million at that time. DGD’s current treasury of over 386,000 ETH is now worth over US$54 million. In Q4, DGD raised a dissolution proposal, which would return all remaining ETH in the DigixDAO fund to DGD holders.
## Flash Crashes and Price Anomalies Continue
Kraken, Deritbit, and Coinbase experienced flash crashes or price anomalies this quarter, which were similar to previous events on Bitstamp and Coinbase earlier in the year. In all instances, BraveNewCoin’s liquid indices were unaffected.
Spot exchanges are often manipulated in order to trigger margin cascades on derivatives exchanges. Repeated incidents like this highlight the need to disincentivize the exploitation of weaknesses in exchange infrastructure, as well as implement institutional-grade indices on derivatives exchanges, like the BNC BLX, to protect against market manipulation.
OhNoCrypto
via https://www.ohnocrypto.com
Josh Olszewicz, Khareem Sudlow