
Litecoin Price Analysis - A rare protocol upgrade
#crypto #bitcoin
OhNoCrypto
via https://www.ohnocrypto.com
Josh Olszewicz, Khareem Sudlow
The Litecoin (LTC) spot price increased nearly 550% from December to June, but has fallen 77% from the June high, and remains down 88% from the record high set in December 2017. The market cap currently stands at US$2.8billion with US$647 million in exchange-traded volume over the past 24 hours.
LTC is a Bitcoin (BTC) fork created by Charlie Lee in 2011. The network has a target block time of two minutes and 30 seconds, as opposed to Bitcoin’s 10 minutes. LTC also has a four-fold increase in the total supply, and uses a different Proof of Work consensus algorithm called Scrypt.
Charlie Lee is a former Google employee and the brother of Bobby Lee, CEO of the now-closed Chinese cryptocurrency exchange BTCC. Lee worked as an engineer at Coinbase from 2013 to 2017, where he was instrumental in spearheading the companies LTC listing.
Despite selling all of his personal LTC holdings in December 2017, Lee continues to be involved in the project’s development and attempts to increase adoption through the Litecoin Foundation, a non-profit registered in Singapore. The second-ever Litecoin summit occurred in Las Vegas at the end of October, which was headlined by Ron Paul.
Four recent partnerships established by the Foundation include; Glory kickboxing, the Miami Dolphins professional football team, the San Diego Film Festival, and Flexa, which added LTC as a method of payment for its 39,000+ merchant network. Previous partnerships include the Bibox exchange and Ternio in mid-June, which is set to issue a physical debit card allowing for direct cryptocurrency spending.
In mid-October, the Foundation released an unaudited financial statement showing net assets of US$570,000, after concerns were raised regarding the Foundation’s solvency. Lee added that “the Litecoin Foundation was started in 2017. Development happened before the foundation even existed. And development will happen even if the foundation runs out of money. This is a decentralized cryptocurrency after all.”
Turning to developer activity, the LTC project has 37 repos on GitHub. Most coins use the developer community of GitHub where files are saved in folders called "repositories," or "repos," and changes to these files are recorded with "commits," which save a record of what changes were made, when, and by who. Although commits represent quantity and not necessarily quality, a higher number of commits can signify higher dev activity and interest.
In a tweet thread, Lee addressed the growing concerns around the seemingly low level of development. He explained that the Litecoin project has only ever had a total of six core developers, who mainly merge BTC code into the LTC code. Adrian Gallagher (thrasher), one of the core developers, works on a personal branch and then merges finalized changes with the master branch at a later date. Gallagher’s personal branches are not tracked, while the final merge is.
Over the past year, there have been a cumulative 10 commits to the main GitHub repo, litecoin-project/litecoin (shown below), with no commits in the past 90 days. Compared to previous years, 2019 has seen a marked reduction in dev activity. However, Litecoin.com announced that Litecoin Core 0.18.1 has entered the final testing stage in October
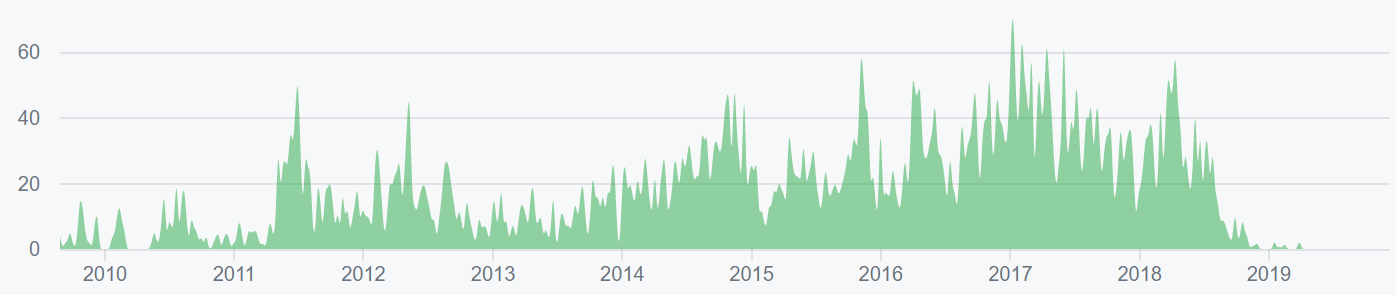
Source: Github - litecoin-project/litecoin
In late October, Litecoin Improvement Protocol (LIP) 2 and 3 were published, outlining Extension Blocks and MimbleWimble, respectively.
Extension Blocks (EB) are a type of sidechain first proposed by Bitcoin developer Johnson Lau in 2013, and allow for protocol variables that differ from the main chain. Therefore, EBs can have increased block sizes or bring increased programmability and privacy without the need for a hard fork of the entire chain. Each EB is only connected to the corresponding block from the main chain, as opposed to every other block in the main chain. Criticisms of EBs include decreased backward compatibility and decreased chain security.
MimbleWimble (MW) uses zero-knowledge proofs and a specific type of transaction mixing to obscure transaction details while still allowing for transaction verification. Adding MW through EBs allows for the opt-in use of transaction privacy on the LTC chain and brings increased coin fungibility. The soft fork will be activated one year from the day the implementation is released. Miners will be able to activate the change early with at least a 75% signaling threshold. A major criticism of private transactions revolves around an inability to audit the total coin supply, allowing for the possibility of phantom inflation.
Early this month, the Litecoin Foundation announced a fund to support the development of both EB and MW. The fund has a goal of raising US$72,000, to support developer David Burkett over the next year. The fund currently has collected 157 LTC and 0.014 BTC, or nearly US$7,000.
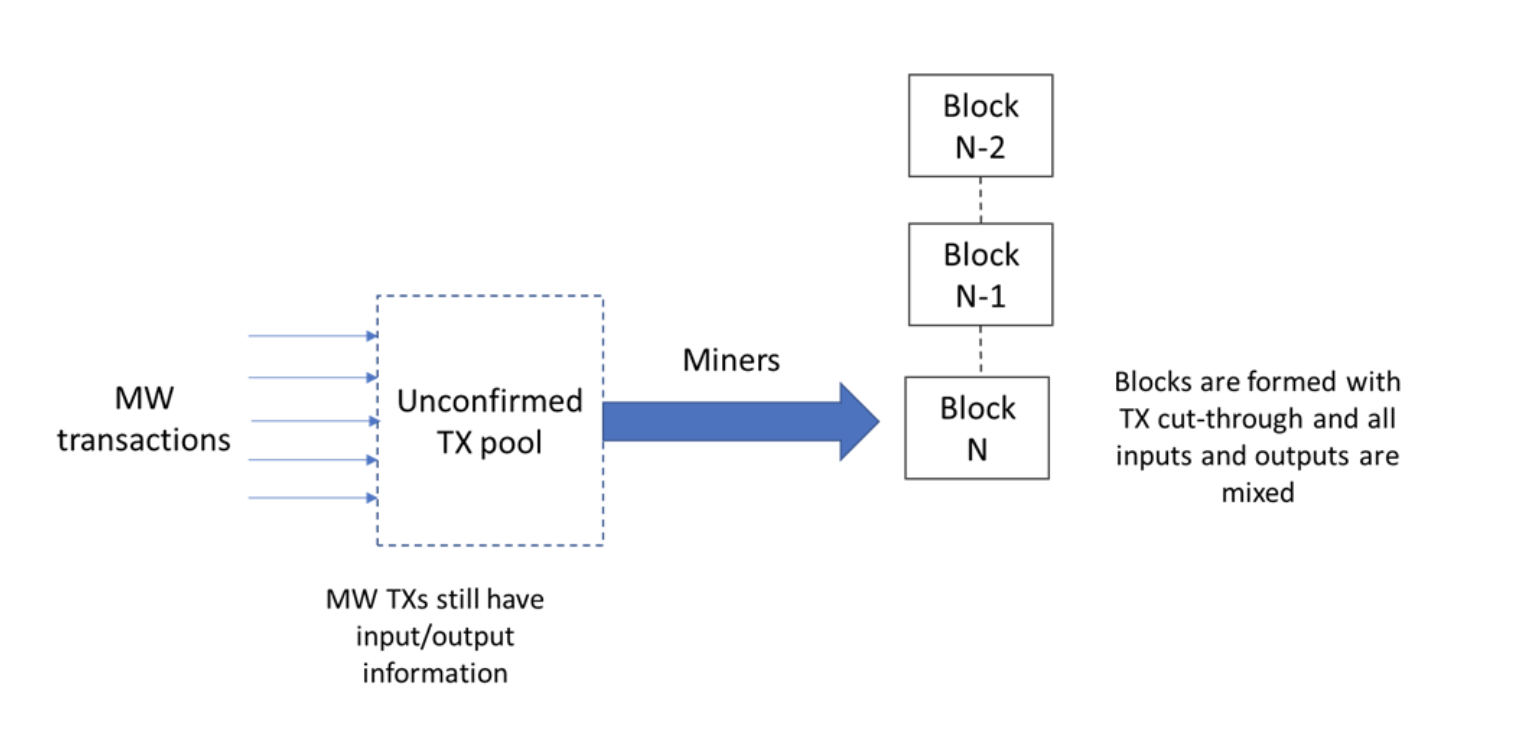
Source: thebitcoin.pub/t/mimblewimble-the-good-and-the-bad/49971
On the network side, LTC uses SegWit (SW) enabled addresses to both decrease individual transaction size and cost, as well as increase the maximum block size to more than 1MB. SW use has increased to over 65% in the past few months and also enables transactions to be used on the Lightning Network (LN), a bi-directional, off-chain, hub-and-spoke payment channel. The LTC LN currently has 816 channels and the network capacity exceeds 188 LTC, or US$12,000.
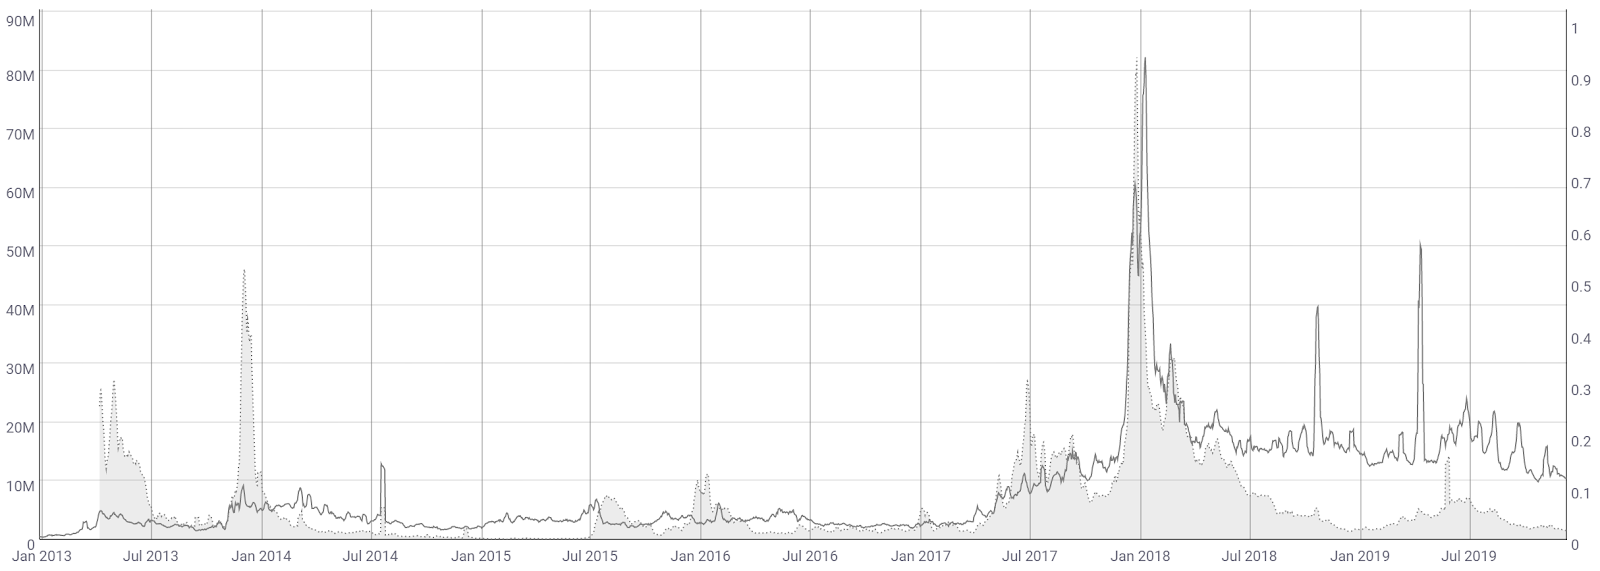
The number of LTC transactions per day (line, chart below) has ranged from 20,000 to 40,000 since March 2018. Transactions rose substantially in December 2017 and January 2018, which was most likely in response to the expensive and delayed transactions on the BTC network. There are currently less than 500 pending LTC transactions.
The average transaction value on the network (fill, chart below) fell dramatically throughout 2018 but increased from December to July. This most recent increase also followed the December to July increase in price. Average transaction values are currently US$3,000, down substantially from a high of ~US$30,000 in November 2017.
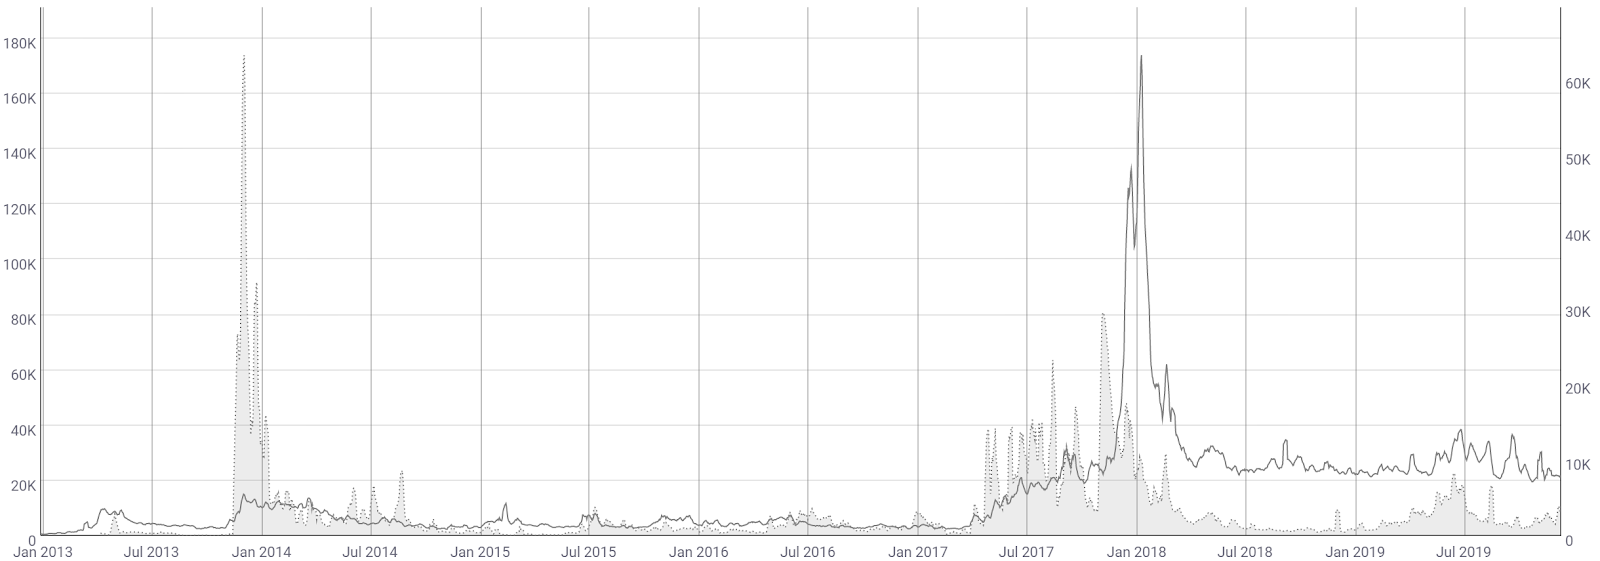
Source: CoinMetrics
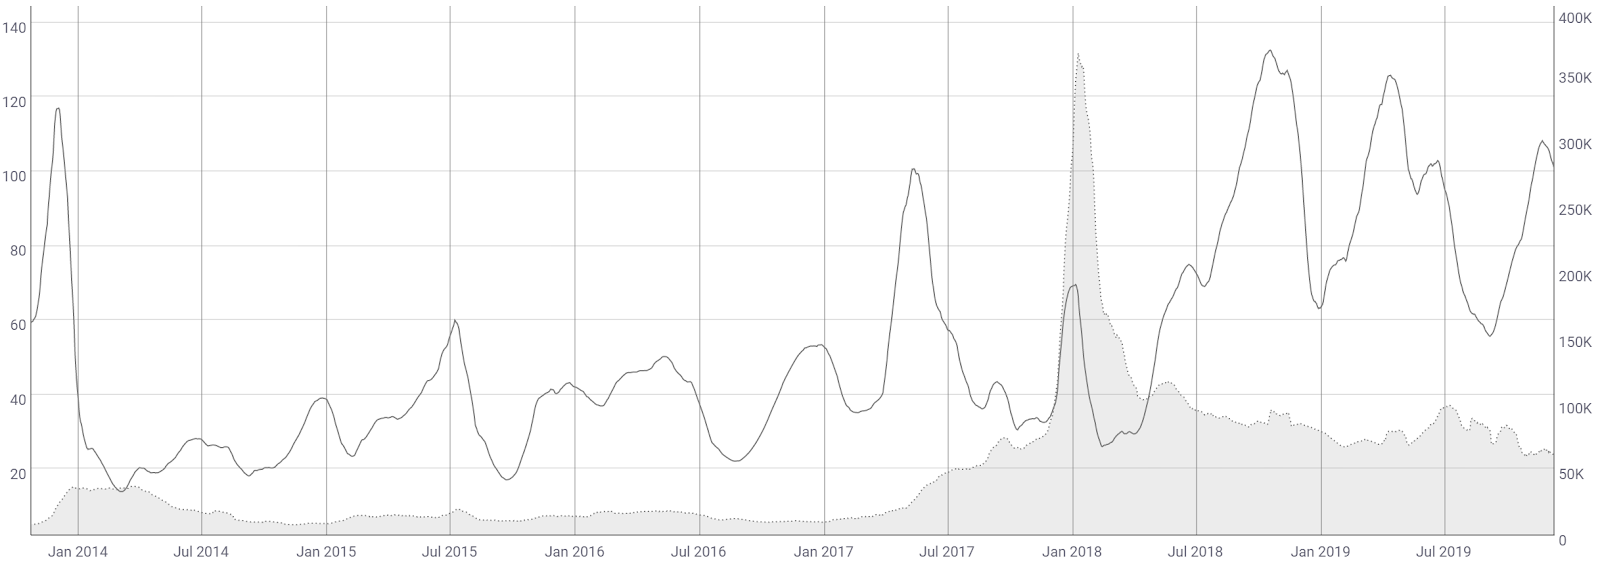
The network average block size (line, chart below) fell dramatically throughout 2018 and early 2019, and has also decreased since the block reward halving earlier this year. An average of 10MB per block currently represents a multi-year low, suggesting relatively little on-chain activity compared to the previous past two years. Historically, the average block size still remains higher than any point prior to June 2017.
The average transaction fee (fill, chart below) has fluctuated dramatically with block size, and is currently US$0.019, only 3.5% of the current BTC transaction fee. Fees spiked to nearly US$0.16 in late May, along with the spike in transactions at that time. Litecoin Core v0.17.1, released in May, lowered the default minimum transaction fee to 0.0001 LTC/kB.
Source: CoinMetrics
The 30-day Kalichkin network value to estimated on-chain daily transactions (NVT) ratio (line, chart below) is currently 100, which is well above the historic norm. An NVT below 20 would likely indicate organic and sustained bull market conditions.
Inflection points in NVT can be leading indicators of a reversal in asset value. An uptrend in NVT often suggests a coin is overvalued based on its economic activity and utility, which should be seen as a bearish price indicator, whereas a downtrend in NVT suggests the opposite.
Active and unique addresses are important to consider when determining the fundamental value of the network based on Metcalfe's law. Monthly active addresses (MAAs) have declined since January 2018 (fill, chart below), representing multi-year lows. MAAs remain well above historic levels prior to July 2017. However, LTC has far fewer MAAs than either BTC or ETH but over 10x more active addresses than Ripple (XRP).
The top 100 LTC addresses currently hold 39% of the available supply, compared to 13.5% for BTC, 33% for ETH, and 75% for XRP. Most of these top addresses are most likely exchange holdings. In November 2018, Coinbase created 40 new LTC cold storage addresses, each containing 300,000 LTC.
Source: CoinMetrics
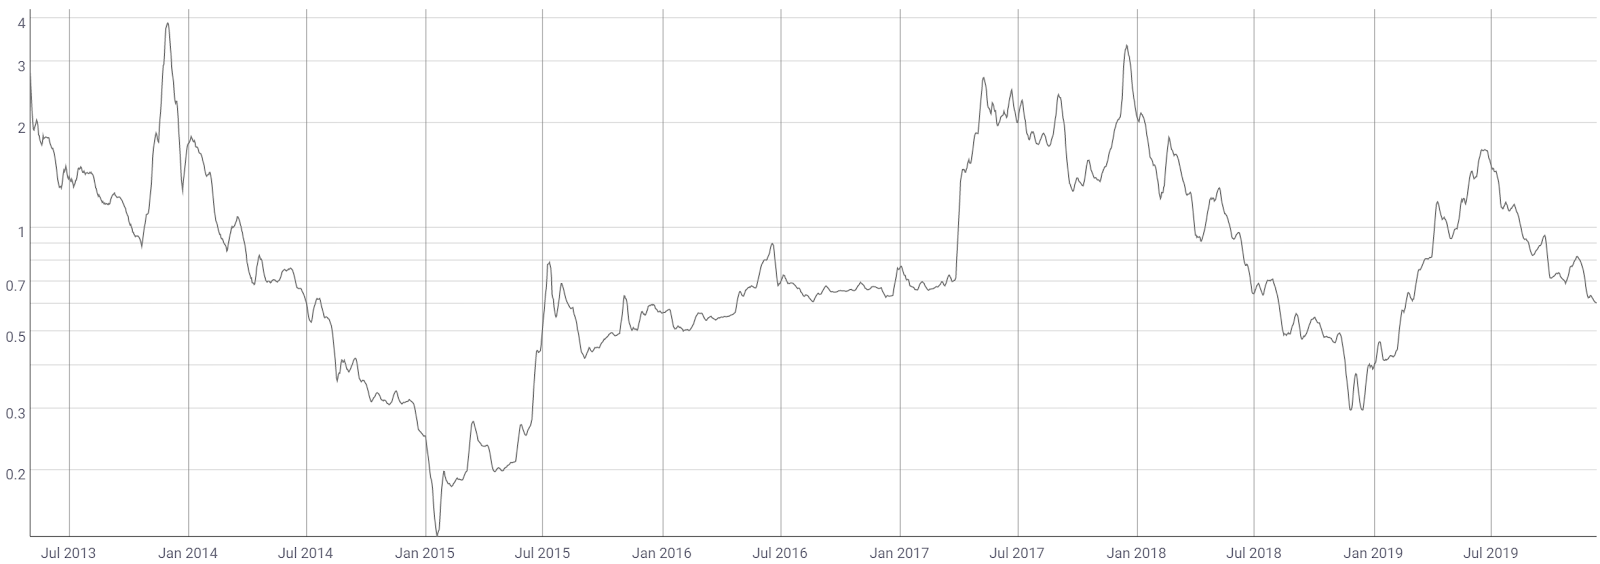
Another crypto-native fundamental metric is the MVRV ratio, or the market cap divided by the realized cap. Realized cap approximates the value paid for all coins in existence by summing the market value of coins at the time they last moved on the blockchain.
Historically, periods of an MVRV less than 0.5 have represented oversold conditions, whereas periods of an MVRV greater than 2.5 have represented overbought conditions. Both instances of MVRV above 3.0 have represented all-time highs in price. Currently, MVRV is 0.6, which is approaching oversold territory based on network utility.
Source: CoinMetrics
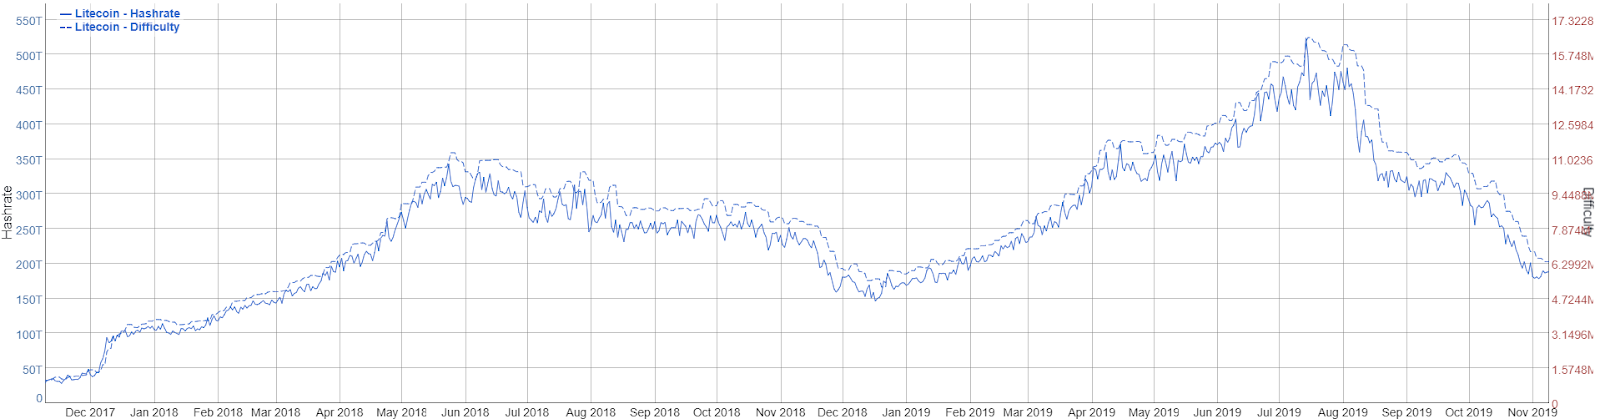
Hash rate and difficulty rose substantially from mid-December to early August, with both reaching record highs. Since the block reward halving in early August, the hash rate has dropped by nearly 70%.
Of the 84 million LTC to ever exist, 76.08% have been mined. Inflation per year currently stands at 3.99% and is set to decrease to 1.80% after the next block reward halving in August 2023. The network currently has 1625 active public nodes, most of which reside in the United States and Germany. Only 44% of these nodes are running the latest version of Litecoin Core.
Source: BitInfoCharts
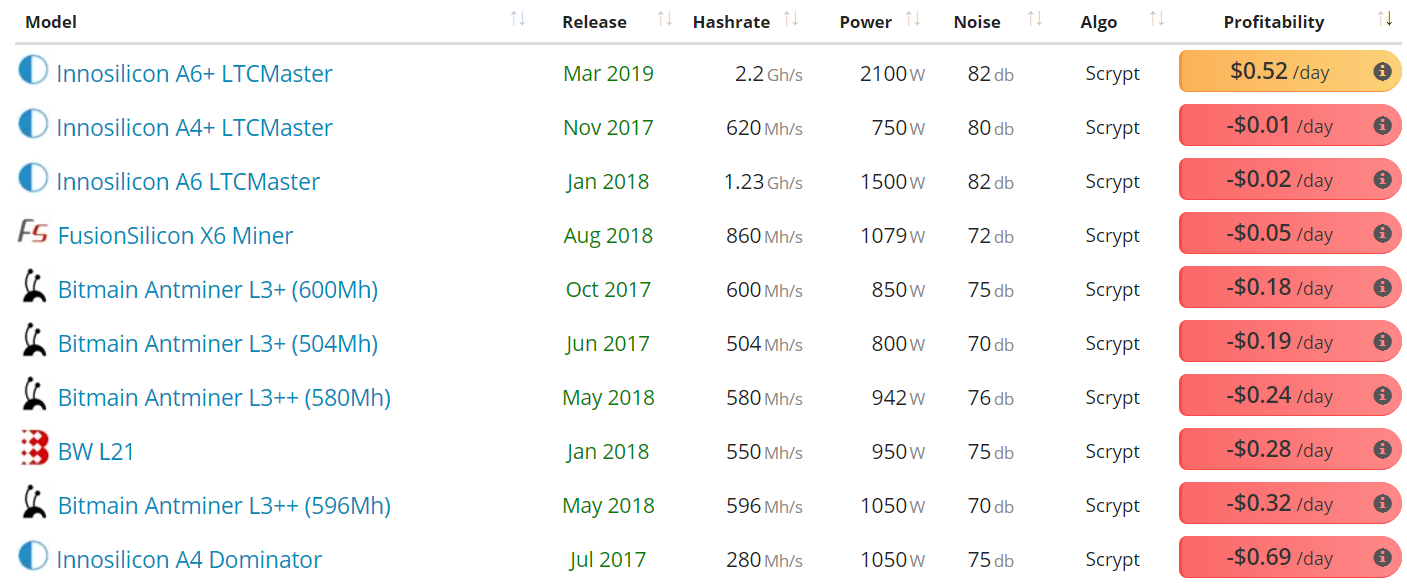
Mining profitability currently sits near all-time lows. Factors that influence mining profitability include; price, block times, difficulty, block reward, and transaction fees. Both price and difficulty have fallen dramatically since June.
Renewable energy sources around the world, including hydroelectric and geothermal power, bring electricity prices for most mining farms to US$0.04 cents/KWh or lower. Most Scrypt ASIC miners (shown below) are not profitable at an electricity cost of US$0.04 cents/KWh.
Source: asicminervalue
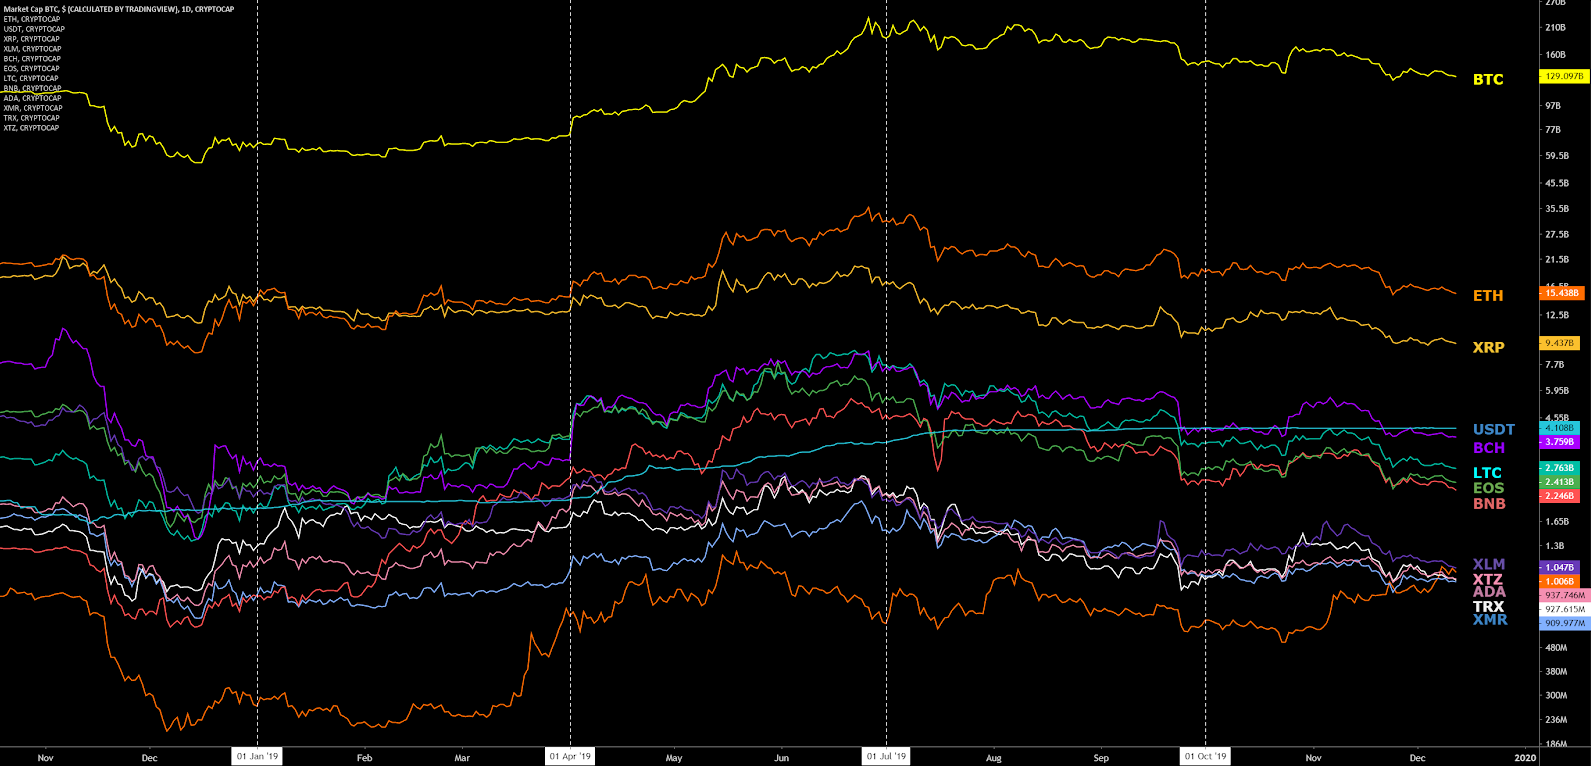
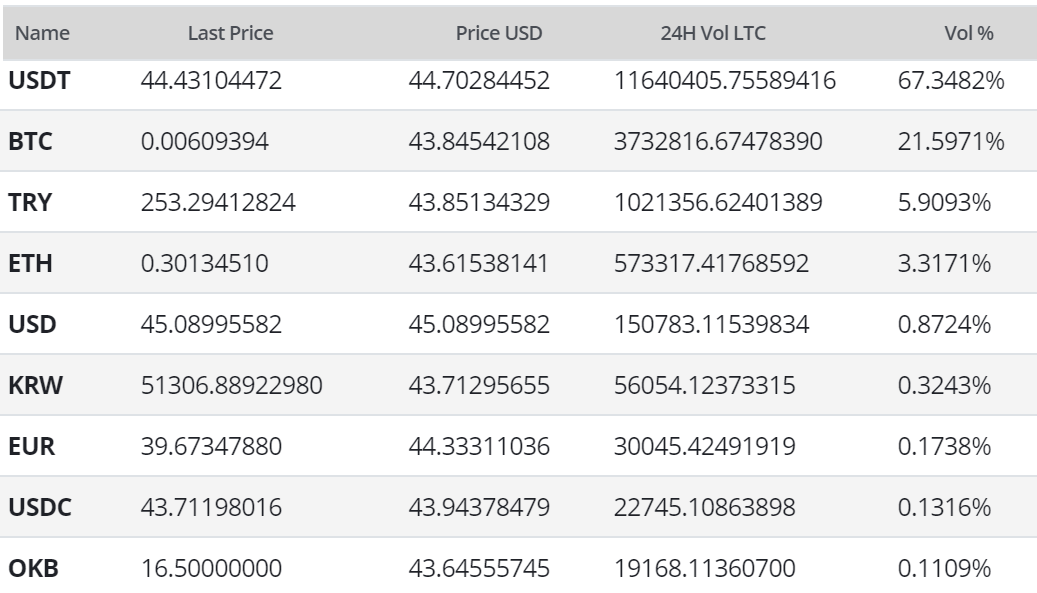
Exchange-traded volume during the past 24 hours has been predominantly led by the Tether (USDT) and Bitcoin (BTC) pairs, with the Ethereum (ETH) and U.S. Dollar (USD) pairs also providing substantial but smaller volumes. The Korean Won (KRW) and Japanese Yen (JPY) pairs hold no premium over the USDT pair.
LTC has continued to gain exchange listings, custody solutions, and exposure over the past year, including new LTC pairs on Coinbase, Poloniex, Bittrex, Gemini, CMC markets, OKEx, Binance, Binance.US, Huobi, EscoDEX, QuantaDEX, DragonEX, BTSE, Voyager, and Sofi. Litecoin.com also added a buy function with pairs in USD, EUR, and GBP, along with a logo redesign.
CoinGate and Travala.com both enabled LTC payment support for merchants and hotels, while the UK CFD exchange, FXCM, added an LTC/USD pair and LTC was added to the Coinbase Wallet. The Litecoin Foundation released an updated version of the LoafWallet at the end of October. ErisX, a CFTC-regulated Designated Contract Market, is attempting to launch LTC spot trading and a futures contract this year. Fidelity and TD Ameritrade may also launch an LTC trading product by year’s end.
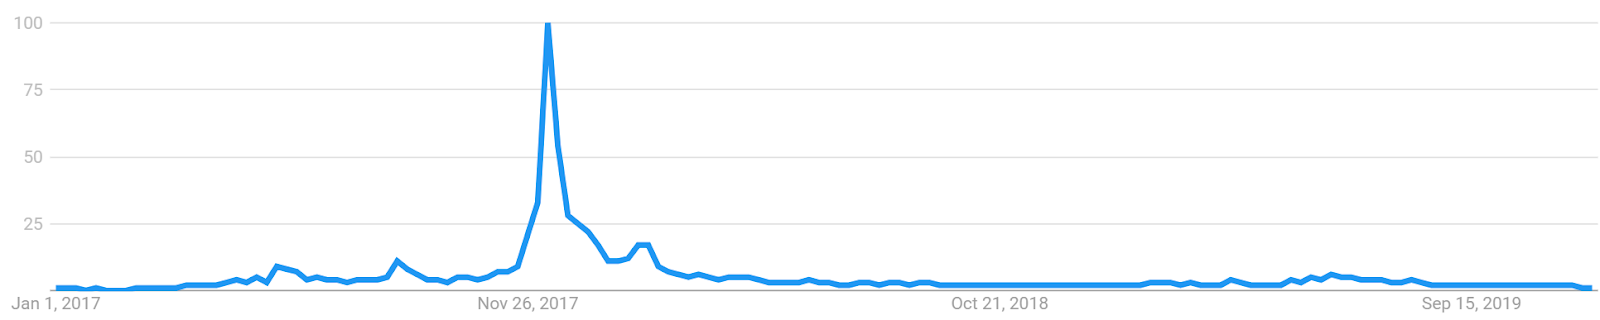
Worldwide Google Trends interest for the term "Litecoin" increased slightly in June, but has since declined by an equal magnitude. A slow rise in searches for "Litecoin" preceded the bull run in Q4 2017, likely signaling a large swath of new market participants at that time. A 2015 study found a strong correlation between the Google Trends data and Bitcoin price, while a 2017 study concluded that when the U.S. Google "Bitcoin" searches increase dramatically, Bitcoin price drops.
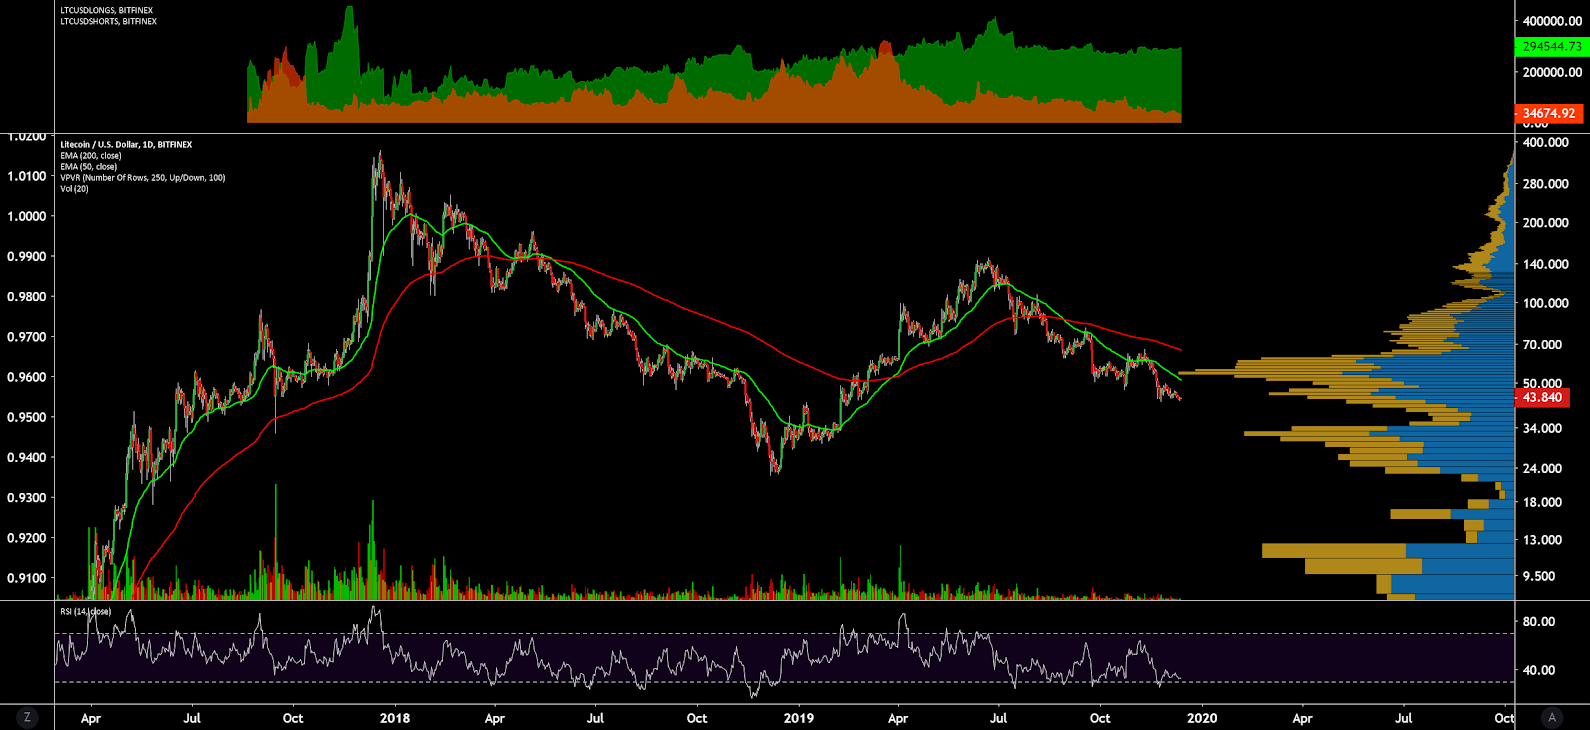
On the daily chart for the LTC/USD market, the 50-day Exponential Moving Average (EMA) and 200-day EMA crossed bearishly on August 29th, ending a 156-day bullish trend. The previous bear trend lasted over 300 days and resulted in an 80% down move.
The 200-day EMA is now above the current spot price, at US$66, and should act as resistance going forward. The Volume Profile of the Visible Range (VPVR) currently shows strong support between the US$25-US$35 range and strong resistance between the US$50-US$60 range. There is currently a small but growing bullish RSI divergence, suggesting waning bearish momentum.
Open interest on Bitfinex for the LTC/USD pair is 89% long with longs increasing slightly over the past few weeks and shorts slightly decreasing over the same time period (top panel, chart below). A significant price movement downwards will result in an exaggerated move further, as the long positions will continue to unwind. This is known as a “long squeeze.” On March 30th and 31st, shorts held a greater percentage than longs and a short squeeze occurred shortly thereafter, sending the spot price much higher very quickly.
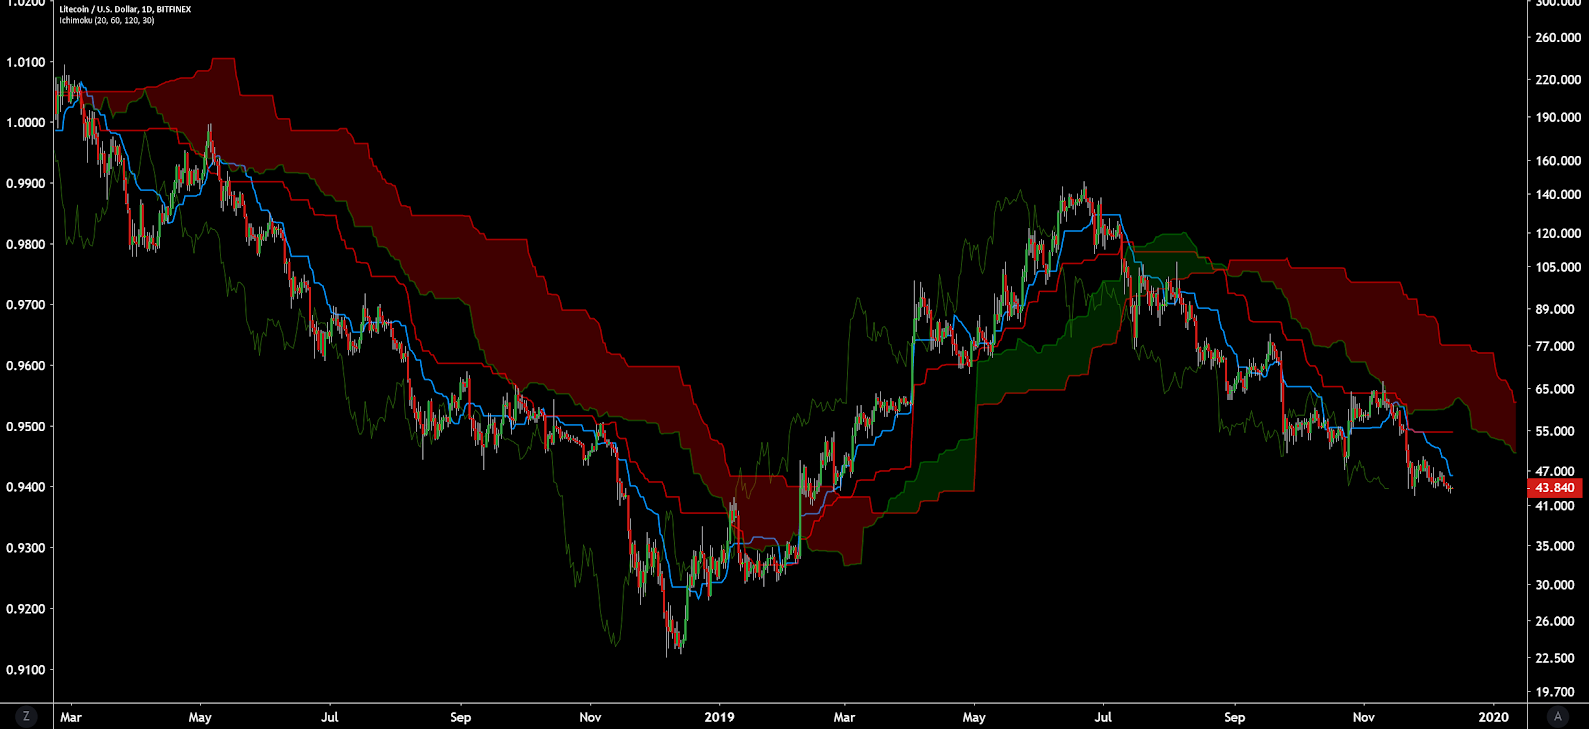
Turning to the Ichimoku Cloud, four metrics are used to determine if a trend exists; the current price in relation to the Cloud, the color of the Cloud (red for bearish, green for bullish), the Tenkan (T) and Kijun (K) cross, and the Lagging Span. The best entry always occurs when most of the signals flip from bearish to bullish, or vice versa.
Cloud metrics on the daily time frame, with doubled settings (20/60/120/30) for more accurate signals, are bearish; price is below the Cloud, the Cloud is bearish, the TK cross is bearish, and Lagging Span is below Cloud and below the current spot price. The trend will remain bearish so as long as the spot price remains below the Cloud.
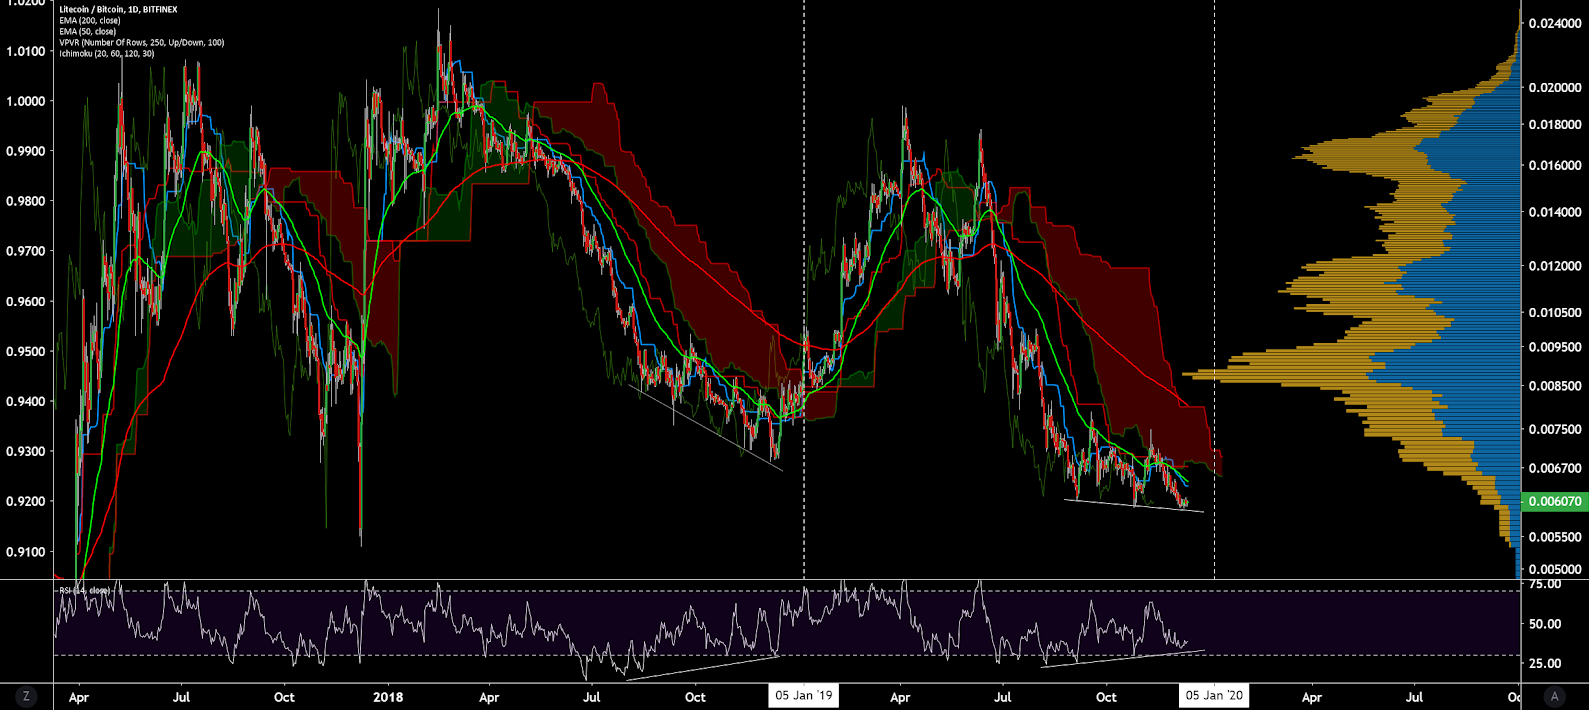
Turning to the LTC/BTC chart, this market has not been able to maintain a price above 0.02 BTC historically, but has remained above 0.005 since March 2017. The daily chart has been bearish since mid-June, with price below the 200-day EMA and remaining Cloud. There is an active and growing bullish RSI divergence, suggestive of waning bearish momentum. A similar extended bullish divergence phenomenon occurred throughout late 2018.
Based on the distance of the spot price from both the 200-day EMA, at 0.0080 BTC, and high volume VPVR node, at 0.0088 BTC, a mean reversion attempt is possible, with the market heading back to those zones. However, the previous mean reversion move to the 200-day EMA during a definitive bear trend took over 200 days. The current bear trend is on day 158.
Developer activity on the main Github repo has been nearly non-existent over the past year, although a Litecoin Improvement Protocol for Extension Blocks and MimbleWimble was recently released. Together, these changes would allow for a soft fork enabling private transactions and increased coin fungibility. However, Extension Blocks and MimbleWimble could also introduce variable consensus rules with decreased chain security, as well as hidden inflation.
Technicals for the LTC/USD pair remain bearish. Trend metrics including the 200-day EMA and Cloud show a longstanding bear trend with no imminent signs of reversal. Any bullish momentum in the near term will likely react as a mean reversion move the 200-day EMA at US$66. Significant near term support sits between US$25 to US$35, based on the historic volume profile.
Technicals for the LTC/BTC pair are also bearish. Similar to the LTC/USD pair, a mean reversion attempt between 0.0080 BTC to 0.0088 BTC is possible in the near term based on the 200-day EMA and historic volume profile. Beyond previous historic lows of 0.006 BTC - 0.007 BTC, there is very little support until the next psychological level at 0.005 BTC. A six-month bullish RSI divergence hints at waning bearish momentum, and the potential for a bullish rally in the next few months.
LTC is a Bitcoin (BTC) fork created by Charlie Lee in 2011. The network has a target block time of two minutes and 30 seconds, as opposed to Bitcoin’s 10 minutes. LTC also has a four-fold increase in the total supply, and uses a different Proof of Work consensus algorithm called Scrypt.
Charlie Lee is a former Google employee and the brother of Bobby Lee, CEO of the now-closed Chinese cryptocurrency exchange BTCC. Lee worked as an engineer at Coinbase from 2013 to 2017, where he was instrumental in spearheading the companies LTC listing.
Despite selling all of his personal LTC holdings in December 2017, Lee continues to be involved in the project’s development and attempts to increase adoption through the Litecoin Foundation, a non-profit registered in Singapore. The second-ever Litecoin summit occurred in Las Vegas at the end of October, which was headlined by Ron Paul.
Four recent partnerships established by the Foundation include; Glory kickboxing, the Miami Dolphins professional football team, the San Diego Film Festival, and Flexa, which added LTC as a method of payment for its 39,000+ merchant network. Previous partnerships include the Bibox exchange and Ternio in mid-June, which is set to issue a physical debit card allowing for direct cryptocurrency spending.
In mid-October, the Foundation released an unaudited financial statement showing net assets of US$570,000, after concerns were raised regarding the Foundation’s solvency. Lee added that “the Litecoin Foundation was started in 2017. Development happened before the foundation even existed. And development will happen even if the foundation runs out of money. This is a decentralized cryptocurrency after all.”
Turning to developer activity, the LTC project has 37 repos on GitHub. Most coins use the developer community of GitHub where files are saved in folders called "repositories," or "repos," and changes to these files are recorded with "commits," which save a record of what changes were made, when, and by who. Although commits represent quantity and not necessarily quality, a higher number of commits can signify higher dev activity and interest.
In a tweet thread, Lee addressed the growing concerns around the seemingly low level of development. He explained that the Litecoin project has only ever had a total of six core developers, who mainly merge BTC code into the LTC code. Adrian Gallagher (thrasher), one of the core developers, works on a personal branch and then merges finalized changes with the master branch at a later date. Gallagher’s personal branches are not tracked, while the final merge is.
Over the past year, there have been a cumulative 10 commits to the main GitHub repo, litecoin-project/litecoin (shown below), with no commits in the past 90 days. Compared to previous years, 2019 has seen a marked reduction in dev activity. However, Litecoin.com announced that Litecoin Core 0.18.1 has entered the final testing stage in October
Source: Github - litecoin-project/litecoin
In late October, Litecoin Improvement Protocol (LIP) 2 and 3 were published, outlining Extension Blocks and MimbleWimble, respectively.
Extension Blocks (EB) are a type of sidechain first proposed by Bitcoin developer Johnson Lau in 2013, and allow for protocol variables that differ from the main chain. Therefore, EBs can have increased block sizes or bring increased programmability and privacy without the need for a hard fork of the entire chain. Each EB is only connected to the corresponding block from the main chain, as opposed to every other block in the main chain. Criticisms of EBs include decreased backward compatibility and decreased chain security.
MimbleWimble (MW) uses zero-knowledge proofs and a specific type of transaction mixing to obscure transaction details while still allowing for transaction verification. Adding MW through EBs allows for the opt-in use of transaction privacy on the LTC chain and brings increased coin fungibility. The soft fork will be activated one year from the day the implementation is released. Miners will be able to activate the change early with at least a 75% signaling threshold. A major criticism of private transactions revolves around an inability to audit the total coin supply, allowing for the possibility of phantom inflation.
Early this month, the Litecoin Foundation announced a fund to support the development of both EB and MW. The fund has a goal of raising US$72,000, to support developer David Burkett over the next year. The fund currently has collected 157 LTC and 0.014 BTC, or nearly US$7,000.
Source: thebitcoin.pub/t/mimblewimble-the-good-and-the-bad/49971
On the network side, LTC uses SegWit (SW) enabled addresses to both decrease individual transaction size and cost, as well as increase the maximum block size to more than 1MB. SW use has increased to over 65% in the past few months and also enables transactions to be used on the Lightning Network (LN), a bi-directional, off-chain, hub-and-spoke payment channel. The LTC LN currently has 816 channels and the network capacity exceeds 188 LTC, or US$12,000.
The number of LTC transactions per day (line, chart below) has ranged from 20,000 to 40,000 since March 2018. Transactions rose substantially in December 2017 and January 2018, which was most likely in response to the expensive and delayed transactions on the BTC network. There are currently less than 500 pending LTC transactions.
The average transaction value on the network (fill, chart below) fell dramatically throughout 2018 but increased from December to July. This most recent increase also followed the December to July increase in price. Average transaction values are currently US$3,000, down substantially from a high of ~US$30,000 in November 2017.
Source: CoinMetrics
The network average block size (line, chart below) fell dramatically throughout 2018 and early 2019, and has also decreased since the block reward halving earlier this year. An average of 10MB per block currently represents a multi-year low, suggesting relatively little on-chain activity compared to the previous past two years. Historically, the average block size still remains higher than any point prior to June 2017.
The average transaction fee (fill, chart below) has fluctuated dramatically with block size, and is currently US$0.019, only 3.5% of the current BTC transaction fee. Fees spiked to nearly US$0.16 in late May, along with the spike in transactions at that time. Litecoin Core v0.17.1, released in May, lowered the default minimum transaction fee to 0.0001 LTC/kB.
Source: CoinMetrics
The 30-day Kalichkin network value to estimated on-chain daily transactions (NVT) ratio (line, chart below) is currently 100, which is well above the historic norm. An NVT below 20 would likely indicate organic and sustained bull market conditions.
Inflection points in NVT can be leading indicators of a reversal in asset value. An uptrend in NVT often suggests a coin is overvalued based on its economic activity and utility, which should be seen as a bearish price indicator, whereas a downtrend in NVT suggests the opposite.
Active and unique addresses are important to consider when determining the fundamental value of the network based on Metcalfe's law. Monthly active addresses (MAAs) have declined since January 2018 (fill, chart below), representing multi-year lows. MAAs remain well above historic levels prior to July 2017. However, LTC has far fewer MAAs than either BTC or ETH but over 10x more active addresses than Ripple (XRP).
The top 100 LTC addresses currently hold 39% of the available supply, compared to 13.5% for BTC, 33% for ETH, and 75% for XRP. Most of these top addresses are most likely exchange holdings. In November 2018, Coinbase created 40 new LTC cold storage addresses, each containing 300,000 LTC.
Source: CoinMetrics
Another crypto-native fundamental metric is the MVRV ratio, or the market cap divided by the realized cap. Realized cap approximates the value paid for all coins in existence by summing the market value of coins at the time they last moved on the blockchain.
Historically, periods of an MVRV less than 0.5 have represented oversold conditions, whereas periods of an MVRV greater than 2.5 have represented overbought conditions. Both instances of MVRV above 3.0 have represented all-time highs in price. Currently, MVRV is 0.6, which is approaching oversold territory based on network utility.
Source: CoinMetrics
Hash rate and difficulty rose substantially from mid-December to early August, with both reaching record highs. Since the block reward halving in early August, the hash rate has dropped by nearly 70%.
Of the 84 million LTC to ever exist, 76.08% have been mined. Inflation per year currently stands at 3.99% and is set to decrease to 1.80% after the next block reward halving in August 2023. The network currently has 1625 active public nodes, most of which reside in the United States and Germany. Only 44% of these nodes are running the latest version of Litecoin Core.
Source: BitInfoCharts
Mining profitability currently sits near all-time lows. Factors that influence mining profitability include; price, block times, difficulty, block reward, and transaction fees. Both price and difficulty have fallen dramatically since June.
Renewable energy sources around the world, including hydroelectric and geothermal power, bring electricity prices for most mining farms to US$0.04 cents/KWh or lower. Most Scrypt ASIC miners (shown below) are not profitable at an electricity cost of US$0.04 cents/KWh.
Source: asicminervalue
Exchange-traded volume during the past 24 hours has been predominantly led by the Tether (USDT) and Bitcoin (BTC) pairs, with the Ethereum (ETH) and U.S. Dollar (USD) pairs also providing substantial but smaller volumes. The Korean Won (KRW) and Japanese Yen (JPY) pairs hold no premium over the USDT pair.
LTC has continued to gain exchange listings, custody solutions, and exposure over the past year, including new LTC pairs on Coinbase, Poloniex, Bittrex, Gemini, CMC markets, OKEx, Binance, Binance.US, Huobi, EscoDEX, QuantaDEX, DragonEX, BTSE, Voyager, and Sofi. Litecoin.com also added a buy function with pairs in USD, EUR, and GBP, along with a logo redesign.
CoinGate and Travala.com both enabled LTC payment support for merchants and hotels, while the UK CFD exchange, FXCM, added an LTC/USD pair and LTC was added to the Coinbase Wallet. The Litecoin Foundation released an updated version of the LoafWallet at the end of October. ErisX, a CFTC-regulated Designated Contract Market, is attempting to launch LTC spot trading and a futures contract this year. Fidelity and TD Ameritrade may also launch an LTC trading product by year’s end.
Worldwide Google Trends interest for the term "Litecoin" increased slightly in June, but has since declined by an equal magnitude. A slow rise in searches for "Litecoin" preceded the bull run in Q4 2017, likely signaling a large swath of new market participants at that time. A 2015 study found a strong correlation between the Google Trends data and Bitcoin price, while a 2017 study concluded that when the U.S. Google "Bitcoin" searches increase dramatically, Bitcoin price drops.
Technical Analysis
Although LTC outperformed most cryptocurrencies and assets early in the year, the block reward halving in August 2015 led to a nearly 600 day period of ranging price action. A roadmap for potential trend changes can be deduced using Exponential Moving Averages, Volume Profile of the Visible Range, and the Ichimoku Cloud. Further background information on the technical indicators discussed below can be found here.On the daily chart for the LTC/USD market, the 50-day Exponential Moving Average (EMA) and 200-day EMA crossed bearishly on August 29th, ending a 156-day bullish trend. The previous bear trend lasted over 300 days and resulted in an 80% down move.
The 200-day EMA is now above the current spot price, at US$66, and should act as resistance going forward. The Volume Profile of the Visible Range (VPVR) currently shows strong support between the US$25-US$35 range and strong resistance between the US$50-US$60 range. There is currently a small but growing bullish RSI divergence, suggesting waning bearish momentum.
Open interest on Bitfinex for the LTC/USD pair is 89% long with longs increasing slightly over the past few weeks and shorts slightly decreasing over the same time period (top panel, chart below). A significant price movement downwards will result in an exaggerated move further, as the long positions will continue to unwind. This is known as a “long squeeze.” On March 30th and 31st, shorts held a greater percentage than longs and a short squeeze occurred shortly thereafter, sending the spot price much higher very quickly.
Turning to the Ichimoku Cloud, four metrics are used to determine if a trend exists; the current price in relation to the Cloud, the color of the Cloud (red for bearish, green for bullish), the Tenkan (T) and Kijun (K) cross, and the Lagging Span. The best entry always occurs when most of the signals flip from bearish to bullish, or vice versa.
Cloud metrics on the daily time frame, with doubled settings (20/60/120/30) for more accurate signals, are bearish; price is below the Cloud, the Cloud is bearish, the TK cross is bearish, and Lagging Span is below Cloud and below the current spot price. The trend will remain bearish so as long as the spot price remains below the Cloud.
Turning to the LTC/BTC chart, this market has not been able to maintain a price above 0.02 BTC historically, but has remained above 0.005 since March 2017. The daily chart has been bearish since mid-June, with price below the 200-day EMA and remaining Cloud. There is an active and growing bullish RSI divergence, suggestive of waning bearish momentum. A similar extended bullish divergence phenomenon occurred throughout late 2018.
Based on the distance of the spot price from both the 200-day EMA, at 0.0080 BTC, and high volume VPVR node, at 0.0088 BTC, a mean reversion attempt is possible, with the market heading back to those zones. However, the previous mean reversion move to the 200-day EMA during a definitive bear trend took over 200 days. The current bear trend is on day 158.
Conclusion
Fundamentals show on-chain activity continuing to slow over the past few months. Both NVT and MVRV show no warning signs of immediate bearish continuation, but NVT remains well-above historic highs, again suggesting decreased on-chain utility compared to previous periods. Hash rate reached a plateau leading into the August halving and is now experiencing a nearly 70% reduction, as mining profitability remains at all-time lows.Developer activity on the main Github repo has been nearly non-existent over the past year, although a Litecoin Improvement Protocol for Extension Blocks and MimbleWimble was recently released. Together, these changes would allow for a soft fork enabling private transactions and increased coin fungibility. However, Extension Blocks and MimbleWimble could also introduce variable consensus rules with decreased chain security, as well as hidden inflation.
Technicals for the LTC/USD pair remain bearish. Trend metrics including the 200-day EMA and Cloud show a longstanding bear trend with no imminent signs of reversal. Any bullish momentum in the near term will likely react as a mean reversion move the 200-day EMA at US$66. Significant near term support sits between US$25 to US$35, based on the historic volume profile.
Technicals for the LTC/BTC pair are also bearish. Similar to the LTC/USD pair, a mean reversion attempt between 0.0080 BTC to 0.0088 BTC is possible in the near term based on the 200-day EMA and historic volume profile. Beyond previous historic lows of 0.006 BTC - 0.007 BTC, there is very little support until the next psychological level at 0.005 BTC. A six-month bullish RSI divergence hints at waning bearish momentum, and the potential for a bullish rally in the next few months.
OhNoCrypto
via https://www.ohnocrypto.com
Josh Olszewicz, Khareem Sudlow