
NEO Price Analysis - On-chain transaction volume spikes
NEO (NEO) is a decentralized smart contract network which is currently 19th on the BraveNewCoin market cap table. NEO is down 96% from the record high established in January 2018, with a current market cap of US$749 million, and a total of US$212 million in trade volume over the past 24 hours.
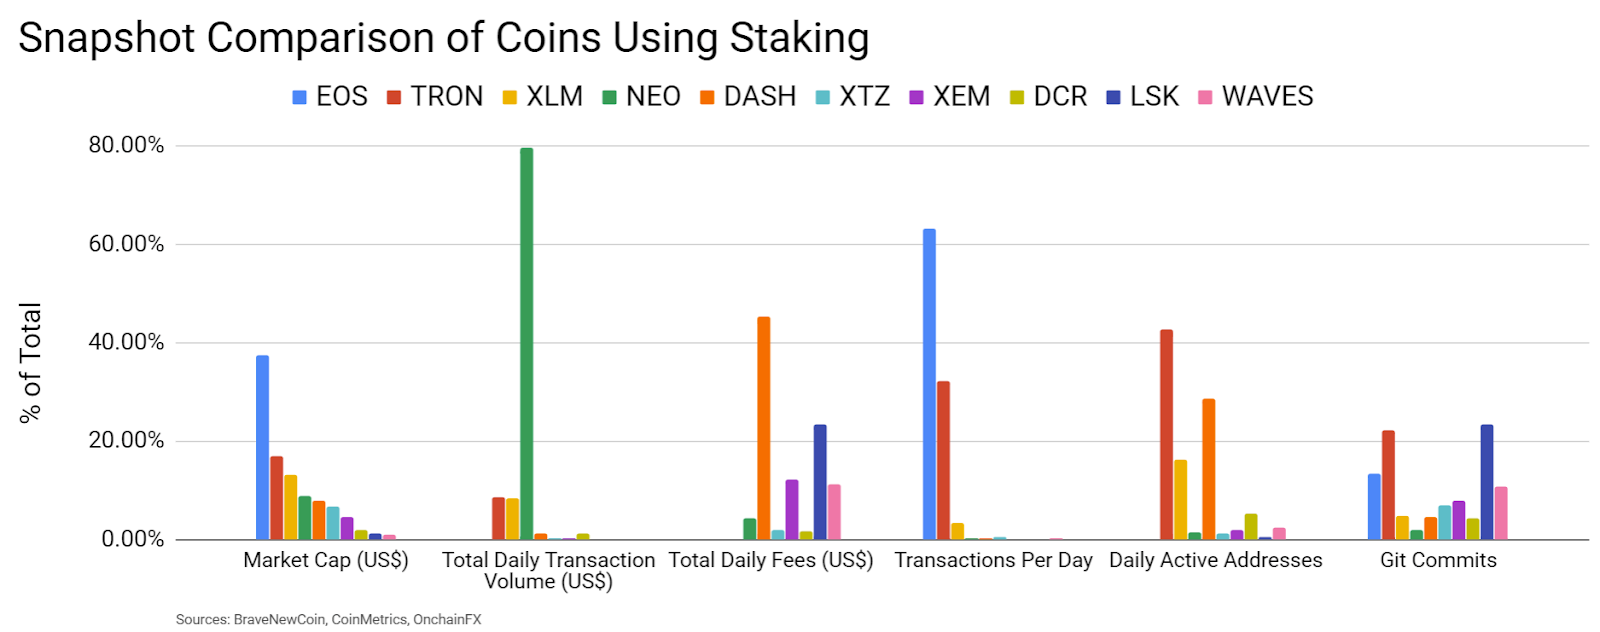
A quick comparison between coins using similar consensus mechanisms shows that NEO is in the middle of the pack of the metrics shown below, except for total daily transaction volume. Reliable on-chain transaction volume data or active addresses for EOS (EOS) could not be obtained. Lisk (LSK) leads in Github activity while NEO lags its peers by this metric.
The NEO project was previously known as Antshares and founded by Da Hongfei and Erik Zhang. The project was touted as the “Ethereum of China.” An Initial Coin Offering (ICO) was run from August 8th to September 7th, 2016, which raised US$97,517 and 8,169 BTC. The ICO created 100 million NEO tokens, with 50% split between the crowdfund participants and 50% distributed to the NEO Council (now the NEO Foundation).
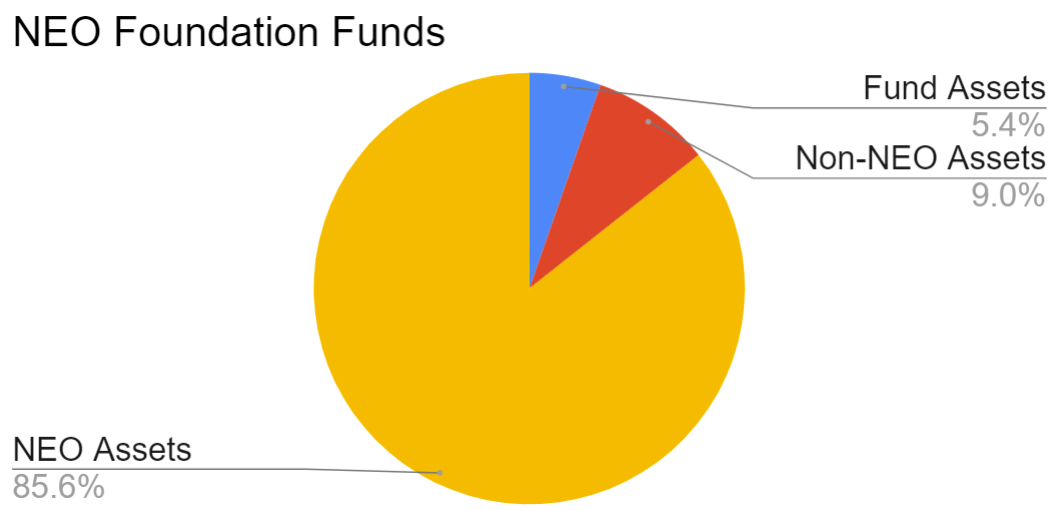
The Foundation released a financial report in June 2019 revealing holdings of US$871 million, including; NEO assets, non-NEO assets, and a fund. NEO assets account for 43,664,133 NEO tokens, currently US$487 million, which is just under 44% of the assets total supply. The non-NEO assets held by the Foundation include BTC, ETH, ONT, ONG, USD, and CNY, accounting for US$78.62 million. Fund assets include 4,313 BTC, which is currently equivalent to US$40 million.
NEO uses Delegated Byzantine Fault Tolerant (dBFT) for consensus, which yields 15-20 second block times. The network nodes are separated into two categories: consensus nodes and user nodes. There are currently seven consensus nodes, five of which are run by the NEO Foundation. The Foundation has plans to decentralize these nodes.
The nodes are delegated by the network and earn a cryptocurrency called GAS through the block reward. Other nodes are simply users of the network. User nodes can earn GAS by holding NEO in a wallet, a process similar to staking. NEO GAS is used to interact with the network and is comparable to Ethereum GAS and EOS RAM.
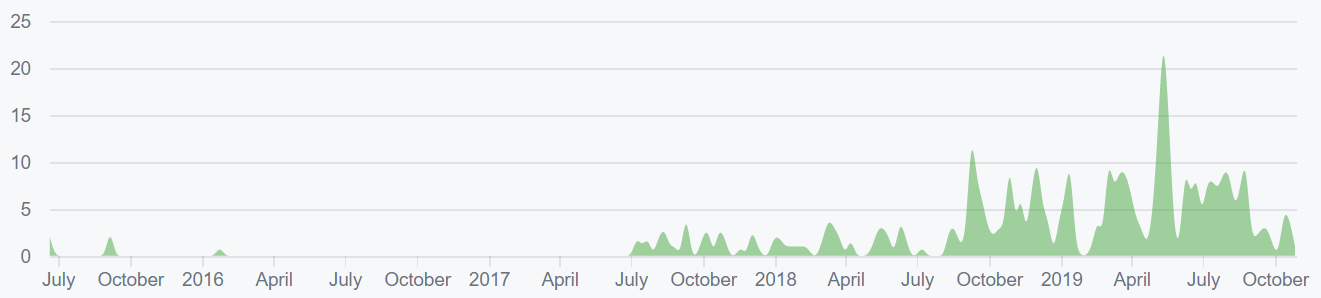
On the development side, There are 16 NEO repositories on Github with 269 commits in the main repo over the past year, mostly from Erik Zhang. The majority of projects in the crypto industry use the developer community of GitHub, where files are saved in folders called "repositories," or "repos," and changes to these files are recorded with "commits," which save a record of what changes were made, when, and by who. Although commits represent quantity and not necessarily quality, a higher number of commits can signify higher dev activity and interest.
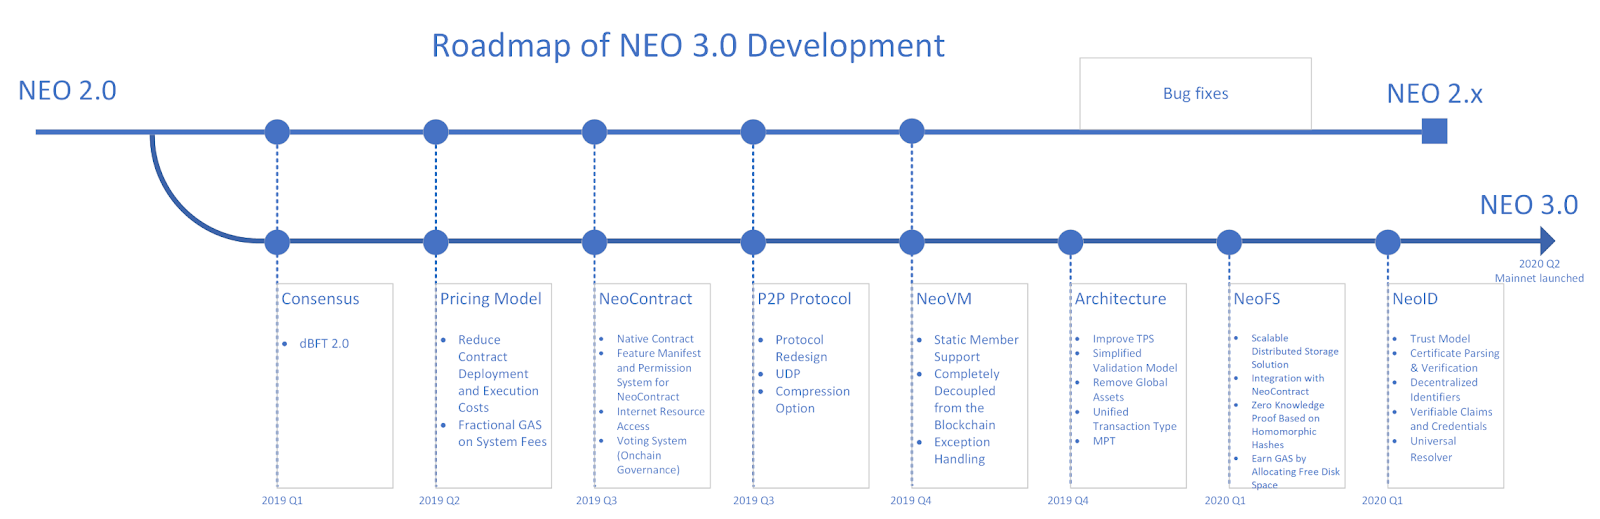
In April, NEO revealed a roadmap of network upgrades leading into 2020, which is aimed at alleviating longstanding network issues and improving network efficiency. The upgrades are also designed to expand the smart contract ecosystem by reducing deployment and execution costs. The network upgraded to dBFT 2.0 in May, wich provides improved network stability and adjusted the network fee mechanism.
Thus far, NEO smart contracts have had a tough start. In October 2018, smart contract audits found major code vulnerabilities in NEO NEP-5 contracts, which are most commonly used for ICOs on the NEO network. One flaw allowed users to artificially add to the total supply of a major NEO project, Deepbrain chain, by transferring their tokens to an unspecified address. In a bid to bolster the NEO ecosystem, Hongfei announced a US$100 million funding initiative in mid-May, designed to help Decentralized Applications (dApps) and infrastructure development.
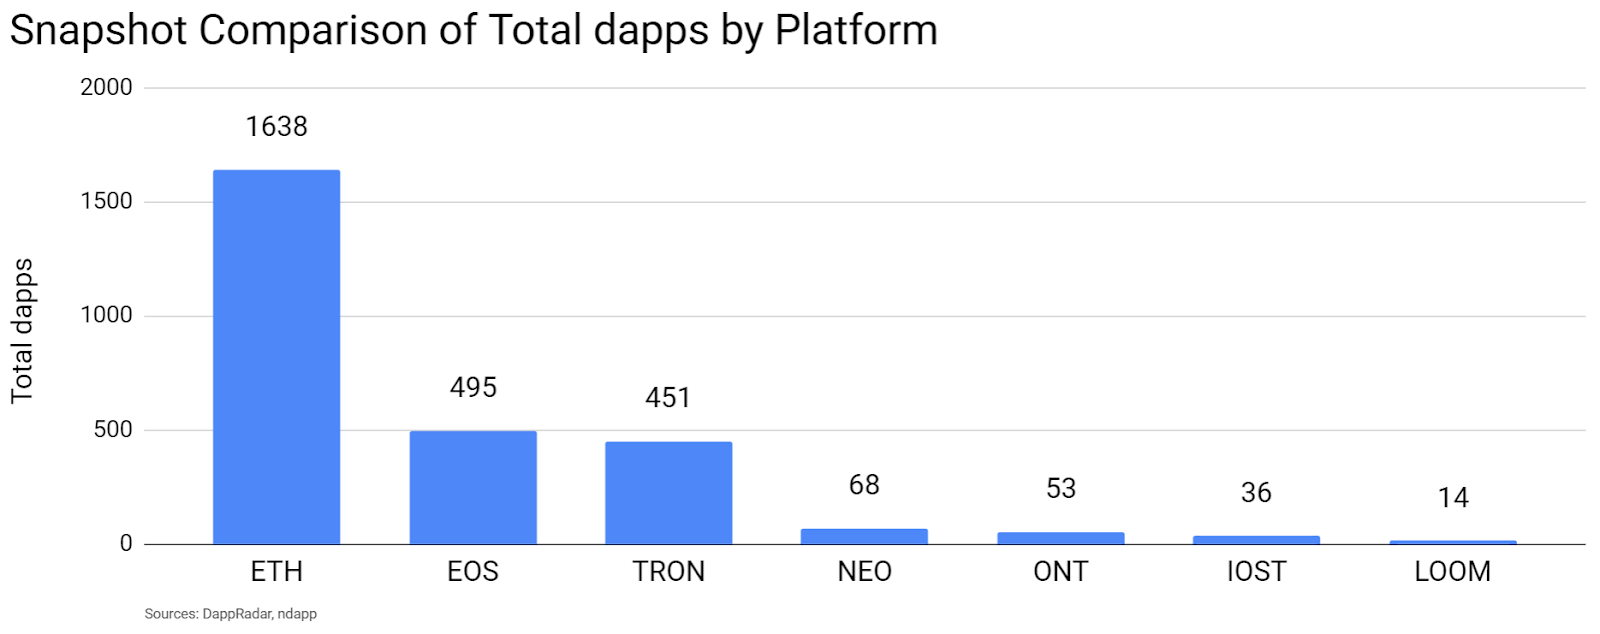
In contrast to other dApp platforms Ethereum (ETH), EOS (EOS), Tronix (TRX), Ontology (ONT), IOST (IOST), and LOOM (LOOM), the NEO dApp ecosystem has struggled to bring any highly successful projects to market thus far. Funding on each platform for dAppsshows that NEO is heavily lagging ETH, EOS, and TRX. However, the majority of dApps on any platform have very little user activity. The most popular across these various platforms are either gambling or exchange related.
On-chain metrics reveal the number of NEO transactions per day (line, chart below) has risen substantially over the past few weeks, which correlates with both the NEO protocol upgrades and an announcement by the President of China, Xi Jinping, in support of blockchain technology. The average transaction value (fill, chart below) in recent months has ranged from US$10,000 to US$28,000.
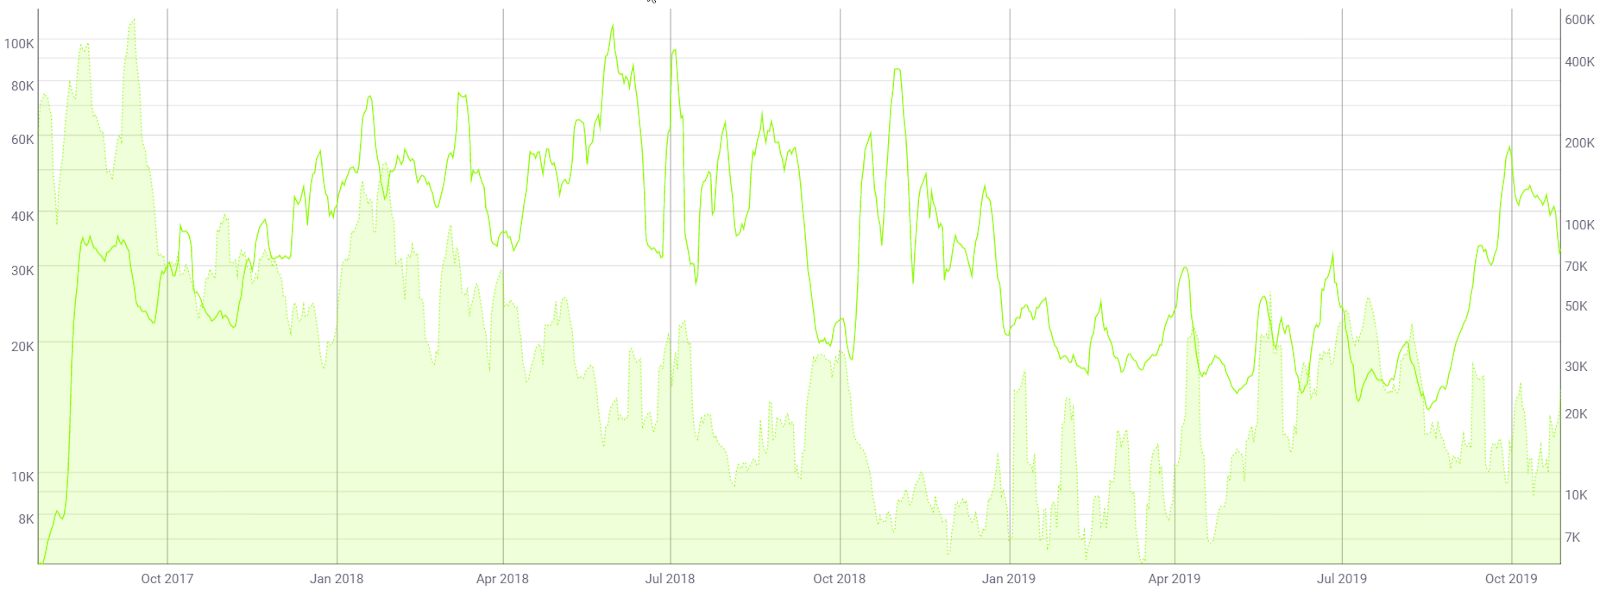
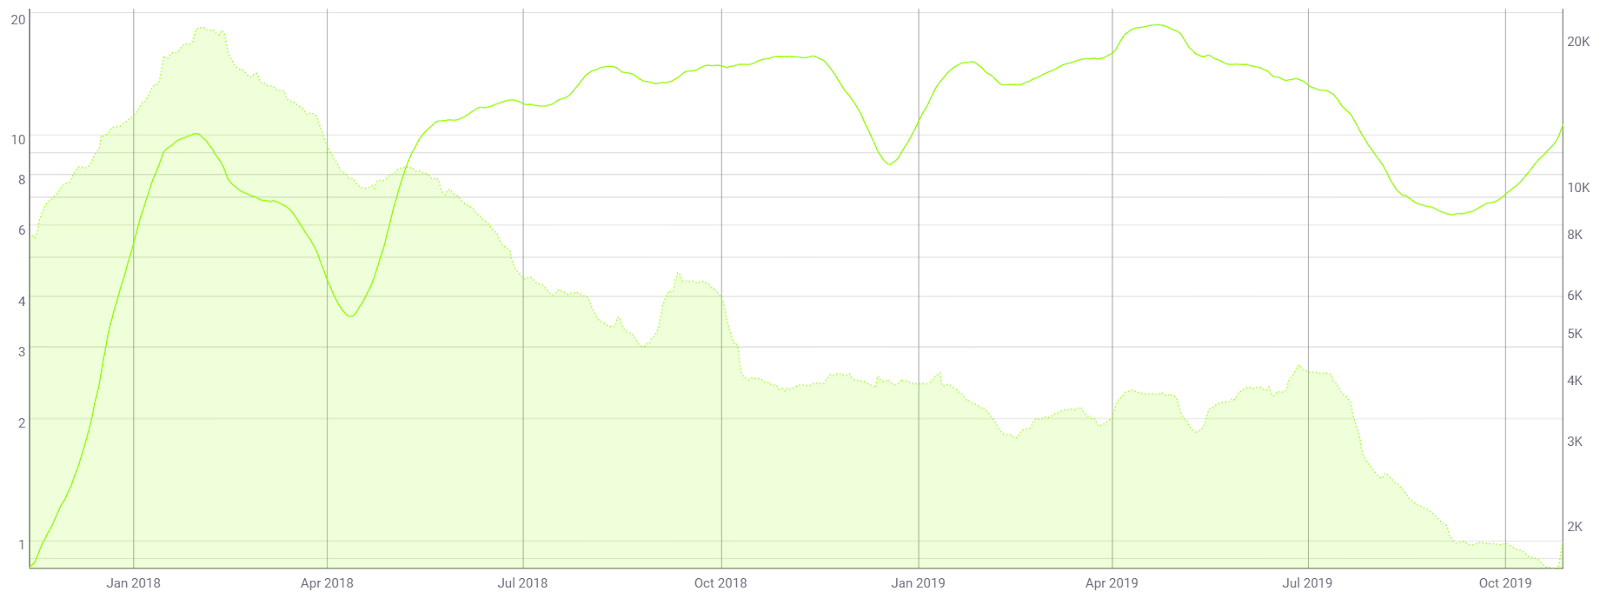
The 30-day Kalichkin network value to estimated on-chain daily transactions (NVT) ratio (line, chart below) is currently 10.6 and rising, which is near the middle of the historic norm. An NVT below 4.0 would likely indicate organic and sustained bull market conditions.
Inflection points in NVT can be leading indicators of a reversal in asset value. An uptrend in NVT often suggests a coin is overvalued based on its economic activity and utility, which should be seen as a bearish price indicator, whereas a downtrend in NVT suggests the opposite.
Active and unique addresses are also important to consider, specifically when determining the fundamental value of the network based on Metcalfe's law. Monthly active addresses (MAAs) have declined since February 2018 (fill, chart below), and now sit at a multi-year low. A consistent and sustained decrease in MAAs paints a bearish picture for any asset. This week, daily active addresses spiked to just over 5,000, the highest level since late June.
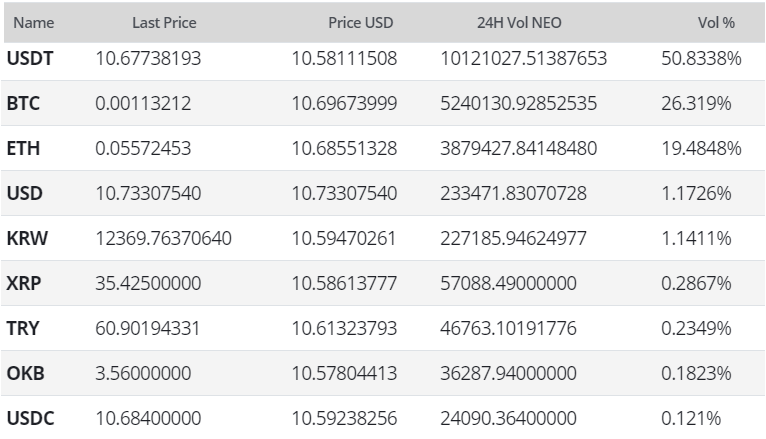
NEO exchange-traded volume has been led by Tether (USDT), Bitcoin (BTC), and Ethereum (ETH). NEO trading is available on Binance, Bitfinex, Bittrex, HitBTC, Huobi, and OKEx but the asset is not currently listed on Coinbase, Gemini, Kraken, or Poloniex. NEO is also on the shortlist for a Binance.US listing. NEO hardware wallet functionality is available on Ledger but not Trezor.
Technical Analysis
NEO has seen an increase in speculative interest after an announcement from the President of China, Xi Jinping, in support of blockchain technology. As market values head into a potential bullish reversal, exponential moving averages (EMAs), divergences, the Volume Profile of the Visible Range, and the Ichimoku Cloud can help highlight any potential bullish trend reversal. Further background information on the technical analysis discussed below can be found here.
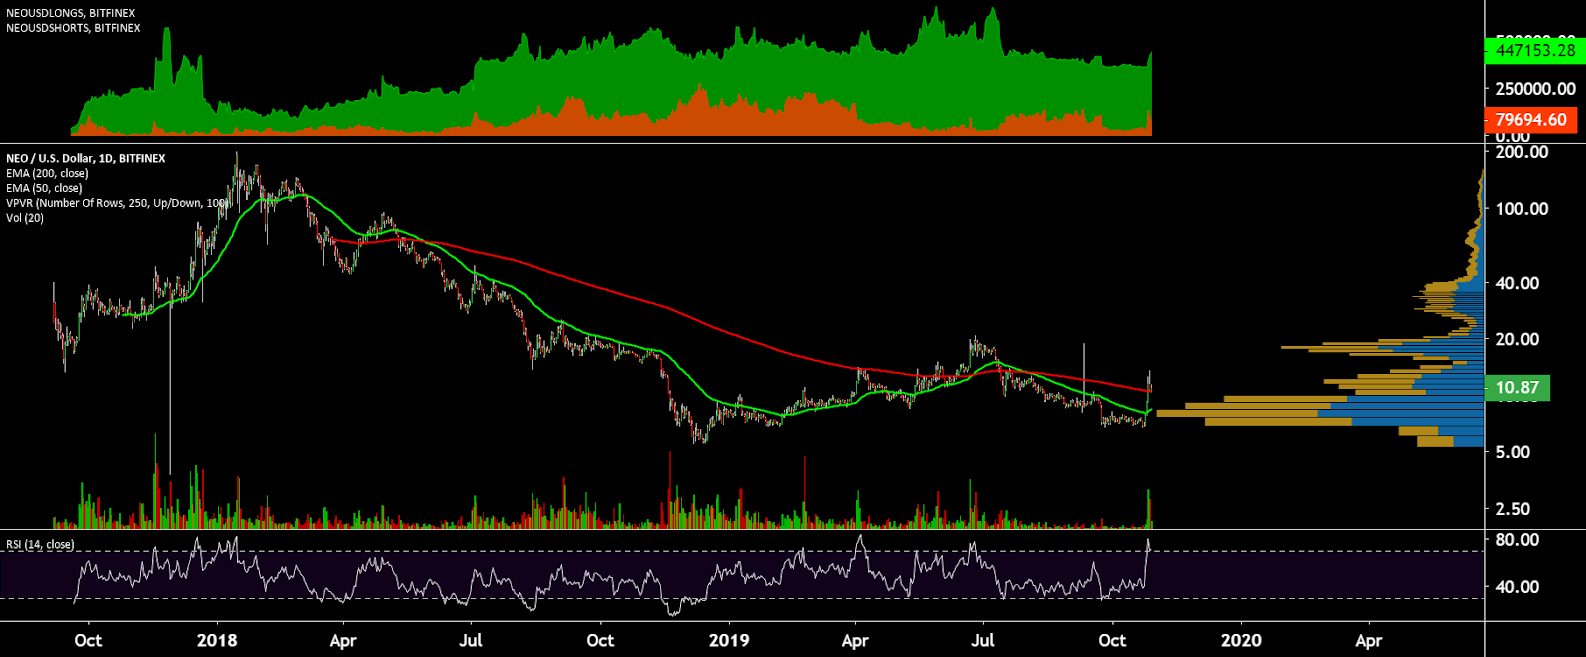
On the daily chart for the NEO/USD pair, the 50-day Exponential Moving Average (EMA) and 200-day EMA crossed bearishly in early August, resuming the previous bear trend that lasted almost 400 days. A bullish Golden Cross may occur over the next few weeks, which would suggest further upside strength and a definitive trend reversal.
Volume Profile of the Visible Range (VPVR) shows substantial volume in the US$6.50-US$10.00 range. Upside VPVR resistance sits at US$18, with much less volume above this zone. There are no active volume or RSI divergences currently.
Long/short open interest on Bitfinex (top panel, chart below) is currently heavily net long, with both longs and shorts rising over the past week. A significant price movement downwards will result in an exaggerated move as the long positions will begin to unwind. This is known as a "long squeeze."
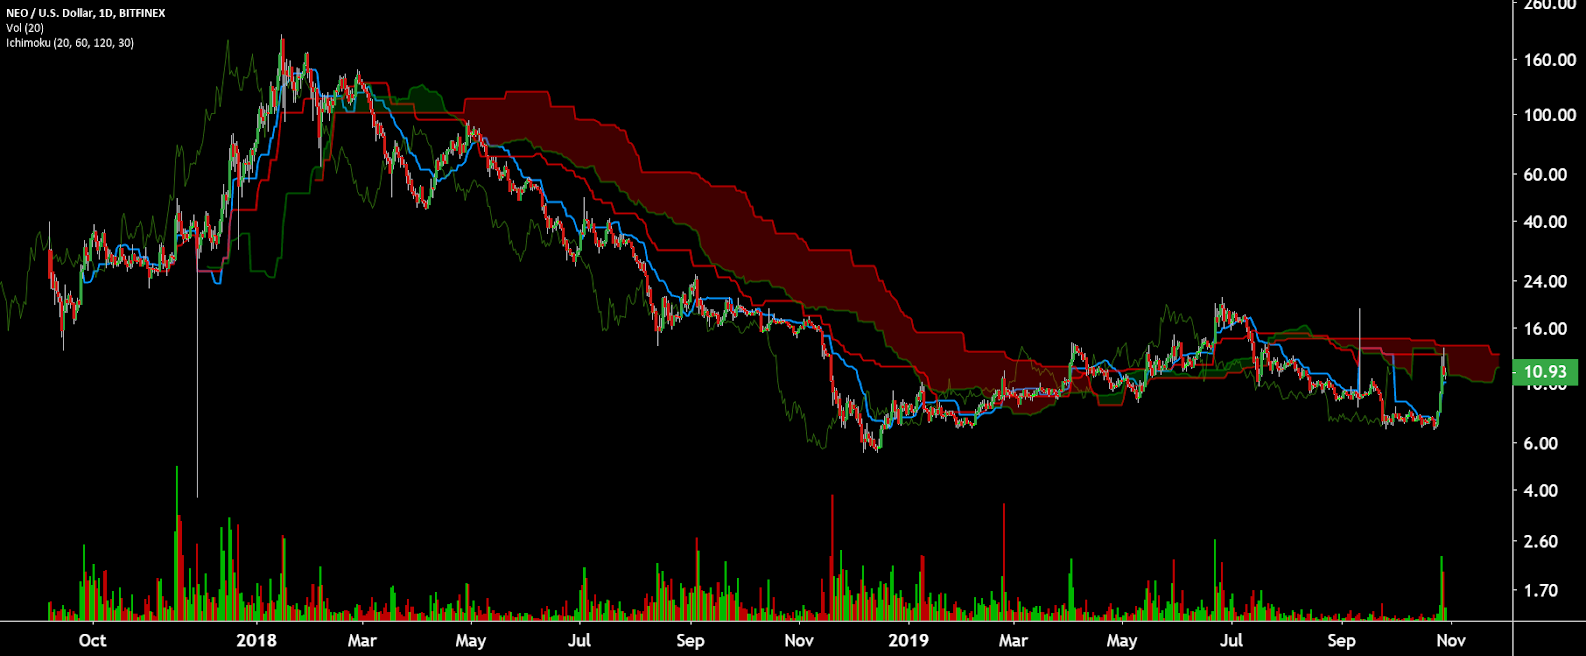
Turning to the Ichimoku Cloud, four metrics are used to determine if a trend exists; the current price in relation to the Cloud, the color of the Cloud (red for bearish, green for bullish), the Tenkan (T) and Kijun (K) cross, and the Lagging Span. The best entry always occurs when most of the signals flip from bearish to bullish, or vice versa.
Cloud metrics on the daily time frame, with doubled settings (20/60/120/30) for more accurate signals, are all bearish; price is below the Cloud, the Cloud is bearish but has almost twisted bullish, the TK cross is bearish, and the Lagging Span is below Cloud and above price. A traditional long entry will not trigger until price returns above the Cloud.
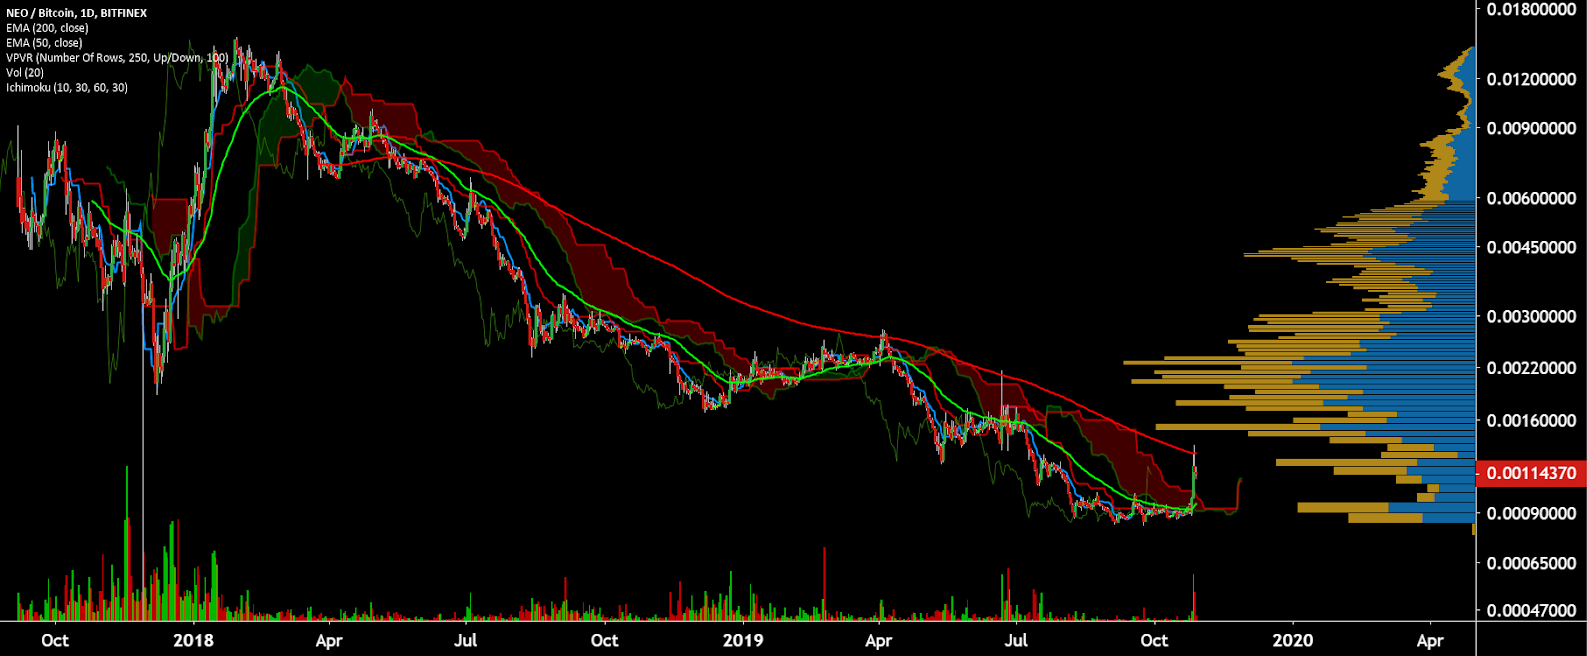
Lastly, on the NEO/BTC pair, trend indicators show the beginnings of a bull trend as the current spot price has breached the Cloud and hit resistance at the 200-day EMA. Since 2018, NEO/BTC has only had two bullish Kumo breakouts, the last occurring in February 2019. VPVR (horizontal bars) suggests significant upside resistance from 0.0015 - 0.0030 BTC. Over the next few weeks, the probability for a bullish 50/200 EMA cross increases if price remains at or above the 200-day EMA.
Conclusion
As NEO continues a transition period towards NEO 3.0, on-chain metrics have risen slightly in the setting of China’s recent embrace of blockchain technology. Comparing NEO to other similar chains reveals weaknesses in almost every metric observed except for on-chain transaction volume, which has spiked significantly. In its current state, NEO appears to be much farther behind its smart contract competitors while maintaining high levels of centralization. However, the NEO project has plans to implement decentralized consensus nodes and will likely continue to easily sustain itself due to the well-funded NEO Foundation.
Technicals for the NEO/USD pair reveal a strong likelihood of an early bullish trend reversal as price begins to test both the 200-day EMA and the Cloud. Over the next few months, a move towards US$18 is likely if a Golden Cross occurs. Based on the historic volume profile, additional upside past US$18 will likely require a further consolidation period. Technicals for the NEO/BTC pair also show signs of bullish momentum as the spot price has broken above the Cloud and reached the 200-day EMA. Unlike the NEO/USD pair, the NEO/BTC pair shows significant upside resistance based on the historic volume profile. Unless sustained and significant buying volume occurs, NEO/BTC is unlikely to break above the 0.0015 - 0.0030 BTC any time in the near future.
OhNoCrypto
via https://www.ohnocrypto.com
Josh Olszewicz, Khareem Sudlow