
Bitcoin (BTC) Price Trading Near Make-or-Break Levels
- Bitcoin price is declining and struggling to stay above the $9,000 support against the US Dollar.
- The price is could correct higher, but it might face resistance near the $9,200 and $9,300 levels.
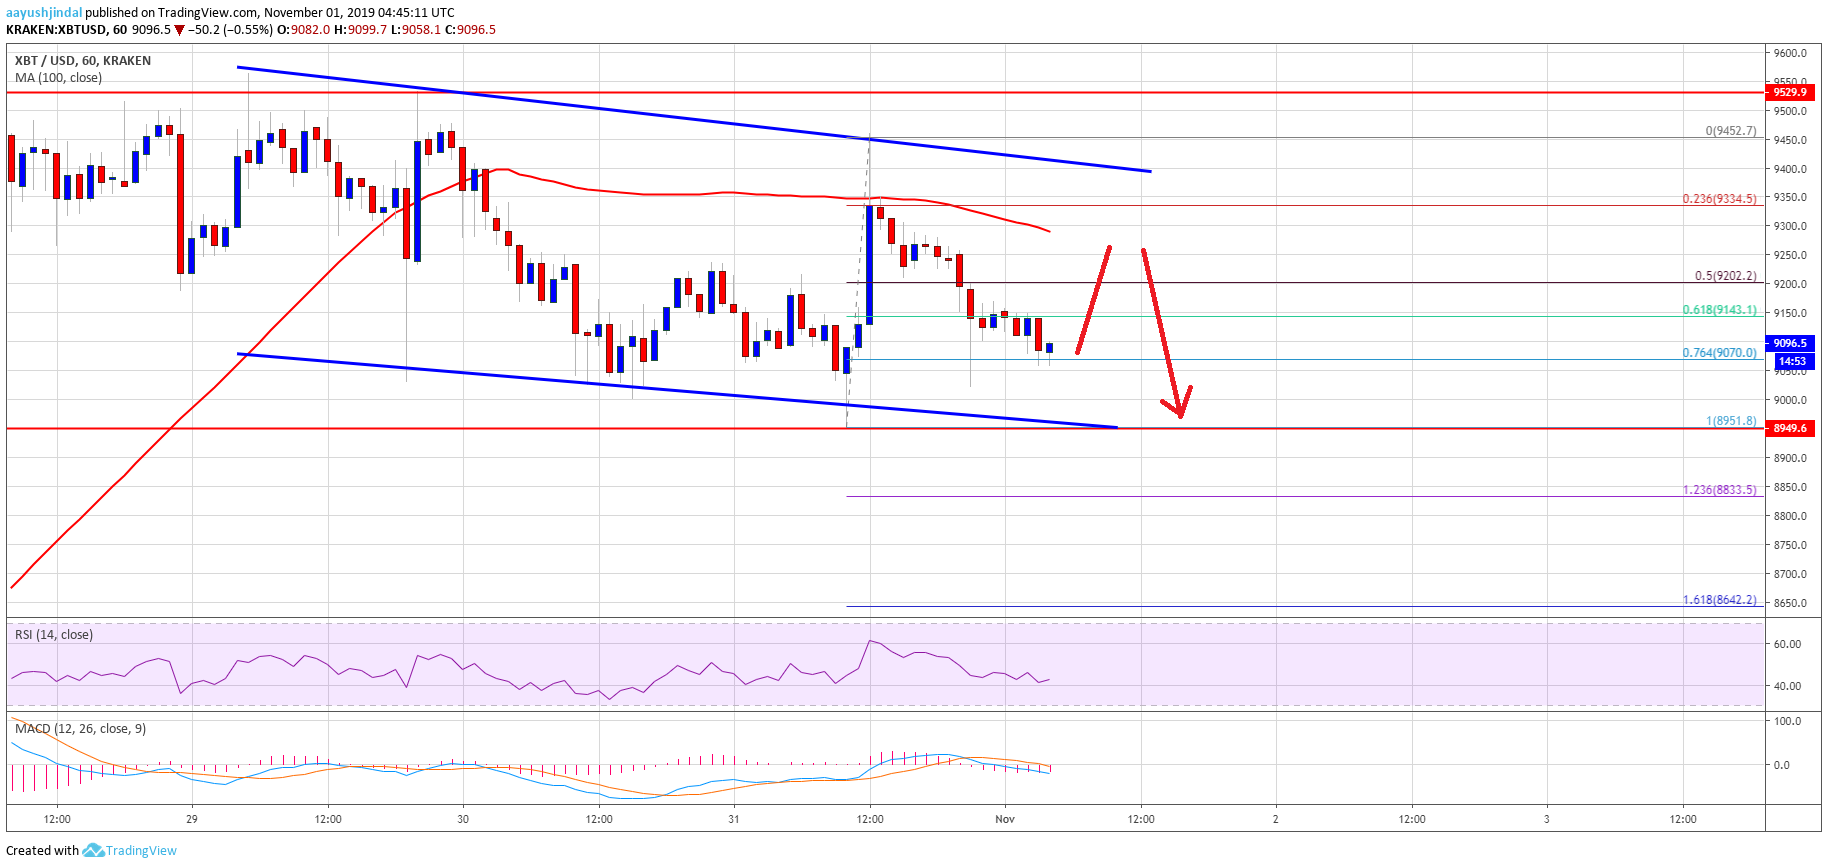
- There is a declining channel forming with resistance near $9,400 on the hourly chart of the BTC/USD pair (data feed from Kraken).
- Both Ethereum and ripple are showing a few bearish signs below $185 and $0.2950 respectively.
Bitcoin price is struggling to start a fresh increase above $9,400 against the US Dollar. Therefore, there is a risk of another drop below the $9,000 support in the near term.
Bitcoin Price Analysis
After struggling near the $9,500 resistance, bitcoin started a steady decline against the US Dollar. BTC traded below a couple of key supports near the $9,400 and $9,320 levels.
Moreover, there was a break below the $9,200 support and the 100 hourly simple moving average. The price even spiked below the $9,000 support area and traded to a new weekly low near the $8,951 level.
Recently, there was an upside correction above the $9,250 level. Besides, the price climbed above the $9,300 resistance, but it failed to gain momentum above $9,400. A high was formed near $9,452 and the price is currently declining.
There was a break below the $9,200 support, plus the 50% Fib retracement level of the upward move from the $8,951 low to $9,452 high. At the outset, bitcoin price is testing the $9,080 support area.
It seems like the 76.4% Fib retracement level of the upward move from the $8,951 low to $9,452 high is acting as a decent support. However, the main support is near the $9,000 level, below which there is a risk of an extended decline towards the $8,950 and $8,830 levels.
On the upside, there are many hurdles near the $9,200 and $9,300 levels. More importantly, the 100 hourly simple moving average is also near the $9,300 level to act as a hurdle.
Finally, there is a declining channel forming with resistance near $9,400 on the hourly chart of the BTC/USD pair. Therefore, the price must climb above $9,300 and $9,400 to start a strong rise in the near term.
Bitcoin Price
Looking at the chart, bitcoin is showing a few bearish signs below $9,200 and $9,300. It seems like there could be another bearish reaction below the $9,000 support. On the upside, the $9,300 level now holds the key for a fresh upward move.
Technical indicators:
Hourly MACD – The MACD is slowly moving into the bullish zone.
Hourly RSI (Relative Strength Index) – The RSI for BTC/USD is currently moving higher and it could climb to 50.
Major Support Levels – $9,000 followed by $8,830.
Major Resistance Levels – $9,200, $9,300 and $9,400.
The post Bitcoin (BTC) Price Trading Near Make-or-Break Levels appeared first on NewsBTC.
OhNoCrypto
via https://www.ohnocrypto.com
Aayush Jindal, Khareem Sudlow