
XRP Price Technical Analysis on One Day Chart
- XRP trades within ascending channel on 1 Day Chart
- Liquidity above resistance
- Possible move to $0.40
1 Day XRP/USD price chart
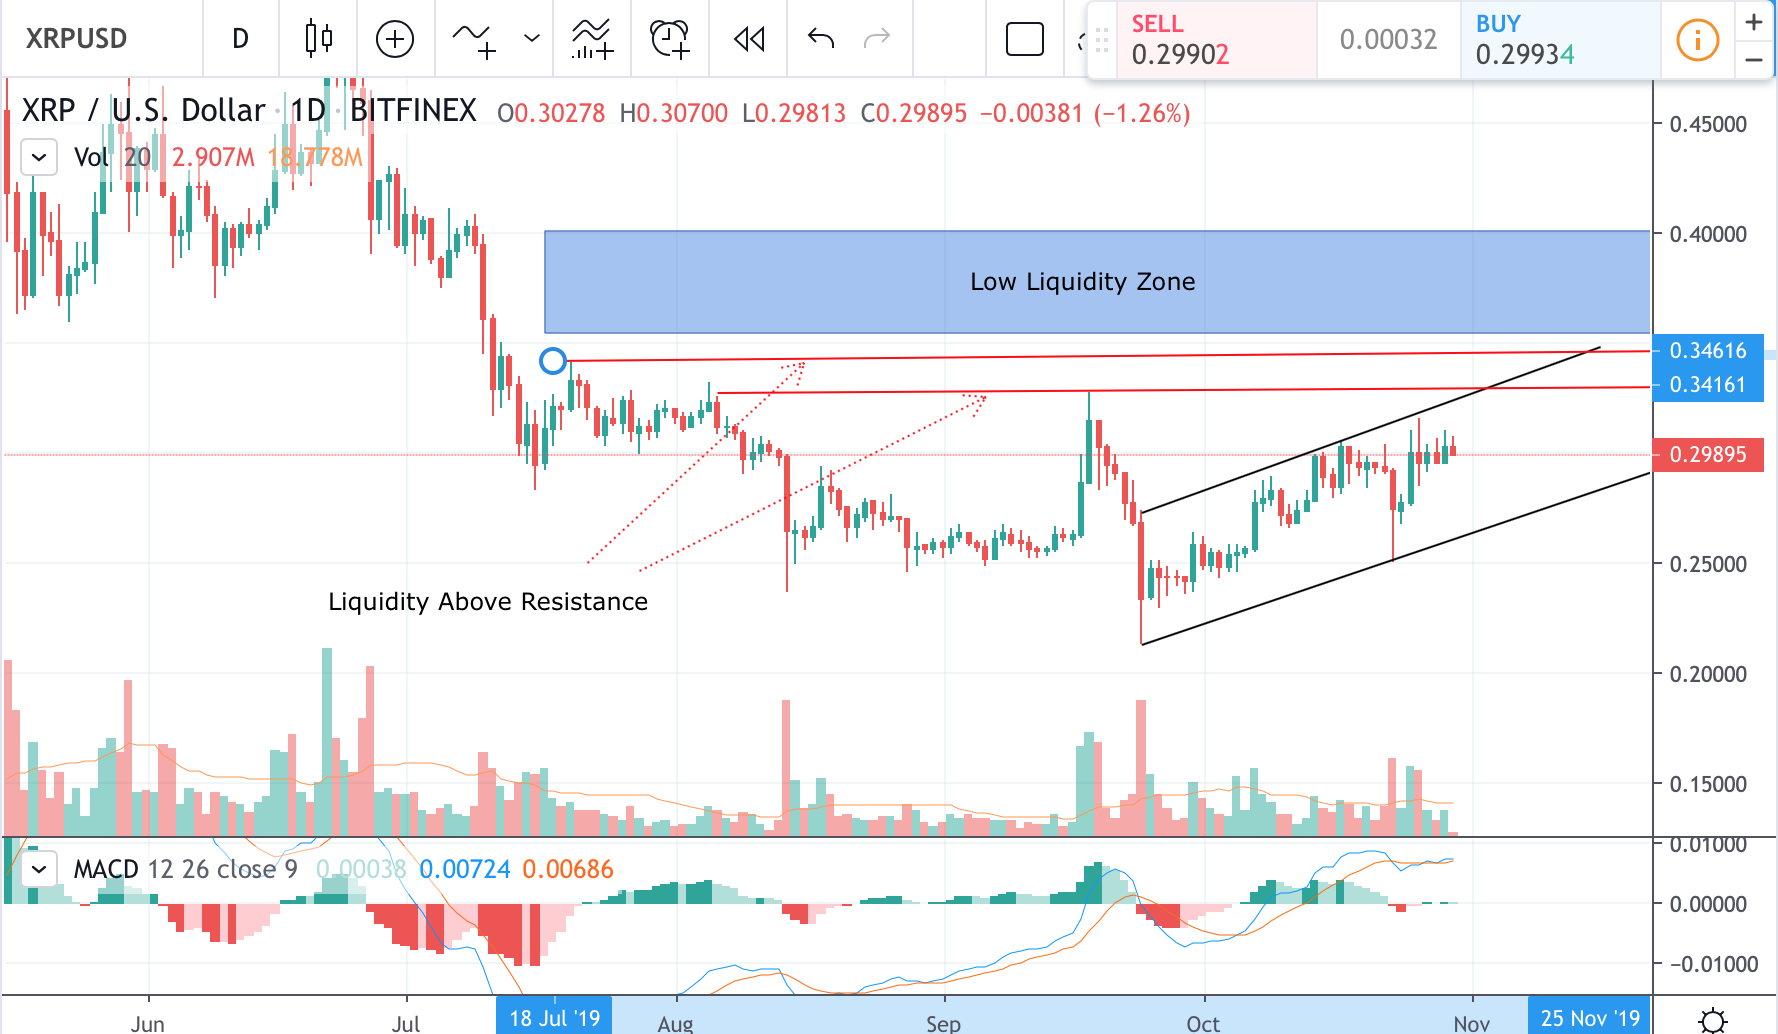
XRP value today is just under 30 cents. The price broke that important resistance line several times in the past 24 hours and is consolidating around that level now. There is a clear ascending channel visible on the 1 Day trading chart, so if XRP price will drop, we may see it going as low as $0.26250 at the moment. However, considering the fact that MACD indicator printed bullish crossover a few days ago, it is much more likely that XRP price will continue to search for liquidity above resistance.
In the short term, the price may hike above $0.32800, because that is were the closest area of liquidity lies. In near future, XRP price may go just above $0.34400 to tap into liquidity and trap some stop losses above that level. If afterward price manages to continue its uptrend, it may well soar up to $0.40 passing quickly through the area of low liquidity.
Disclaimer: Markets, instruments, and advice on this page are for informational purposes only and should not in any way come across as a recommendation to buy or sell in these assets. You should do your own thorough research before making any investment decisions.
The post XRP Price Technical Analysis on One Day Chart appeared first on Latest Ripple (XRP) News & Price Analysis.
OhNoRipple via https://ift.tt/2PblI7a @RippleCoinNews, @Khareem Sudlow