
Too Obvious? Current Bitcoin Price Action Resembles $3,200 Bottom
The past few months haven’t been kind to Bitcoin bulls. Since peaking in June, the cryptocurrency’s price has fallen from $14,000 to the $7,700 low set last week.
While the macro backdrop is evidently different, as are the fundamentals of the cryptocurrency market, many analysts have argued that the recent collapse in the Bitcoin price was a microcosm or fractal of 2018’s bear market.
Their assertion may actually have bullish implications for Bitcoin.
Related Reading: Crypto Market Death Cross Inches Closer, Will The Bear Market Return?
Reminiscent of 2018’s Bottom
In late-September, the price of BTC tumbled off a proverbial cliff, falling from $10,100 to under $8,000 in a week, as bears finally won a multi-month tug-of-war against the bulls.
While seemingly random, a number of analysts have noted that this seeming capitulation was similar to what took place in November and December of 2018, during which Bitcoin fell from $6,000 to $3,000 in a short period of time. Crypto Hamster recently wrote:
“It is too obvious to be true, but I have to admit that the drop from 6k to 3k and the following price action indeed looks very similar to what we have now.”
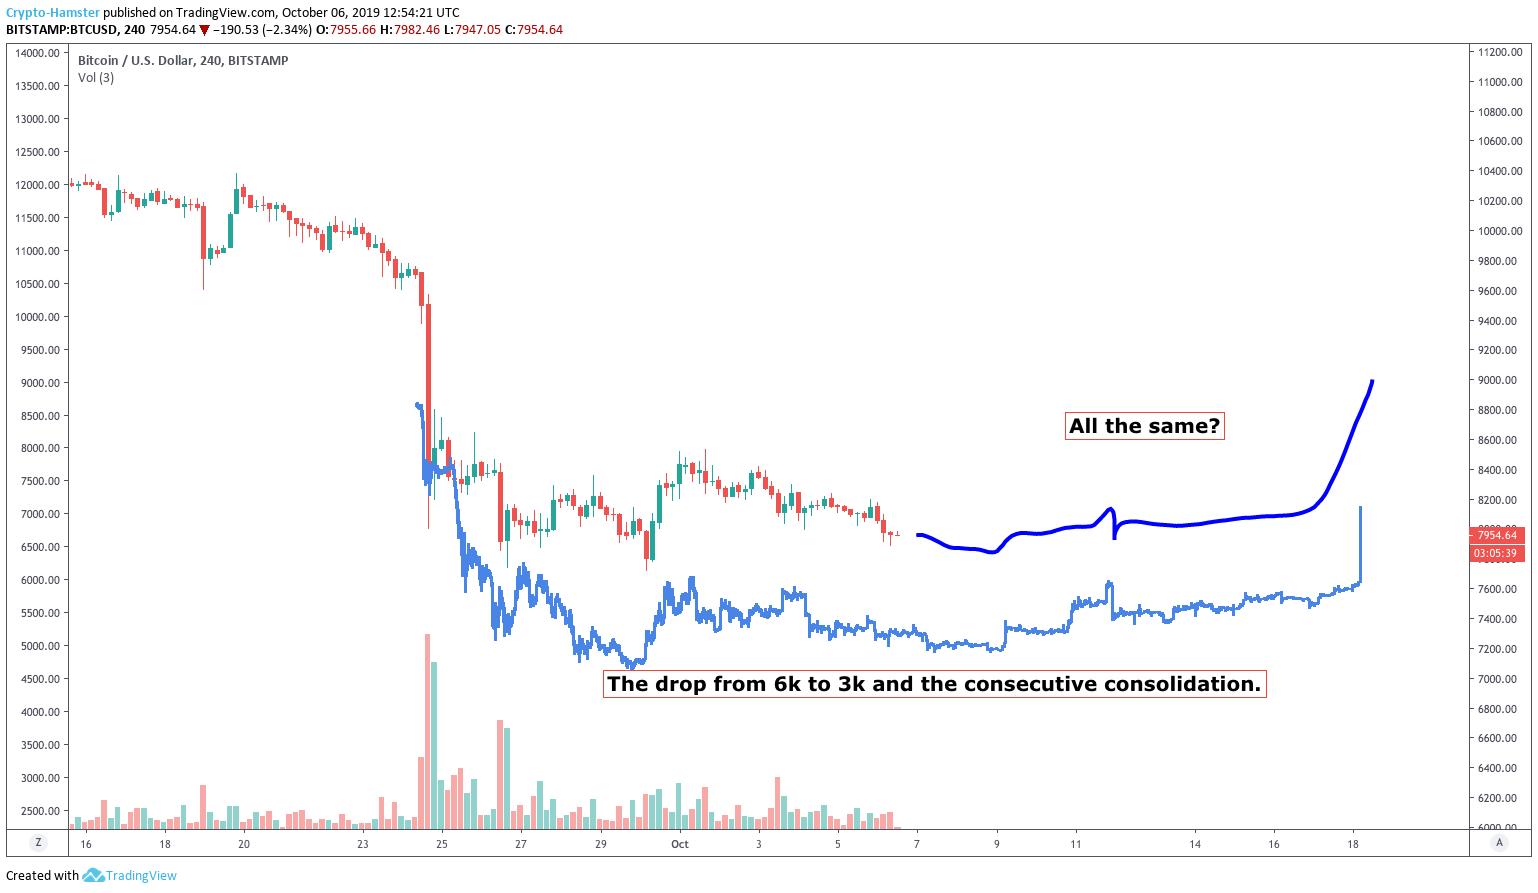
What he is implying is that Bitcoin may soon break to the upside, having bottomed in the recent flash crash.
Dave the Wave has corroborated this fractal, recently posting the chart below, which shows that Bitcoin’s entire price action from the $14,000 top until now resembles all the price action that took place in 2018.
Here is the whole movement mapped keeping the same proportions suggesting the bottom is in. Though an interesting comparison, I don't think so useful here in predicting the bottom. pic.twitter.com/sv6kHlX2JC
— dave the wave (@davthewave) September 30, 2019
The above analyst, however, did mention that he believes that the 2018 bear market fractal isn’t so useful in predicting the bottom, making reference to his $6,800 Bitcoin price target still on the table.
Related Reading: Analyst: Bitcoin Likely to Move Towards $7,600 as Bulls Falter
Bitcoin Price Reversal Starting?
Regardless, there are technical analyses to suggest that a price reversal may be inbound off this seeming bottom. An analyst recently wrote that Bitcoin’s four-hour chart looks “promising”, with there being an uptrend forming for both the Relative Strength Index and the Moving Average Convergence Divergence (MACD) — a sign that they claim is an indication that “we may have a bottom”.
That’s not all. Per previous reports from NewsBTC, the crypto market’s total capitalization recently printed a bullish divergence on its three-day chart.
As he depicted in the tweet that can be seen below, the three-day Stochastic has started to trend higher, seeing higher lows, as the market cap has entered a brief downtrend, seeing lower lows — a bullish divergence that demonstrates that bears are losing control to bulls. Bullish divergences can often mark the end of a downtrend.
Related Reading: Fractal: Bitcoin Price Likely to Hit $7,500 Before Rally to New Highs
Featured Image from Shutterstock
The post Too Obvious? Current Bitcoin Price Action Resembles $3,200 Bottom appeared first on NewsBTC.
OhNoCrypto
via https://www.ohnocrypto.com
Nick Chong, Khareem Sudlow